一、安装Loust
之前已写过,这里忽略一万字。。。
Locust初次体验【解决webUI没数据】_Vikesgao的博客-CSDN博客
二、安装prometheus
Prometheus 是一个开源的服务监控系统和时序数据库,其提供了通用的数据模型和快捷数据采集、存储和查询接口。它的核心组件Prometheus server会定期从静态配置的监控目标或者基于服务发现自动配置的自标中进行拉取数据,当新拉取到的数据大于配置的内存缓存区时,数据就会持久化到存储设备当中。
1.每个被监控的主机都可以通过专用的exporter 程序提供输出监控数据的接口,它会在目标处收集监控数据,并暴露出一个HTTP接口供Prometheus server查询,Prometheus通过基于HTTP的pull的方式来周期性的采集数据。
2.任何被监控的目标都需要事先纳入到监控系统中才能进行时序数据采集、存储、告警和展示,监控目标可以通过配置信息以静态形式指定,也可以让Prometheus通过服务发现的机制进行动态管理。
3.Prometheus 能够直接把API Server作为服务发现系统使用,进而动态发现和监控集群中的所有可被监控的对象。
本次是安装到Centos7,所有下载一下Linus版本

下载压缩包
wget http://github.com/prometheus/prometheus/releases/download/v2.44.0/prometheus-2.44.0.linux-amd64.tar.gz

解压
tar -zvxf prometheus-2.44.0.linux-amd64.tar.gz

进入prometheus文件夹
cd prometheus-2.44.0.linux-amd64

启动prometheus
./prometheus --config.file=prometheus.yml &
访问页面-localhost:9090 或 ip:9090,正常访问Prometheus页面表示安装成功

三、添加locust服务到Prometheus
# 编辑prometheus.yml,注意填写服务master IP : port


# my global config
global:
  scrape_interval: 15s # Set the scrape interval to every 15 seconds. Default is every 1 minute.
  evaluation_interval: 15s # Evaluate rules every 15 seconds. The default is every 1 minute.
  # scrape_timeout is set to the global default (10s).

# Alertmanager configuration
alerting:
  alertmanagers:
    - static_configs:
        - targets:
          # - alertmanager:9093

# Load rules once and periodically evaluate them according to the global 'evaluation_interval'.
rule_files:
  # - "first_rules.yml"
  # - "second_rules.yml"

# A scrape configuration containing exactly one endpoint to scrape:
# Here it's Prometheus itself.
scrape_configs:
  # The job name is added as a label `job=<job_name>` to any timeseries scraped from this config.
  - job_name: "prometheus"

    # metrics_path defaults to '/metrics'
    # scheme defaults to 'http'.

    static_configs:
      - targets: ["192.168.24.228:9090"]
        labels:
          instance: prometheus

  - job_name: locust

    metrics_path: '/export/prometheus'
    static_configs:
      - targets: ['192.168.24.228:8089']
        labels:
          instance: locust
编辑配置文件,注意重新启动服务或重启centos7也行
----运行locust----指定运行prometheus_exporter.py
# centos7 作为主控运行刚才的监控文件
locust -f prometheus_exporter.py --master


prometheus_exporter.py
直接复制下面代码进行监察服务


# coding: utf8

import six
from itertools import chain

from flask import request, Response
from locust import stats as locust_stats, runners as locust_runners
from locust import User, task, events
from prometheus_client import Metric, REGISTRY, exposition
import os, sys
from locust import task, tag, TaskSet
from locust import HttpUser
pathS = os.getcwd()
Project_Path = os.path.dirname(os.path.dirname(os.path.dirname(pathS)))
root_Path = os.path.dirname(pathS)
sys.path.append(Project_Path)
sys.path.append(root_Path)

# This locustfile adds an external web endpoint to the locust master, and makes it serve as a prometheus exporter.
# Runs it as a normal locustfile, then points prometheus to it.
# locust -f prometheus_exporter.py --master

# Lots of code taken from [mbolek's locust_exporter](https://github.com/mbolek/locust_exporter), thx mbolek!


class LocustCollector(object):
    registry = REGISTRY

    def __init__(self, environment, runner):
        self.environment = environment
        self.runner = runner

    def collect(self):
        # collect metrics only when locust runner is spawning or running.
        runner = self.runner

        if runner and runner.state in (locust_runners.STATE_SPAWNING, locust_runners.STATE_RUNNING):
            stats = []
            for s in chain(locust_stats.sort_stats(runner.stats.entries), [runner.stats.total]):
                stats.append({
                    "method": s.method,
                    "name": s.name,
                    "num_requests": s.num_requests,
                    "num_failures": s.num_failures,
                    "avg_response_time": s.avg_response_time,
                    "min_response_time": s.min_response_time or 0,
                    "max_response_time": s.max_response_time,
                    "current_rps": s.current_rps,
                    "median_response_time": s.median_response_time,
                    "ninetieth_response_time": s.get_response_time_percentile(0.9),
                    # only total stats can use current_response_time, so sad.
                    # "current_response_time_percentile_95": s.get_current_response_time_percentile(0.95),
                    "avg_content_length": s.avg_content_length,
                    "current_fail_per_sec": s.current_fail_per_sec
                })

            # perhaps StatsError.parse_error in e.to_dict only works in python slave, take notices!
            errors = [e.to_dict() for e in six.itervalues(runner.stats.errors)]

            metric = Metric('locust_user_count', 'Swarmed users', 'gauge')
            metric.add_sample('locust_user_count', value=runner.user_count, labels={})
            yield metric

            metric = Metric('locust_errors', 'Locust requests errors', 'gauge')
            for err in errors:
                metric.add_sample('locust_errors', value=err['occurrences'],
                                  labels={'path': err['name'], 'method': err['method'],
                                          'error': err['error']})
            yield metric

            is_distributed = isinstance(runner, locust_runners.MasterRunner)
            if is_distributed:
                metric = Metric('locust_slave_count', 'Locust number of slaves', 'gauge')
                metric.add_sample('locust_slave_count', value=len(runner.clients.values()), labels={})
                yield metric

            metric = Metric('locust_fail_ratio', 'Locust failure ratio', 'gauge')
            metric.add_sample('locust_fail_ratio', value=runner.stats.total.fail_ratio, labels={})
            yield metric

            metric = Metric('locust_state', 'State of the locust swarm', 'gauge')
            metric.add_sample('locust_state', value=1, labels={'state': runner.state})
            yield metric

            stats_metrics = ['avg_content_length', 'avg_response_time', 'current_rps', 'current_fail_per_sec',
                             'max_response_time', 'ninetieth_response_time', 'median_response_time',
                             'min_response_time',
                             'num_failures', 'num_requests']

            for mtr in stats_metrics:
                mtype = 'gauge'
                if mtr in ['num_requests', 'num_failures']:
                    mtype = 'counter'
                metric = Metric('locust_stats_' + mtr, 'Locust stats ' + mtr, mtype)
                for stat in stats:
                    # Aggregated stat's method label is None, so name it as Aggregated
                    # locust has changed name Total to Aggregated since 0.12.1
                    if 'Aggregated' != stat['name']:
                        metric.add_sample('locust_stats_' + mtr, value=stat[mtr],
                                          labels={'path': stat['name'], 'method': stat['method']})
                    else:
                        metric.add_sample('locust_stats_' + mtr, value=stat[mtr],
                                          labels={'path': stat['name'], 'method': 'Aggregated'})
                yield metric


@events.init.add_listener
def locust_init(environment, runner, **kwargs):
    print("locust init event received")
    if environment.web_ui and runner:
        @environment.web_ui.app.route("/export/prometheus")
        def prometheus_exporter():
            registry = REGISTRY
            encoder, content_type = exposition.choose_encoder(request.headers.get('Accept'))
            if 'name[]' in request.args:
                registry = REGISTRY.restricted_registry(request.args.get('name[]'))
            body = encoder(registry)
            return Response(body, content_type=content_type)

        REGISTRY.register(LocustCollector(environment, runner))


class Dummy(User):
    @task(20)
    def hello(self):
        pass
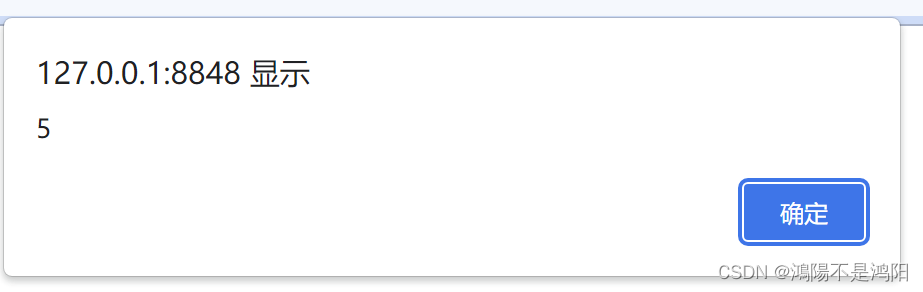
重启后访问192.168.24.228:8089/export/prometheus,页面显示下截图,表示已经可以成功了

四、安装Grafana
# 下载
wget https://dl.grafana.com/enterprise/release/grafana-enterprise-8.5.3-1.x86_64.rpm
# 安装
yum -y install grafana-enterprise-8.5.3-1.x86_64.rpm

#设置grafana服务开机自启,并启动服务

systemctl daemon-reload

systemctl enable grafana-server.service

systemctl start grafana-server.service
访问IP:3000页面

五、添加prometheus数据源
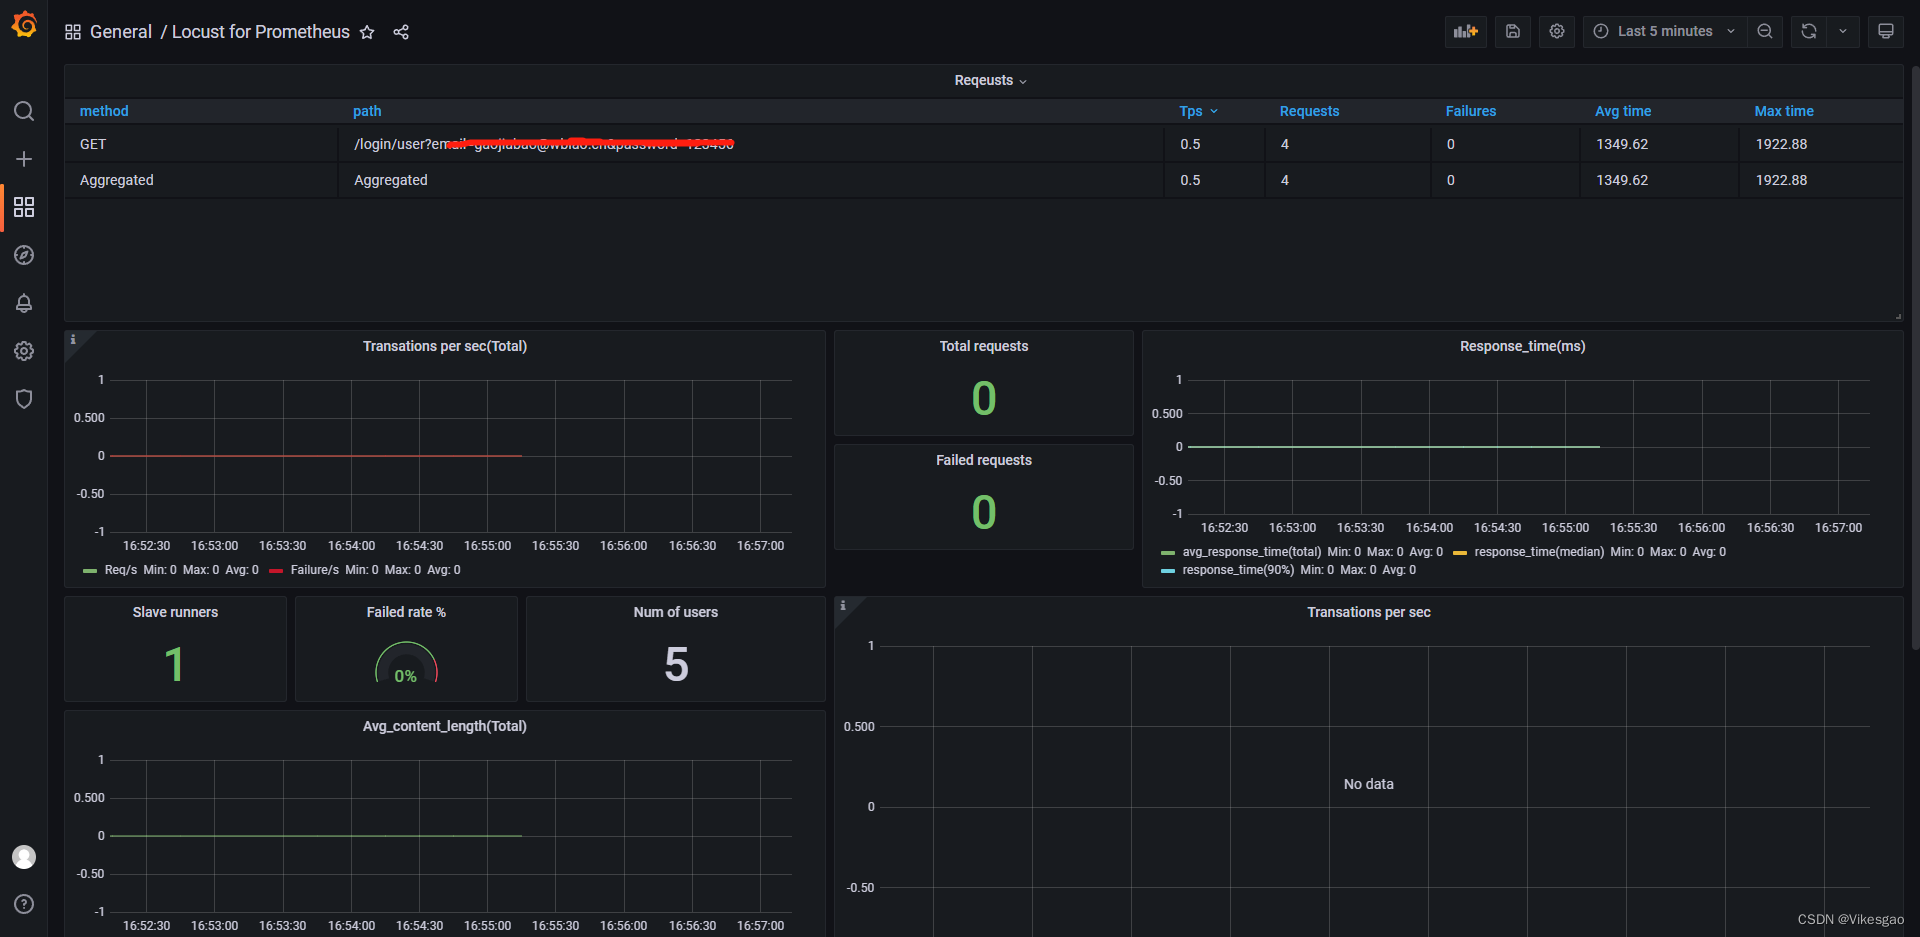
填写IP、端口即可,然后保存

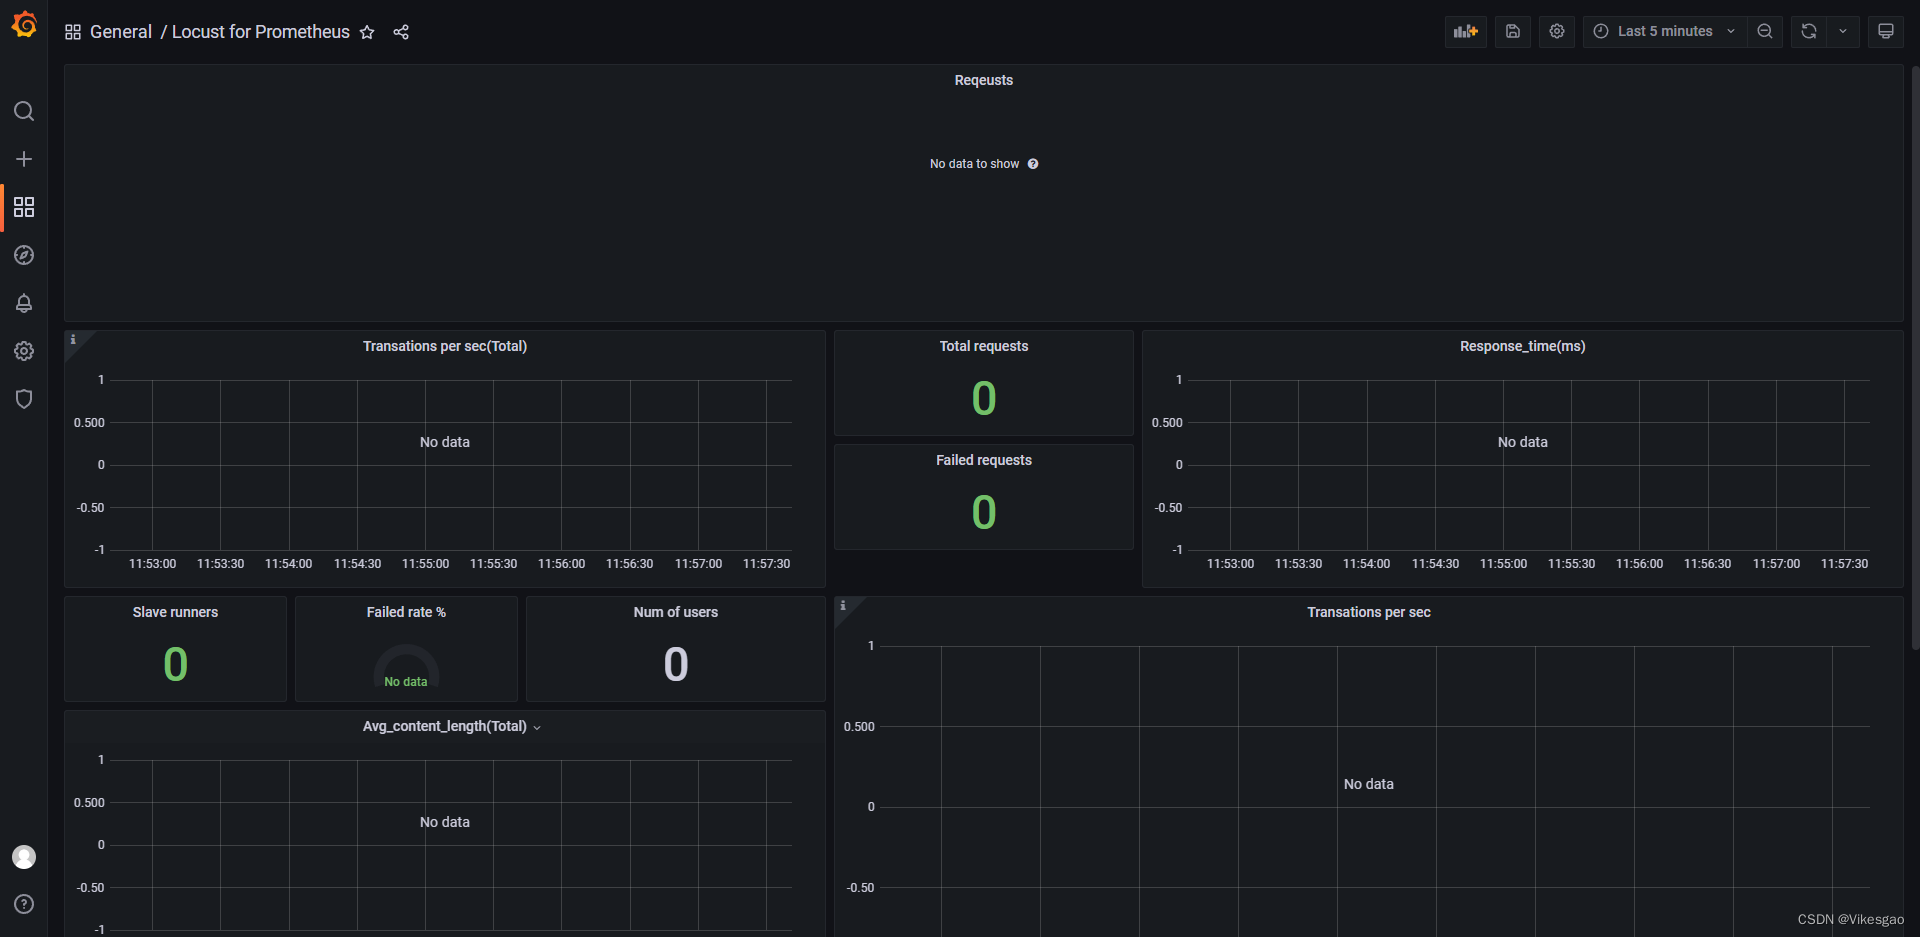
再导入需要模版【locust for prometheus】
六、master 及 worker命令启动
# Centos7 master启动
locust -f prometheus_exporter.py --master

# 负载加压设备 worker启动,默认使用5557端口
locust -f locustfile.py --worker --master-host=192.168.24.228 --master-port=5557
待解决问题---【未完】:
1.locust主从执行脚本,General有执行用户数,但没有显示请求数据【已解决】
# locustfile.py


# 【Centos-Jenkins执行路径】/var/lib/jenkins/workspace/GitBlit_pull/other/WB_Locust/my_locustfiles

import os, sys

pathS = os.getcwd()
Project_Path = os.path.dirname(os.path.dirname(os.path.dirname(pathS)))
root_Path = os.path.dirname(pathS)
sys.path.append(Project_Path)
sys.path.append(root_Path)

from locust import HttpUser, FastHttpUser, task, between, User, constant, constant_pacing, constant_throughput, events, LoadTestShape
from other.WB_Locust.my_locustfiles.locustfile_performance import performance_Test
from other.WB_Locust.my_locustfiles.prometheus_exporter import *

class ttt(HttpUser):
    host = 'http://m-test.wbiaotest.cn'
    tasks = [performance_Test]
    wait_time = between(1, 3)
# locust压测文件必须主从设备上都需要有
# prometheus_exporter.py
# coding: utf8
import os, sys
pathS = os.getcwd()
Project_Path = os.path.dirname(os.path.dirname(os.path.dirname(pathS)))
root_Path = os.path.dirname(pathS)
sys.path.append(Project_Path)
sys.path.append(root_Path)
import six
from itertools import chain
from flask import request, Response
from locust import stats as locust_stats, runners as locust_runners
from locust import User, task, events, HttpUser, between
from prometheus_client import Metric, REGISTRY, exposition
from other.WB_Locust.my_locustfiles.locustfile_performance import performance_Test
# This locustfile adds an external web endpoint to the locust master, and makes it serve as a prometheus exporter.
# Runs it as a normal locustfile, then points prometheus to it.
# locust -f prometheus_exporter.py --master
# Lots of code taken from [mbolek's locust_exporter](https://github.com/mbolek/locust_exporter), thx mbolek!
class LocustCollector(object):
registry = REGISTRY
def __init__(self, environment, runner):
self.environment = environment
self.runner = runner
def collect(self):
# collect metrics only when locust runner is spawning or running.
runner = self.runner
if runner and runner.state in (locust_runners.STATE_SPAWNING, locust_runners.STATE_RUNNING):
stats = []
for s in chain(locust_stats.sort_stats(runner.stats.entries), [runner.stats.total]):
stats.append({
"method": s.method,
"name": s.name,
"num_requests": s.num_requests,
"num_failures": s.num_failures,
"avg_response_time": s.avg_response_time,
"min_response_time": s.min_response_time or 0,
"max_response_time": s.max_response_time,
"current_rps": s.current_rps,
"median_response_time": s.median_response_time,
"ninetieth_response_time": s.get_response_time_percentile(0.9),
# only total stats can use current_response_time, so sad.
# "current_response_time_percentile_95": s.get_current_response_time_percentile(0.95),
"avg_content_length": s.avg_content_length,
"current_fail_per_sec": s.current_fail_per_sec
})
# perhaps StatsError.parse_error in e.to_dict only works in python slave, take notices!
errors = [e.to_dict() for e in six.itervalues(runner.stats.errors)]
metric = Metric('locust_user_count', 'Swarmed users', 'gauge')
metric.add_sample('locust_user_count', value=runner.user_count, labels={})
yield metric
metric = Metric('locust_errors', 'Locust requests errors', 'gauge')
for err in errors:
metric.add_sample('locust_errors', value=err['occurrences'],
labels={'path': err['name'], 'method': err['method'],
'error': err['error']})
yield metric
is_distributed = isinstance(runner, locust_runners.MasterRunner)
if is_distributed:
metric = Metric('locust_slave_count', 'Locust number of slaves', 'gauge')
metric.add_sample('locust_slave_count', value=len(runner.clients.values()), labels={})
yield metric
metric = Metric('locust_fail_ratio', 'Locust failure ratio', 'gauge')
metric.add_sample('locust_fail_ratio', value=runner.stats.total.fail_ratio, labels={})
yield metric
metric = Metric('locust_state', 'State of the locust swarm', 'gauge')
metric.add_sample('locust_state', value=1, labels={'state': runner.state})
yield metric
stats_metrics = ['avg_content_length', 'avg_response_time', 'current_rps', 'current_fail_per_sec',
'max_response_time', 'ninetieth_response_time', 'median_response_time',
'min_response_time',
'num_failures', 'num_requests']
for mtr in stats_metrics:
mtype = 'gauge'
if mtr in ['num_requests', 'num_failures']:
mtype = 'counter'
metric = Metric('locust_stats_' + mtr, 'Locust stats ' + mtr, mtype)
for stat in stats:
# Aggregated stat's method label is None, so name it as Aggregated
# locust has changed name Total to Aggregated since 0.12.1
if 'Aggregated' != stat['name']:
metric.add_sample('locust_stats_' + mtr, value=stat[mtr],
labels={'path': stat['name'], 'method': stat['method']})
else:
metric.add_sample('locust_stats_' + mtr, value=stat[mtr],
labels={'path': stat['name'], 'method': 'Aggregated'})
yield metric
@events.init.add_listener
def locust_init(environment, runner, **kwargs):
print("locust init event received")
if environment.web_ui and runner:
@environment.web_ui.app.route("/export/prometheus")
def prometheus_exporter():
registry = REGISTRY
encoder, content_type = exposition.choose_encoder(request.headers.get('Accept'))
if 'name[]' in request.args:
registry = REGISTRY.restricted_registry(request.args.get('name[]'))
body = encoder(registry)
return Response(body, content_type=content_type)
REGISTRY.register(LocustCollector(environment, runner))
# class Dummy(User):
# @task(20)
# def hello(self):
# pass
# 调用压测类
class ttt(HttpUser):
host = 'http://m-test.wbiaotest.cn'
tasks = [performance_Test]
wait_time = between(1, 3)