文章目录
- 一、前言
- 二、案例解说
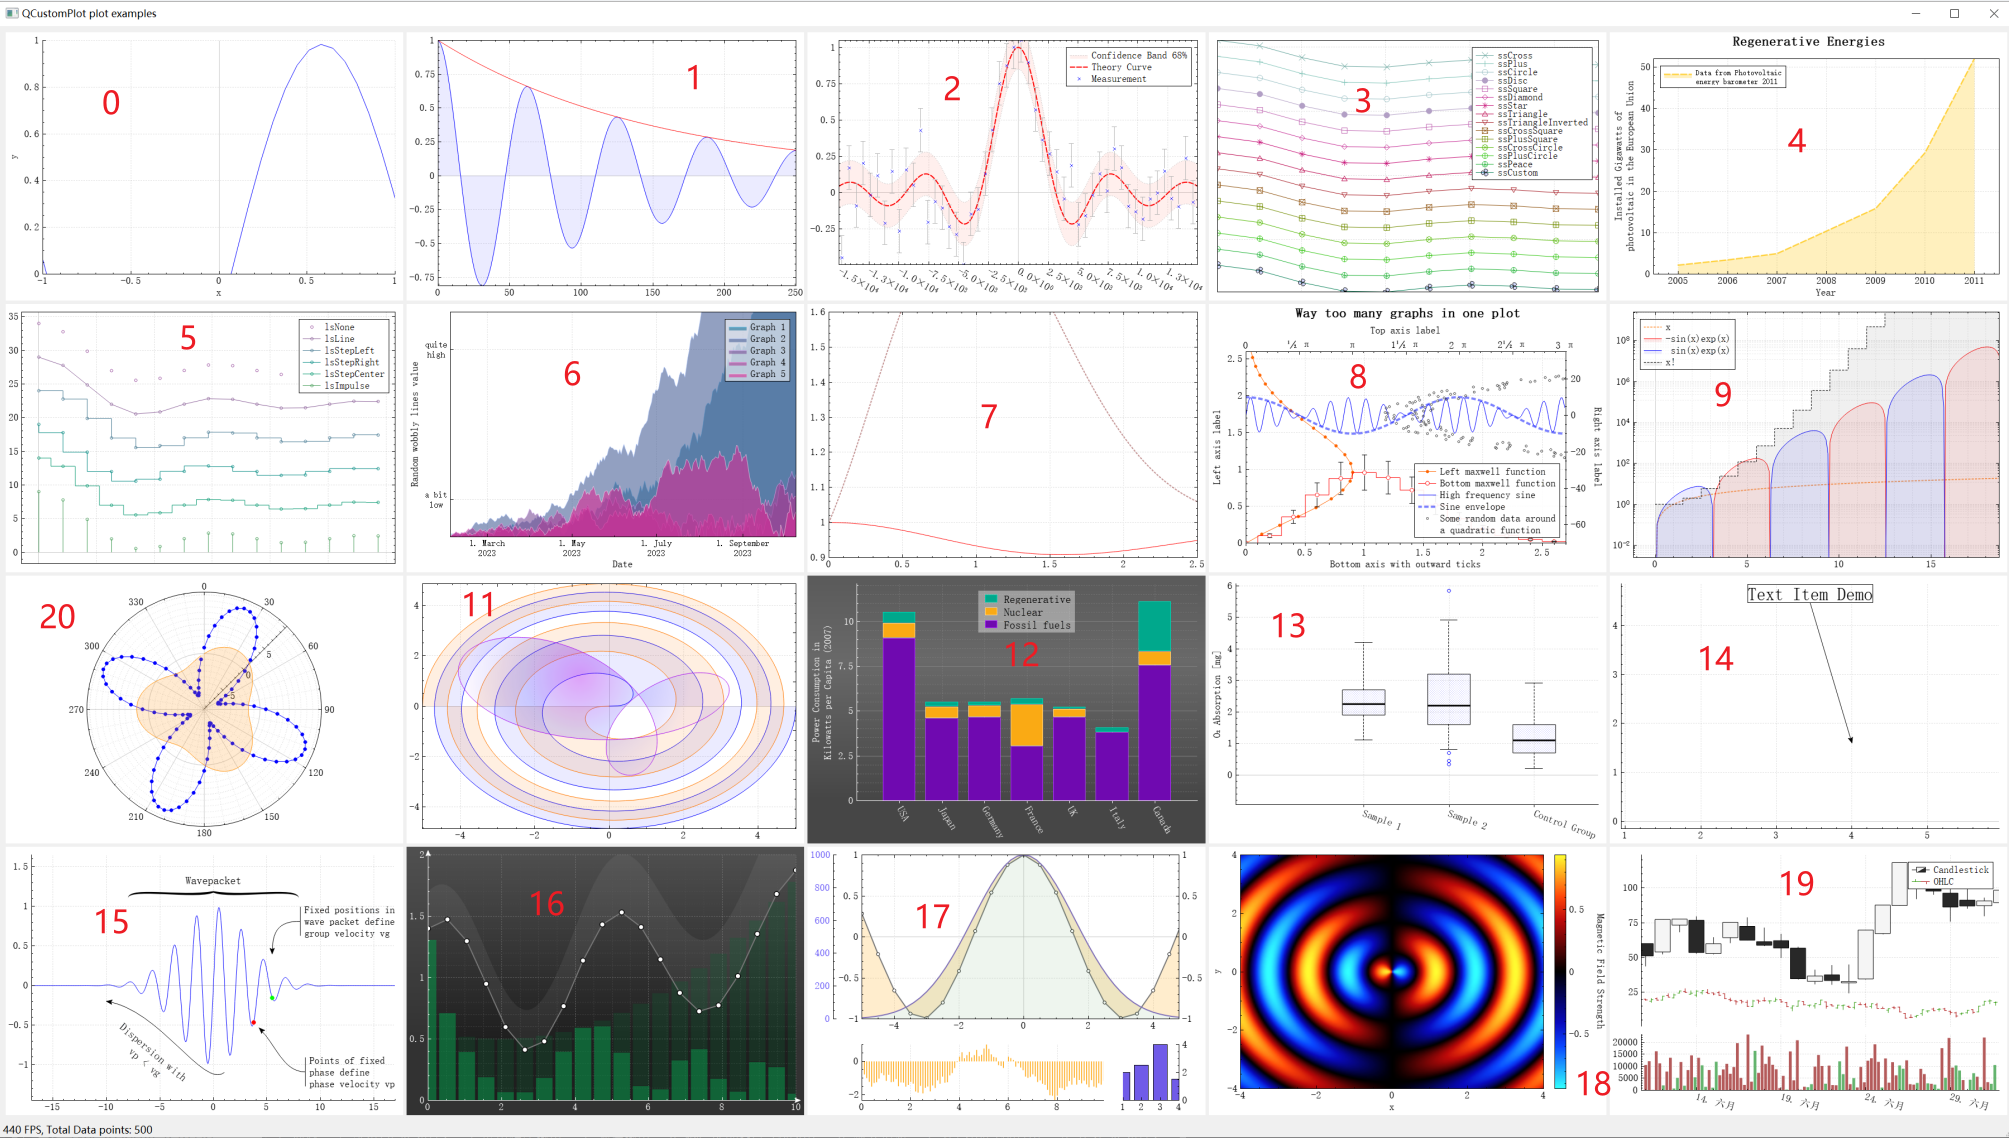
- 0:Quadratic Demo【二次曲线demo】
- 1、Simple Demo【简单demo】
- 2、Sinc Scatter Demo【Sinc函数散点demo】
- 3、Scatter Style Demo【散点样式demo】
- 4、Line Style Demo【线型demo】
- 5、Scatter Pixmap Demo【图标散点demo】
- 6、Date Demo【日期demo】
- 7、Texture Brush Demo【纹理画刷demo】
- 8、Multi Axis Demo【多坐标轴demo】
- 9、Logarithmic Demo【对数demo】
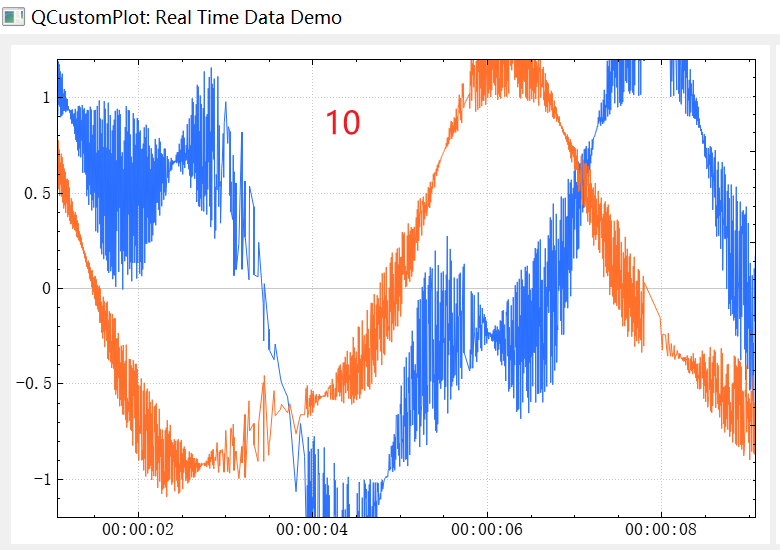
- 10、Real Time Data Demo【实时数据demo】
一、前言
在学习一个陌生的东西时,我们常常希望有人能指引你,不然自己就会不知道从哪里入手。
官方提供的例子就是指引你的那个人,可以看看官方是怎么使用这个库的,QCustomPlot的绘图例子就在下载的文件夹中:
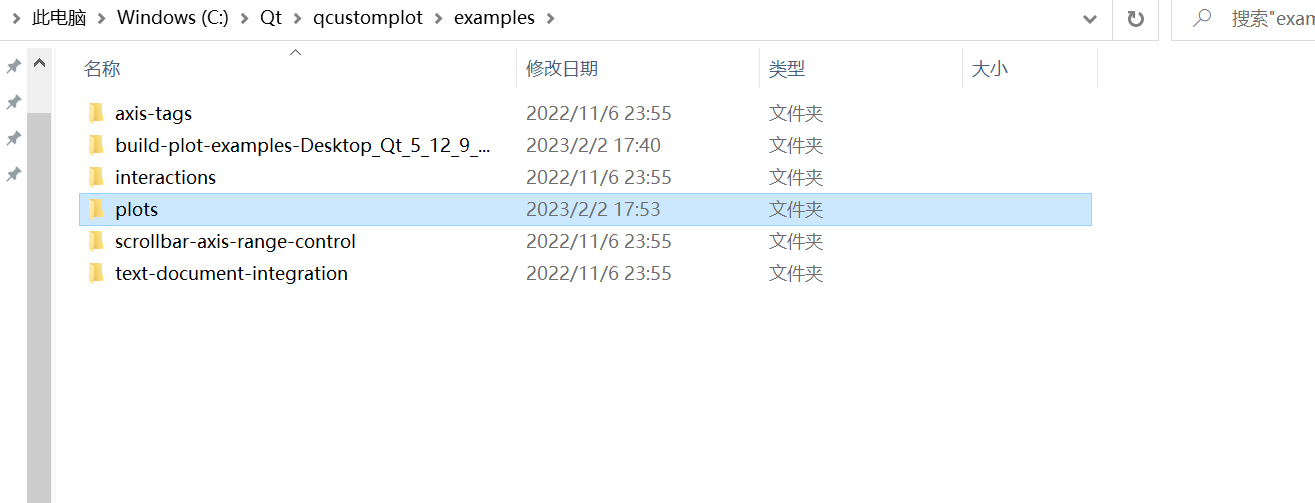
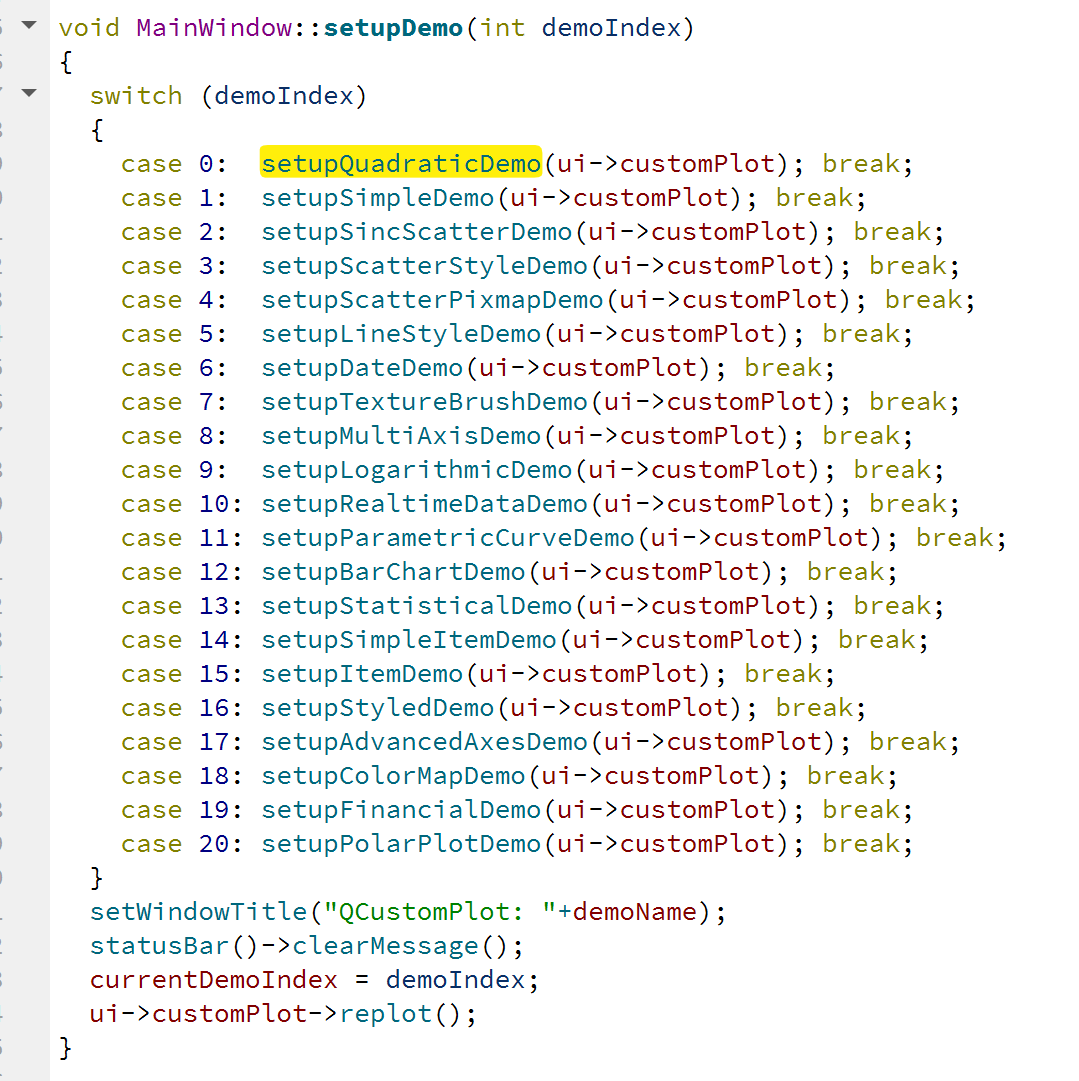
使用Qt Creator打开 【plots】这个工程,通过代码可以看到官方提供了21个例子:
二、案例解说
0:Quadratic Demo【二次曲线demo】
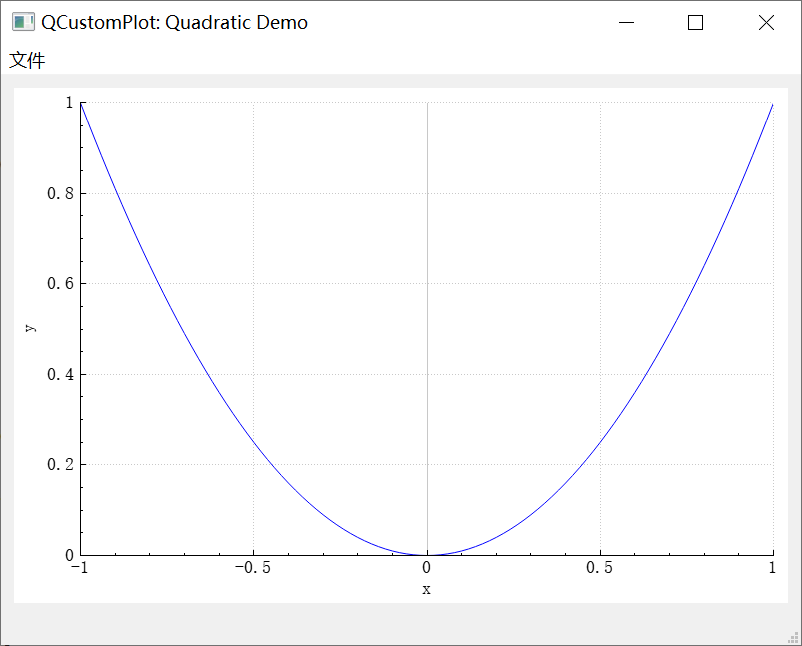
void MainWindow::setupQuadraticDemo(QCustomPlot *customPlot)
{
  demoName = "Quadratic Demo";
  //准备数据,101个点的曲线数据,分为两个QVector,分别是x,y
  QVector<double> x(101), y(101); // initialize with entries 0..100
  for (int i=0; i<101; ++i)
  {
    x[i] = i/50.0 - 1; // x goes from -1 to 1
    y[i] = x[i]*x[i];  // let's plot a quadratic function
  }
  //创建一个图层到图表QCustomPlot,使用addGraph()可以创建一个图层到图表并置顶(可以理解为Z层序递增)
  customPlot->addGraph();
  //给刚刚创建的图层设置数据,使用graph(int zIndex)可以访问图层
  customPlot->graph(0)->setData(x, y);
  //设置X轴和Y轴的标签,表示X轴和Y轴分别代表的数据
  customPlot->xAxis->setLabel("x");
  customPlot->yAxis->setLabel("y");
  //设置X轴和Y轴的范围
  customPlot->xAxis->setRange(-1, 1);
  customPlot->yAxis->setRange(0, 1);
}
1、Simple Demo【简单demo】
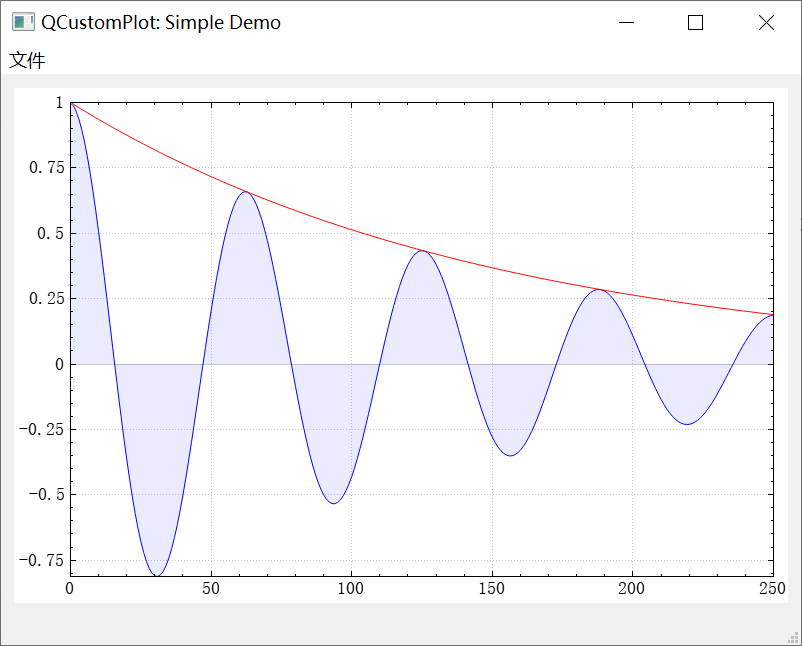
void MainWindow::setupSimpleDemo(QCustomPlot *customPlot)
{
  demoName = "Simple Demo";

  //添加两个图层
  //添加第一个图层
  customPlot->addGraph();
  customPlot->graph(0)->setPen(QPen(Qt::blue)); //设置第一个图层的画笔颜色:蓝色
  customPlot->graph(0)->setBrush(QBrush(QColor(0, 0, 255, 20))); //设置第一个图层的填充颜色
  //添加第二个图层
  customPlot->addGraph();
  customPlot->graph(1)->setPen(QPen(Qt::red)); //设置第一个图层的画笔颜色:红色
  //准备数据,251个点的曲线数据,分为三个QVector,分别是x,y0,y1,(x,y0)为第一个图层,(x,y1)为第二个图层
  QVector<double> x(251), y0(251), y1(251);
  for (int i=0; i<251; ++i)
  {
    x[i] = i;
    y0[i] = qExp(-i/150.0)*qCos(i/10.0); // exponentially decaying cosine
    y1[i] = qExp(-i/150.0);              // exponential envelope
  }
  //配置上侧X轴和右侧Y轴可见,但是宽度标签不可见
  customPlot->xAxis2->setVisible(true);
  customPlot->xAxis2->setTickLabels(false);
  customPlot->yAxis2->setVisible(true);
  customPlot->yAxis2->setTickLabels(false);
  //将上侧X轴和下侧X轴、右侧Y轴和左侧Y轴,范围变动,绑定,同步变换
  connect(customPlot->xAxis, SIGNAL(rangeChanged(QCPRange)), customPlot->xAxis2, SLOT(setRange(QCPRange)));
  connect(customPlot->yAxis, SIGNAL(rangeChanged(QCPRange)), customPlot->yAxis2, SLOT(setRange(QCPRange)));
  //给图层设置数据
  customPlot->graph(0)->setData(x, y0);
  customPlot->graph(1)->setData(x, y1);
  //设置第一个图层坐标轴自适应,就可以看到完整的曲线
  customPlot->graph(0)->rescaleAxes();
  //后面的图层设置图层自适应要带个true,如果缺省,则第一个图层设置自适应没用
  customPlot->graph(1)->rescaleAxes(true);
  //当然,我们也可以直接调用customPlot->rescaleAxes();来实现坐标轴自适应
  //设置画布可以通过鼠标拖动、通过鼠标滚轮放缩,设置曲线可以通过鼠标点选
  customPlot->setInteractions(QCP::iRangeDrag | QCP::iRangeZoom | QCP::iSelectPlottables);
}
2、Sinc Scatter Demo【Sinc函数散点demo】
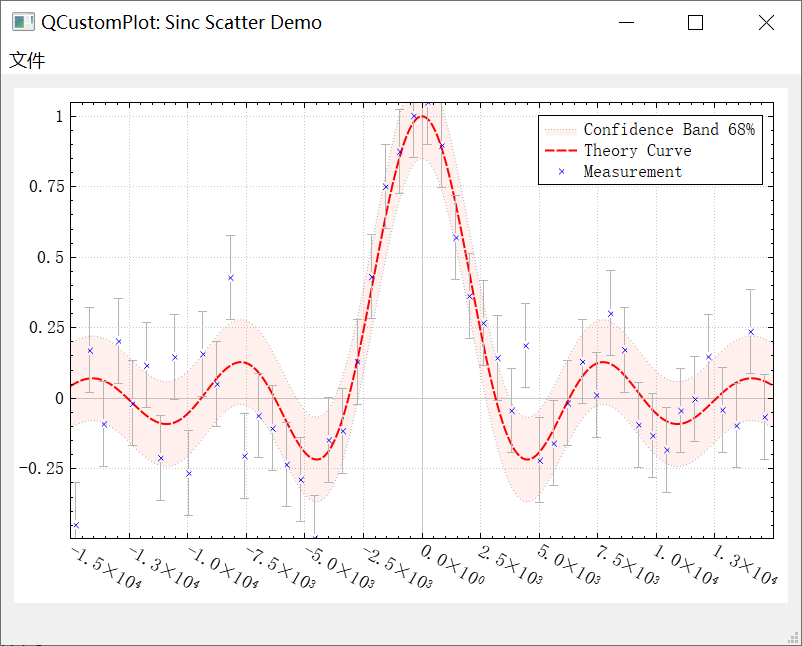
void MainWindow::setupSincScatterDemo(QCustomPlot *customPlot)
{
  demoName = "Sinc Scatter Demo";
  //设置图表的图例可见和图例字体
  customPlot->legend->setVisible(true);
  customPlot->legend->setFont(QFont("Helvetica",9));
  //设置locale为English,因此我们得到英文十进制分隔符
  customPlot->setLocale(QLocale(QLocale::English, QLocale::UnitedKingdom));
  //添加四个图层,第一个图层和第二个图层组成淡粉色的带状区域;第三个图层为红色的虚线;第四个图层为蓝色的x散点
  //添加第一个图层
  customPlot->addGraph();
  QPen pen;	//初始化画笔
  pen.setStyle(Qt::DotLine);
  pen.setWidth(1);
  pen.setColor(QColor(180,180,180));
  customPlot->graph(0)->setName("Confidence Band 68%");	//设置图层名称
  customPlot->graph(0)->setPen(pen);	//设置图层画笔
  customPlot->graph(0)->setBrush(QBrush(QColor(255,50,30,20)));	//设置图层画刷,只要设置了画刷,就会将曲线和X轴之间进行填充
  //添加第二个图层
  customPlot->addGraph();
  //移除防止显示两个confidence band在图例中
  //刚刚添加第二个图层,所以customPlot->legend->itemCount()-1就是指第二个图层
  customPlot->legend->removeItem(customPlot->legend->itemCount()-1);
  customPlot->graph(1)->setPen(pen);	//设置图层画笔
  customPlot->graph(0)->setChannelFillGraph(customPlot->graph(1));	//setChannelFillGraph():使用当前画刷填充当前图层和目标图层之间的区域
  //添加第三个图层
  customPlot->addGraph();
  pen.setStyle(Qt::DashLine);	//初始化画笔
  pen.setWidth(2);
  pen.setColor(Qt::red);
  customPlot->graph(2)->setPen(pen);	//设置图层画笔
  customPlot->graph(2)->setName("Theory Curve");	//设置图层名称
  //添加第四个图层
  customPlot->addGraph();
  customPlot->graph(3)->setPen(QPen(Qt::blue));	//设置图层画笔
  customPlot->graph(3)->setName("Measurement");	//设置图层名称
  customPlot->graph(3)->setLineStyle(QCPGraph::lsNone);	//设置图层线型
  customPlot->graph(3)->setScatterStyle(QCPScatterStyle(QCPScatterStyle::ssCross, 4));	//设置散点样式
  //添加误差线
  QCPErrorBars *errorBars = new QCPErrorBars(customPlot->xAxis, customPlot->yAxis);
  errorBars->removeFromLegend();	//从图例中移除
  errorBars->setAntialiased(false);	//设置反锯齿禁用
  errorBars->setDataPlottable(customPlot->graph(3));	//和第四个图层绑定
  errorBars->setPen(QPen(QColor(180,180,180)));	//设置误差线画笔

  // 准备数据
  QVector<double> x0(250), y0(250);
  QVector<double> yConfUpper(250), yConfLower(250);
  for (int i=0; i<250; ++i)
  {
    x0[i] = (i/249.0-0.5)*30+0.01; // by adding a small offset we make sure not do divide by zero in next code line
    y0[i] = qSin(x0[i])/x0[i]; // sinc function
    yConfUpper[i] = y0[i]+0.15;
    yConfLower[i] = y0[i]-0.15;
    x0[i] *= 1000;
  }
  QVector<double> x1(50), y1(50), y1err(50);
  for (int i=0; i<50; ++i)
  {
    // generate a gaussian distributed random number:
    double tmp1 = rand()/(double)RAND_MAX;
    double tmp2 = rand()/(double)RAND_MAX;
    double r = qSqrt(-2*qLn(tmp1))*qCos(2*M_PI*tmp2); // box-muller transform for gaussian distribution
    // set y1 to value of y0 plus a random gaussian pertubation:
    x1[i] = (i/50.0-0.5)*30+0.25;
    y1[i] = qSin(x1[i])/x1[i]+r*0.15;
    x1[i] *= 1000;
    y1err[i] = 0.15;
  }
  //设置数据到各图层
  customPlot->graph(0)->setData(x0, yConfUpper);
  customPlot->graph(1)->setData(x0, yConfLower);
  customPlot->graph(2)->setData(x0, y0);
  customPlot->graph(3)->setData(x1, y1);
  errorBars->setData(y1err);
  //设置坐标轴自适应
  customPlot->graph(2)->rescaleAxes();
  customPlot->graph(3)->rescaleAxes(true);
  //设置下侧X轴刻度标签样式
  customPlot->xAxis->setTickLabelRotation(30);	//设置刻度标签旋转30°
  customPlot->xAxis->ticker()->setTickCount(9);	//设置
  customPlot->xAxis->setNumberFormat("ebc");	//设置刻度值数字格式
  customPlot->xAxis->setNumberPrecision(1);		//设置刻度值数字精度:小数点后1位
  customPlot->xAxis->moveRange(-10);	//设置
  //设置上测X轴和右测Y轴,克隆下测X轴和左测Y轴,使得坐标轴矩形看起来更漂亮
  customPlot->axisRect()->setupFullAxesBox();
}
3、Scatter Style Demo【散点样式demo】
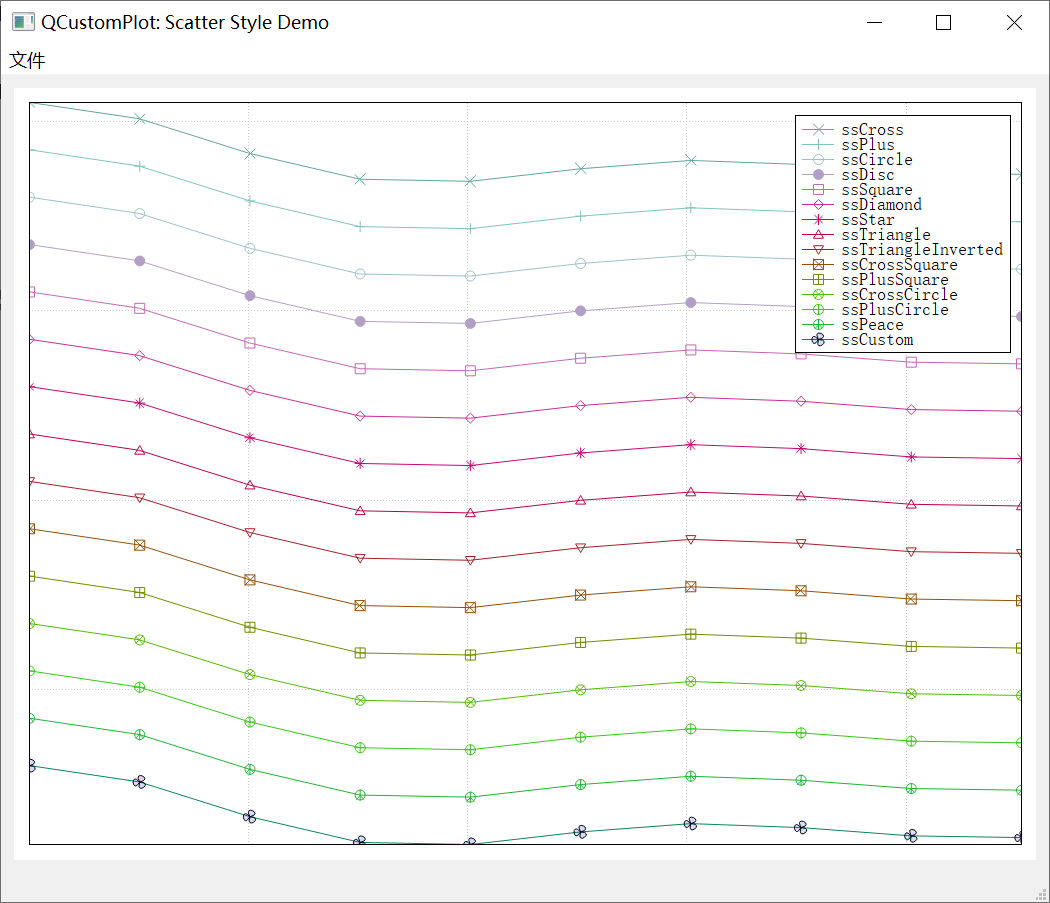
void MainWindow::setupScatterStyleDemo(QCustomPlot *customPlot)
{
  demoName = "Scatter Style Demo";
  //设置图表的图例可见、图例字体、图例行间距
  customPlot->legend->setVisible(true);
  customPlot->legend->setFont(QFont("Helvetica", 9));
  customPlot->legend->setRowSpacing(-3);
  //15种散点样式
  QVector<QCPScatterStyle::ScatterShape> shapes;
  shapes << QCPScatterStyle::ssCross;
  shapes << QCPScatterStyle::ssPlus;
  shapes << QCPScatterStyle::ssCircle;
  shapes << QCPScatterStyle::ssDisc;
  shapes << QCPScatterStyle::ssSquare;
  shapes << QCPScatterStyle::ssDiamond;
  shapes << QCPScatterStyle::ssStar;
  shapes << QCPScatterStyle::ssTriangle;
  shapes << QCPScatterStyle::ssTriangleInverted;
  shapes << QCPScatterStyle::ssCrossSquare;
  shapes << QCPScatterStyle::ssPlusSquare;
  shapes << QCPScatterStyle::ssCrossCircle;
  shapes << QCPScatterStyle::ssPlusCircle;
  shapes << QCPScatterStyle::ssPeace;
  shapes << QCPScatterStyle::ssCustom;

  QPen pen;
  //添加不同散点样式图层
  for (int i=0; i<shapes.size(); ++i)
  {
  	//添加图层
    customPlot->addGraph();
    pen.setColor(QColor(qSin(i*0.3)*100+100, qSin(i*0.6+0.7)*100+100, qSin(i*0.4+0.6)*100+100));	//初始化画笔颜色
    //准备数据
    QVector<double> x(10), y(10);
    for (int k=0; k<10; ++k)
    {
      x[k] = k/10.0 * 4*3.14 + 0.01;
      y[k] = 7*qSin(x[k])/x[k] + (shapes.size()-i)*5;
    }
    customPlot->graph()->setData(x, y);	//设置数据到图层
    customPlot->graph()->rescaleAxes(true);	//设置坐标轴自适应
    customPlot->graph()->setPen(pen);	//设置图层画笔颜色
    customPlot->graph()->setName(QCPScatterStyle::staticMetaObject.enumerator(QCPScatterStyle::staticMetaObject.indexOfEnumerator("ScatterShape")).valueToKey(shapes.at(i)));	//设置图层曲线名称
    customPlot->graph()->setLineStyle(QCPGraph::lsLine);	//设置图层曲线样式
    //设置散点样式
    if (shapes.at(i) != QCPScatterStyle::ssCustom)
    {
      customPlot->graph()->setScatterStyle(QCPScatterStyle(shapes.at(i), 10));
    }
    else
    {
      QPainterPath customScatterPath;
      for (int i=0; i<3; ++i)
        customScatterPath.cubicTo(qCos(2*M_PI*i/3.0)*9, qSin(2*M_PI*i/3.0)*9, qCos(2*M_PI*(i+0.9)/3.0)*9, qSin(2*M_PI*(i+0.9)/3.0)*9, 0, 0);
      customPlot->graph()->setScatterStyle(QCPScatterStyle(customScatterPath, QPen(Qt::black, 0), QColor(40, 70, 255, 50), 10));
    }
  }
  //设置空白坐标轴线
  customPlot->rescaleAxes();	//设置坐标轴自适应
  customPlot->xAxis->setTicks(false);	//隐藏下侧X轴刻度
  customPlot->yAxis->setTicks(false);	//隐藏左侧Y轴刻度
  customPlot->xAxis->setTickLabels(false);	//隐藏下侧X轴刻度标签
  customPlot->yAxis->setTickLabels(false);	//隐藏左侧Y轴刻度标签
  //设置上测X轴和右测Y轴,克隆下测X轴和左测Y轴,使得坐标轴矩形看起来更漂亮
  customPlot->axisRect()->setupFullAxesBox();
}
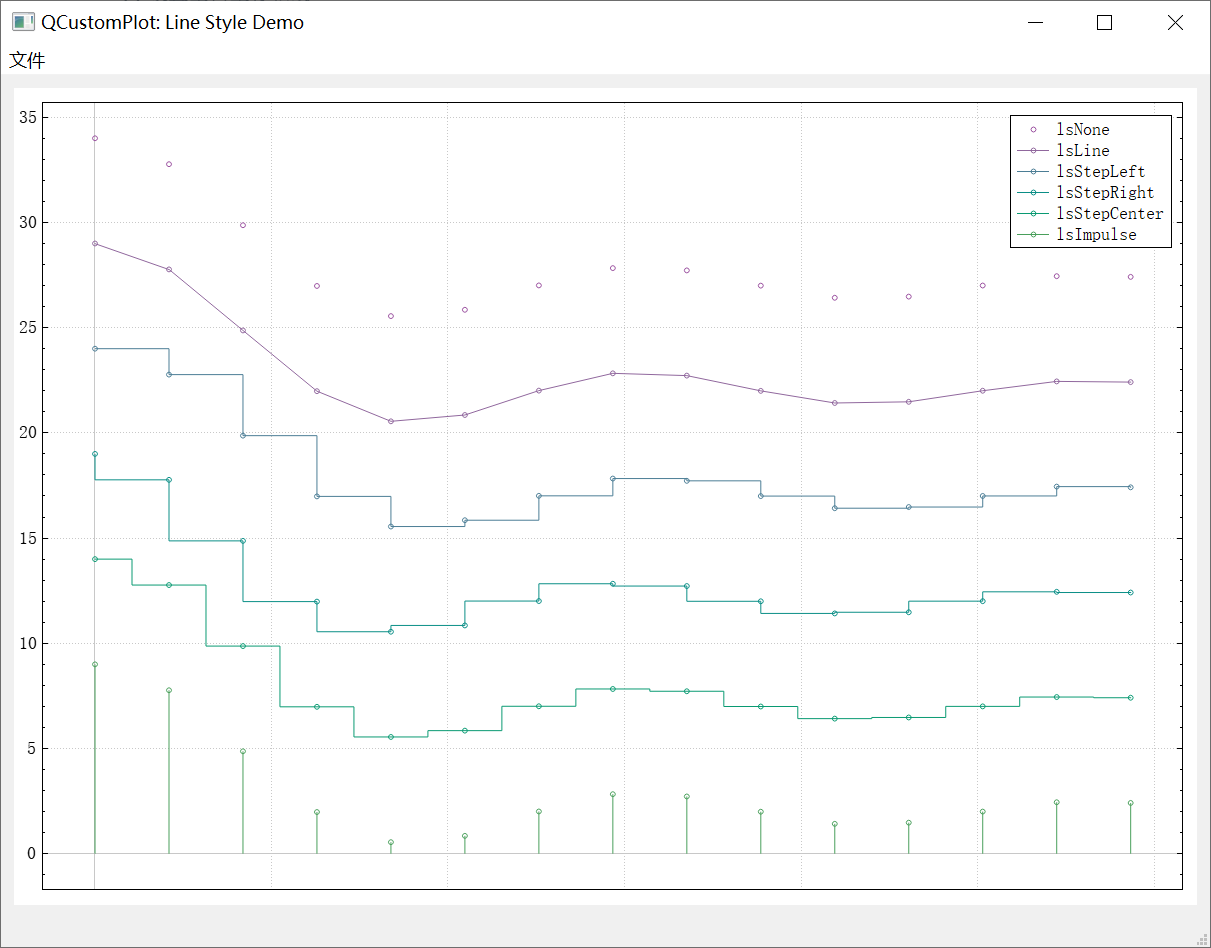
4、Line Style Demo【线型demo】
void MainWindow::setupLineStyleDemo(QCustomPlot *customPlot)
{
  demoName = "Line Style Demo";
   //设置图表的图例可见、图例字体
  customPlot->legend->setVisible(true);
  customPlot->legend->setFont(QFont("Helvetica", 9));
  QPen pen;
  //六种不同线型
  QStringList lineNames;
  lineNames << "lsNone" << "lsLine" << "lsStepLeft" << "lsStepRight" << "lsStepCenter" << "lsImpulse";
  //添加不同线型图层
  for (int i=QCPGraph::lsNone; i<=QCPGraph::lsImpulse; ++i)
  {
  	//添加图层
    customPlot->addGraph();
    pen.setColor(QColor(qSin(i*1+1.2)*80+80, qSin(i*0.3+0)*80+80, qSin(i*0.3+1.5)*80+80));	//初始化画笔
    customPlot->graph()->setPen(pen);	//设置图层画笔
    customPlot->graph()->setName(lineNames.at(i-QCPGraph::lsNone));	//设置图层曲线名称
    customPlot->graph()->setLineStyle((QCPGraph::LineStyle)i);	//设置图层曲线样式
    customPlot->graph()->setScatterStyle(QCPScatterStyle(QCPScatterStyle::ssCircle, 5));	//设置图层散点样式
    //准备数据
    QVector<double> x(15), y(15);
    for (int j=0; j<15; ++j)
    {
      x[j] = j/15.0 * 5*3.14 + 0.01;
      y[j] = 7*qSin(x[j])/x[j] - (i-QCPGraph::lsNone)*5 + (QCPGraph::lsImpulse)*5 + 2;
    }
    //设置图层数据
    customPlot->graph()->setData(x, y);
    //设置图层坐标轴自适应
    customPlot->graph()->rescaleAxes(true);
  }
  //缩放坐标轴,scaleRange(double factor, double center)围绕center缩放factor倍
  customPlot->yAxis->scaleRange(1.1, customPlot->yAxis->range().center());
  customPlot->xAxis->scaleRange(1.1, customPlot->xAxis->range().center());
  //设置空白X轴线,带刻度和刻度标签的Y轴线
  customPlot->xAxis->setTicks(false);
  customPlot->yAxis->setTicks(true);
  customPlot->xAxis->setTickLabels(false);
  customPlot->yAxis->setTickLabels(true);
  //设置上测X轴和右测Y轴,克隆下测X轴和左测Y轴,使得坐标轴矩形看起来更漂亮
  customPlot->axisRect()->setupFullAxesBox();
}
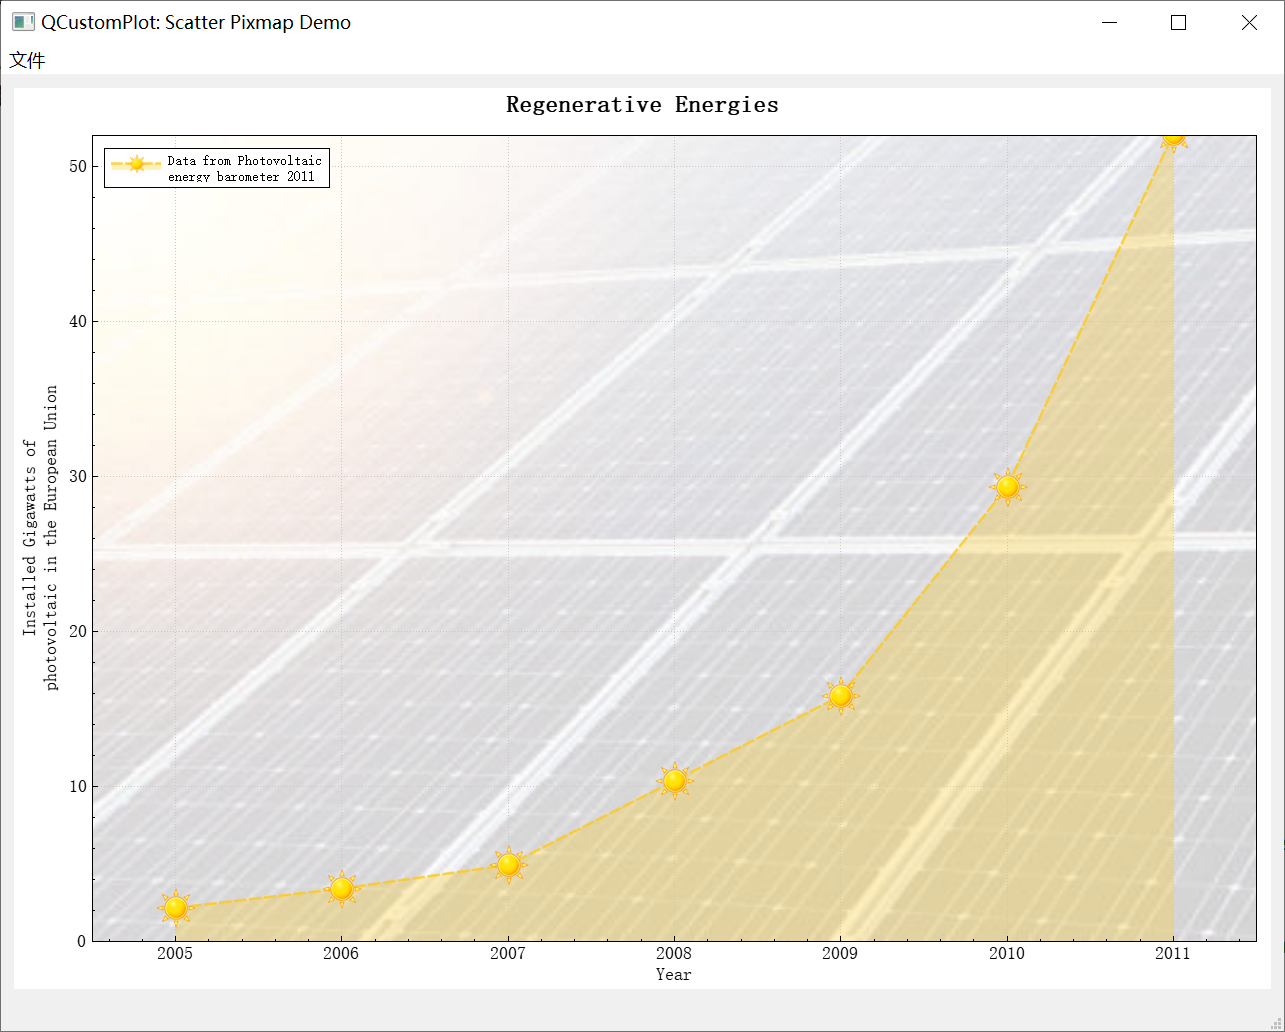
5、Scatter Pixmap Demo【图标散点demo】
void MainWindow::setupScatterPixmapDemo(QCustomPlot *customPlot)
{
  demoName = "Scatter Pixmap Demo";
  //设置图表背景为自定义图片
  customPlot->axisRect()->setBackground(QPixmap("://solarpanels.jpg"));
  //添加图层
  customPlot->addGraph();
  //设置图层曲线线型
  customPlot->graph()->setLineStyle(QCPGraph::lsLine);
  QPen pen;	//初始化画笔
  pen.setColor(QColor(255, 200, 20, 200));
  pen.setStyle(Qt::DashLine);
  pen.setWidthF(2.5);
  customPlot->graph()->setPen(pen);	//设置图层画笔
  customPlot->graph()->setBrush(QBrush(QColor(255,200,20,70)));	//设置图层画刷
  customPlot->graph()->setScatterStyle(QCPScatterStyle(QPixmap("://sun.png")));	//设置散点样式为自定义图片
  //设置图层曲线名称
  customPlot->graph()->setName("Data from Photovoltaic\nenergy barometer 2011");
  // 准备数据
  QVector<double> year, value;
  year  << 2005 << 2006 << 2007 << 2008  << 2009  << 2010 << 2011;
  value << 2.17 << 3.42 << 4.94 << 10.38 << 15.86 << 29.33 << 52.1;
  customPlot->graph()->setData(year, value);	//设置图层数据

  //设置图表标题
  customPlot->plotLayout()->insertRow(0);	//图表布局第0行插入
  //图表布局添加元素,在第0行、第0列,添加一个QCPTextElement元素,text为"Regenerative Energies",字体属性为QFont("sans", 12, QFont::Bold)
  customPlot->plotLayout()->addElement(0, 0, new QCPTextElement(customPlot, "Regenerative Energies", QFont("sans", 12, QFont::Bold)));
  //坐标轴配置
  //设置下侧X轴标签为Year,左侧Y轴标签为Installed Gigawatts of\nphotovoltaic in the European Union
  customPlot->xAxis->setLabel("Year");
  customPlot->yAxis->setLabel("Installed Gigawatts of\nphotovoltaic in the European Union");
  //设置上侧X轴、右侧Y轴可见
  customPlot->xAxis2->setVisible(true);
  customPlot->yAxis2->setVisible(true);
  //设置上侧X轴、右侧Y轴刻度标签不可见
  customPlot->xAxis2->setTickLabels(false);
  customPlot->yAxis2->setTickLabels(false);
  //设置上侧X轴、右侧Y轴刻度不可见
  customPlot->xAxis2->setTicks(false);
  customPlot->yAxis2->setTicks(false);
  //设置上侧X轴、右侧Y轴小刻度不可见
  customPlot->xAxis2->setSubTicks(false);
  customPlot->yAxis2->setSubTicks(false);
  //设置下侧X轴、左侧Y轴的坐标轴范围
  customPlot->xAxis->setRange(2004.5, 2011.5);
  customPlot->yAxis->setRange(0, 52);
  //配置图例
  customPlot->legend->setFont(QFont(font().family(), 7));	//设置图例字体
  customPlot->legend->setIconSize(50, 20);	//设置图例图标大小
  customPlot->legend->setVisible(true);	//设置图例可见
  //设置图例位置为左上方
  customPlot->axisRect()->insetLayout()->setInsetAlignment(0, Qt::AlignLeft | Qt::AlignTop);
}
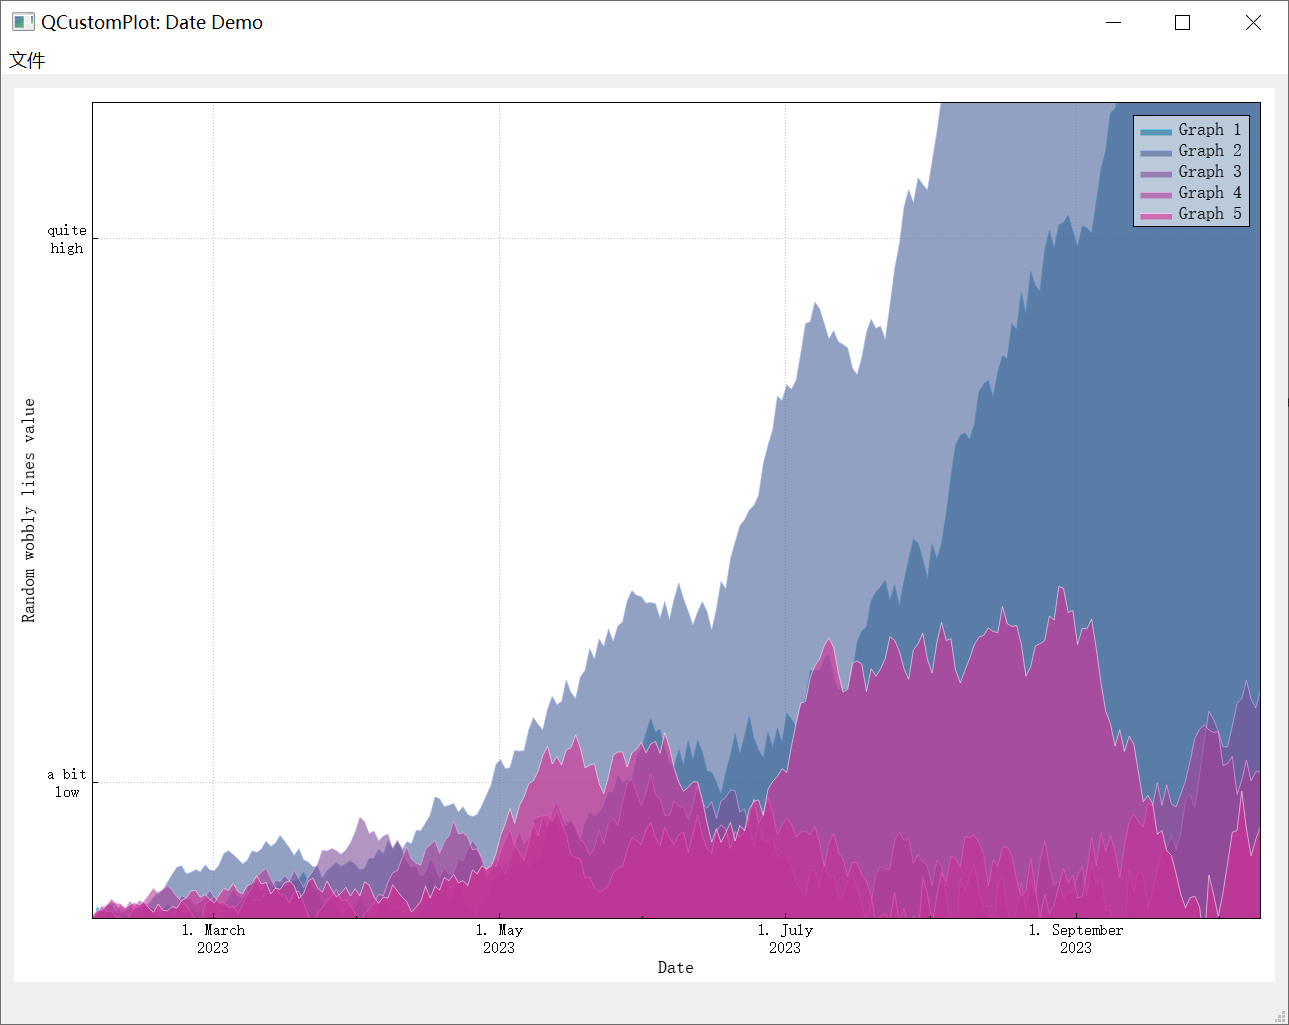
6、Date Demo【日期demo】
void MainWindow::setupDateDemo(QCustomPlot *customPlot)
{
  demoName = "Date Demo";
  //设置locale为English,因此我们得到英文月份名称
  customPlot->setLocale(QLocale(QLocale::English, QLocale::UnitedKingdom));
  //当前时间的秒数,我们将它作为数据的起始时间点
  double now = QDateTime::currentDateTime().toMSecsSinceEpoch()/1000.0;
  srand(8); //设置随机数种子,所以我们得到的一直是相同的随机数据
  //创建多曲线图表
  for (int gi=0; gi<5; ++gi)
  {
  	//添加图层
    customPlot->addGraph();
    QColor color(20+200/4.0*gi,70*(1.6-gi/4.0), 150, 150);
    customPlot->graph()->setLineStyle(QCPGraph::lsLine);	//设置图层线型
    customPlot->graph()->setPen(QPen(color.lighter(200)));	//设置图形画笔
    customPlot->graph()->setBrush(QBrush(color));			//设置图层画刷
    //准备数据
    QVector<QCPGraphData> timeData(250);
    for (int i=0; i<250; ++i)
    {
      timeData[i].key = now + 24*3600*i;
      if (i == 0)
        timeData[i].value = (i/50.0+1)*(rand()/(double)RAND_MAX-0.5);
      else
        timeData[i].value = qFabs(timeData[i-1].value)*(1+0.02/4.0*(4-gi)) + (i/50.0+1)*(rand()/(double)RAND_MAX-0.5);
    }
    //设置图层数据
    customPlot->graph()->data()->set(timeData);
  }
  //配置下侧X轴显示日期,而不是数字
  QSharedPointer<QCPAxisTickerDateTime> dateTicker(new QCPAxisTickerDateTime);
  dateTicker->setDateTimeFormat("d. MMMM\nyyyy");	//设置日期格式
  customPlot->xAxis->setTicker(dateTicker);	//设置下侧X轴为日期刻度
  //配置左侧Y轴的刻度标签
  QSharedPointer<QCPAxisTickerText> textTicker(new QCPAxisTickerText);
  textTicker->addTick(10, "a bit\nlow");	//刻度值为10时显示a bit\nlow;
  textTicker->addTick(50, "quite\nhigh");	//刻度值为50时显示quite\nhigh;
  customPlot->yAxis->setTicker(textTicker);	//设置左侧Y轴为标签刻度
  //给下侧X轴和左侧Y轴刻度标签设置更紧凑的字体大小
  customPlot->xAxis->setTickLabelFont(QFont(QFont().family(), 8));
  customPlot->yAxis->setTickLabelFont(QFont(QFont().family(), 8));
  //设置坐标轴标签
  customPlot->xAxis->setLabel("Date");
  customPlot->yAxis->setLabel("Random wobbly lines value");
  //设置上侧X轴和右侧Y轴可见,但是刻度和刻度标签不可见
  customPlot->xAxis2->setVisible(true);
  customPlot->yAxis2->setVisible(true);
  customPlot->xAxis2->setTicks(false);
  customPlot->yAxis2->setTicks(false);
  customPlot->xAxis2->setTickLabels(false);
  customPlot->yAxis2->setTickLabels(false);
  //设置下侧X轴和左侧Y轴坐标轴范围
  customPlot->xAxis->setRange(now, now+24*3600*249);
  customPlot->yAxis->setRange(0, 60);
  //设置图例可见和图例背景色
  customPlot->legend->setVisible(true);
  customPlot->legend->setBrush(QColor(255, 255, 255, 150));
}
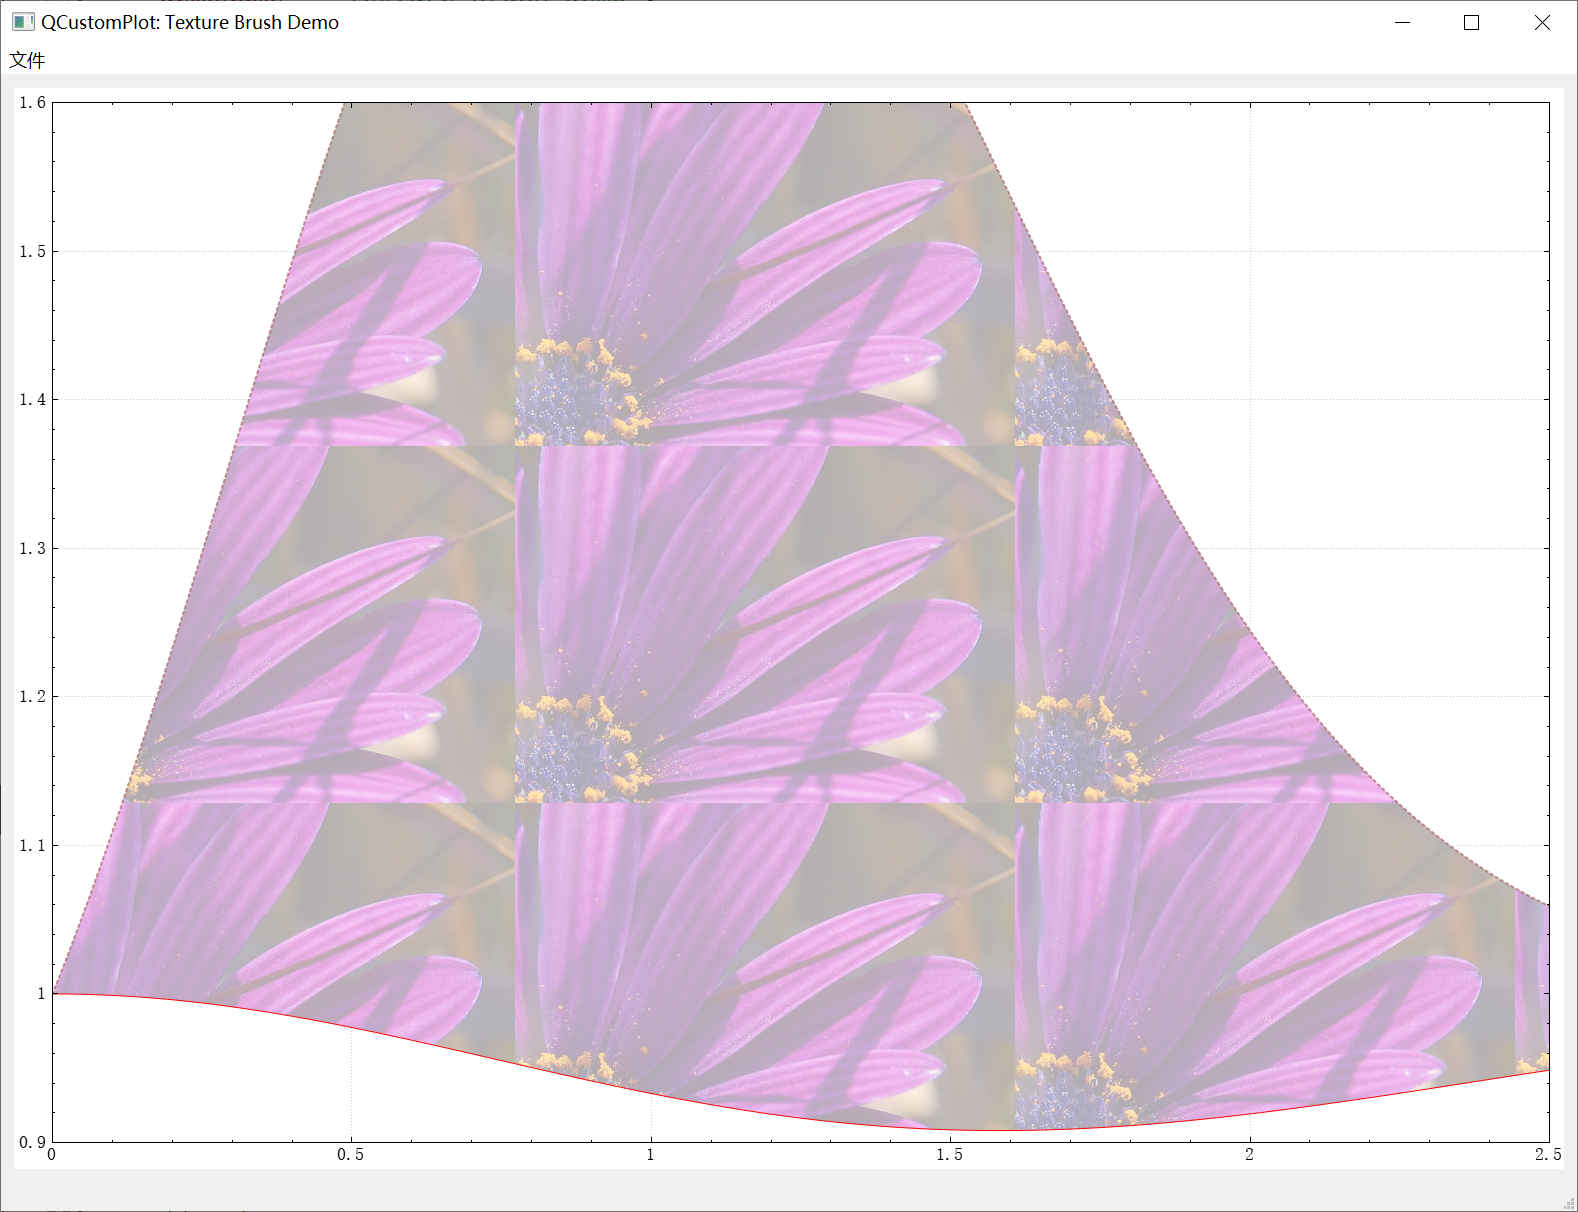
7、Texture Brush Demo【纹理画刷demo】
void MainWindow::setupTextureBrushDemo(QCustomPlot *customPlot)
{
  demoName = "Texture Brush Demo";
  //添加图层
  customPlot->addGraph();
  QPen redDotPen;	//初始化画笔
  redDotPen.setStyle(Qt::DotLine);
  redDotPen.setColor(QColor(170, 100, 100, 180));
  redDotPen.setWidthF(2);
  customPlot->graph(0)->setPen(redDotPen);	//设置图层画笔
  customPlot->graph(0)->setBrush(QBrush(QPixmap("://balboa.jpg"))); //设置图层画刷为自定义图像

  //添加图层
  customPlot->addGraph();
  customPlot->graph(1)->setPen(QPen(Qt::red));	//设置图层画笔

  //设置填充graph(0)和graph(1)之间的区域
  customPlot->graph(0)->setChannelFillGraph(customPlot->graph(1));

  //准备数据
  QVector<double> x(250);
  QVector<double> y0(250), y1(250);
  for (int i=0; i<250; ++i)
  {
    // just playing with numbers, not much to learn here
    x[i] = 3*i/250.0;
    y0[i] = 1+qExp(-x[i]*x[i]*0.8)*(x[i]*x[i]+x[i]);
    y1[i] = 1-qExp(-x[i]*x[i]*0.4)*(x[i]*x[i])*0.1;
  }

  //设置图层数据
  customPlot->graph(0)->setData(x, y0);
  customPlot->graph(1)->setData(x, y1);
  //激活上侧X轴和右侧Y轴,上侧X轴和右侧Y轴默认是禁用的
  customPlot->xAxis2->setVisible(true);
  customPlot->yAxis2->setVisible(true);
  //隐藏上侧X轴和右侧Y轴的刻度标签
  customPlot->xAxis2->setTickLabels(false);
  customPlot->yAxis2->setTickLabels(false);
  //设置下侧X轴和左侧Y轴坐标轴范围
  customPlot->xAxis->setRange(0, 2.5);
  customPlot->yAxis->setRange(0.9, 1.6);
  //设置上测X轴和右测Y轴,克隆下测X轴和左测Y轴,使得坐标轴矩形看起来更漂亮
  customPlot->axisRect()->setupFullAxesBox();
}
8、Multi Axis Demo【多坐标轴demo】
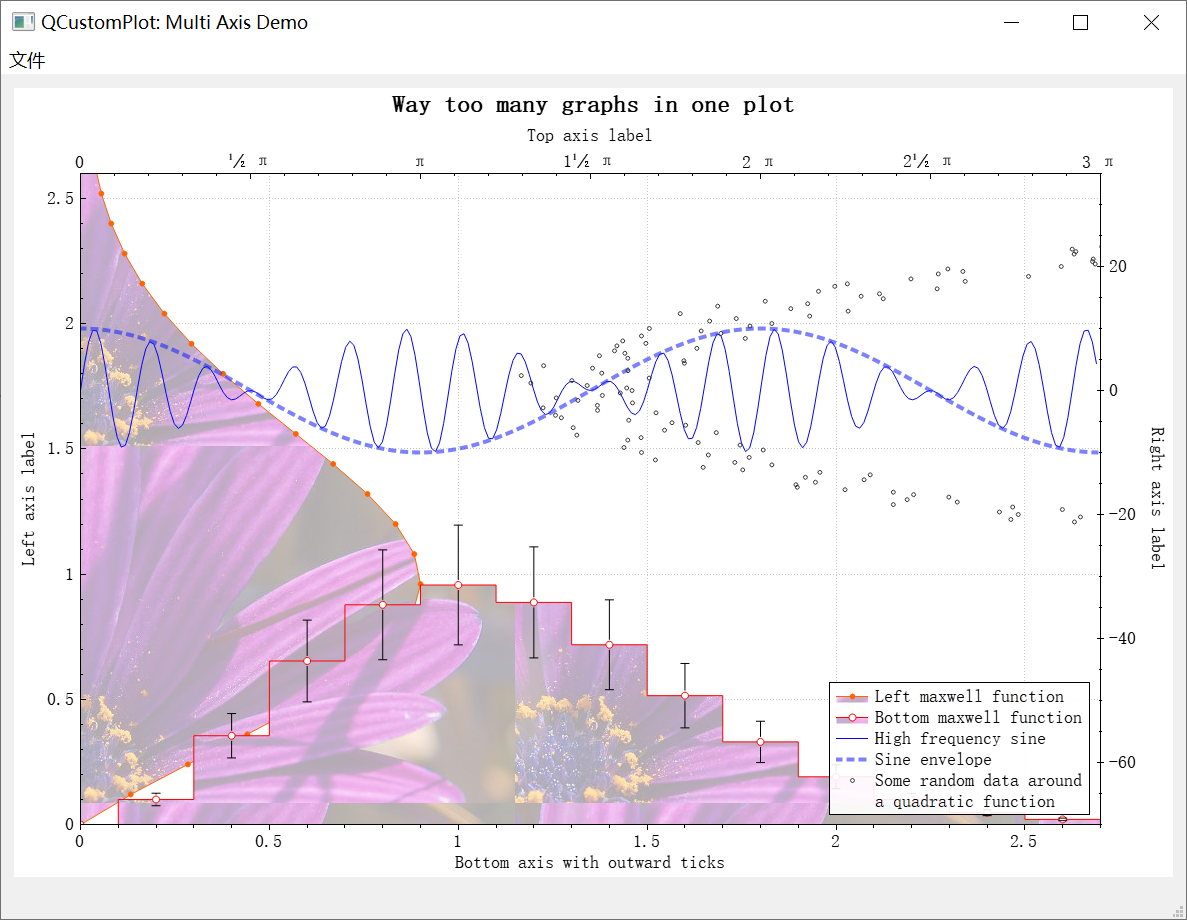
void MainWindow::setupMultiAxisDemo(QCustomPlot *customPlot)
{
  //设置画布可以鼠标拖动、鼠标滚轮缩放
  customPlot->setInteractions(QCP::iRangeDrag | QCP::iRangeZoom);
  demoName = "Multi Axis Demo";

  //设置Locale为English
  customPlot->setLocale(QLocale(QLocale::English, QLocale::UnitedKingdom)); // period as decimal separator and comma as thousand separator
  //设置图例可见
  customPlot->legend->setVisible(true);
  QFont legendFont = font();  //使用MainWindow的font..
  legendFont.setPointSize(9); //设置图例的大小
  customPlot->legend->setFont(legendFont);	//设置图例字体
  customPlot->legend->setBrush(QBrush(QColor(255,255,255,230)));	//设置图例背景画刷
  //修改图例位置
  customPlot->axisRect()->insetLayout()->setInsetAlignment(0, Qt::AlignBottom|Qt::AlignRight);

  //添加图层
  //默认下侧X轴为键轴,左侧Y轴为值轴;配置图层graph(0): 下侧X轴为值轴,左侧Y轴为键轴
  customPlot->addGraph(customPlot->yAxis, customPlot->xAxis);
  customPlot->graph(0)->setPen(QPen(QColor(255, 100, 0)));	//设置图层画笔
  customPlot->graph(0)->setBrush(QBrush(QPixmap("://balboa.jpg"))); //设置图层自定义图像画刷
  customPlot->graph(0)->setLineStyle(QCPGraph::lsLine);	//设置图层曲线线型
  customPlot->graph(0)->setScatterStyle(QCPScatterStyle(QCPScatterStyle::ssDisc, 5));	//设置图层散点样式
  customPlot->graph(0)->setName("Left maxwell function");	//设置图层曲线名称

  //添加图层
  customPlot->addGraph();
  customPlot->graph(1)->setPen(QPen(Qt::red));	//设置图层画笔
  customPlot->graph(1)->setBrush(QBrush(QPixmap("://balboa.jpg"))); //设置图层自定义图像画刷
  customPlot->graph(1)->setLineStyle(QCPGraph::lsStepCenter);	//设置图层曲线线型
  customPlot->graph(1)->setScatterStyle(QCPScatterStyle(QCPScatterStyle::ssCircle, Qt::red, Qt::white, 7));	//设置图层散点样式
  customPlot->graph(1)->setName("Bottom maxwell function");	//设置图层曲线名称
  QCPErrorBars *errorBars = new QCPErrorBars(customPlot->xAxis, customPlot->yAxis);
  errorBars->removeFromLegend();	//从图例中移除
  errorBars->setDataPlottable(customPlot->graph(1));	//误差线绑定图层graph(1)

  //添加图层
  //绑定坐标轴,上侧X轴为键轴,右侧Y轴为值轴
  customPlot->addGraph(customPlot->xAxis2, customPlot->yAxis2);
  customPlot->graph(2)->setPen(QPen(Qt::blue));		//设置图层画笔
  customPlot->graph(2)->setName("High frequency sine");	//设置图层曲线名称

  //添加图层
  //绑定坐标轴,上侧X轴为键轴,右侧Y轴为值轴,和graph(2)一样
  customPlot->addGraph(customPlot->xAxis2, customPlot->yAxis2);
  QPen blueDotPen;	//初始化画笔
  blueDotPen.setColor(QColor(30, 40, 255, 150));
  blueDotPen.setStyle(Qt::DotLine);
  blueDotPen.setWidthF(4);
  customPlot->graph(3)->setPen(blueDotPen);		//设置图层画笔
  customPlot->graph(3)->setName("Sine envelope");	//设置图层曲线名称

  //添加图层
  //绑定坐标轴,右侧Y轴为键轴,上侧X轴为值轴
  customPlot->addGraph(customPlot->yAxis2, customPlot->xAxis2);
  customPlot->graph(4)->setPen(QColor(50, 50, 50, 255));	//设置图层画笔
  customPlot->graph(4)->setLineStyle(QCPGraph::lsNone);	//设置图层线型
  customPlot->graph(4)->setScatterStyle(QCPScatterStyle(QCPScatterStyle::ssCircle, 4));	//设置图层散点样式
  customPlot->graph(4)->setName("Some random data around\na quadratic function");	//设置图层曲线名称

  //准备数据
  QVector<double> x0(25), y0(25);
  QVector<double> x1(15), y1(15), y1err(15);
  QVector<double> x2(250), y2(250);
  QVector<double> x3(250), y3(250);
  QVector<double> x4(250), y4(250);
  for (int i=0; i<25; ++i) // data for graph 0
  {
    x0[i] = 3*i/25.0;
    y0[i] = qExp(-x0[i]*x0[i]*0.8)*(x0[i]*x0[i]+x0[i]);
  }
  for (int i=0; i<15; ++i) // data for graph 1
  {
    x1[i] = 3*i/15.0;;
    y1[i] = qExp(-x1[i]*x1[i])*(x1[i]*x1[i])*2.6;
    y1err[i] = y1[i]*0.25;
  }
  for (int i=0; i<250; ++i) // data for graphs 2, 3 and 4
  {
    x2[i] = i/250.0*3*M_PI;
    x3[i] = x2[i];
    x4[i] = i/250.0*100-50;
    y2[i] = qSin(x2[i]*12)*qCos(x2[i])*10;
    y3[i] = qCos(x3[i])*10;
    y4[i] = 0.01*x4[i]*x4[i] + 1.5*(rand()/(double)RAND_MAX-0.5) + 1.5*M_PI;
  }

  //设置数据到各图层
  customPlot->graph(0)->setData(x0, y0);
  customPlot->graph(1)->setData(x1, y1);
  errorBars->setData(y1err);
  customPlot->graph(2)->setData(x2, y2);
  customPlot->graph(3)->setData(x3, y3);
  customPlot->graph(4)->setData(x4, y4);
  //激活上侧X轴和右侧Y轴,上侧X轴和右侧Y轴默认是禁用的
  customPlot->xAxis2->setVisible(true);
  customPlot->yAxis2->setVisible(true);
  //设置各个坐标轴的范围
  customPlot->xAxis->setRange(0, 2.7);
  customPlot->yAxis->setRange(0, 2.6);
  customPlot->xAxis2->setRange(0, 3.0*M_PI);
  customPlot->yAxis2->setRange(-70, 35);
  //上侧X轴设置π刻度
  customPlot->xAxis2->setTicker(QSharedPointer<QCPAxisTickerPi>(new QCPAxisTickerPi));
  //添加图表标题
  customPlot->plotLayout()->insertRow(0);
  customPlot->plotLayout()->addElement(0, 0, new QCPTextElement(customPlot, "Way too many graphs in one plot", QFont("sans", 12, QFont::Bold)));
  //设置各坐标轴标签
  customPlot->xAxis->setLabel("Bottom axis with outward ticks");
  customPlot->yAxis->setLabel("Left axis label");
  customPlot->xAxis2->setLabel("Top axis label");
  customPlot->yAxis2->setLabel("Right axis label");
  //设置下侧X轴刻度线,大刻度线向内为0、向外为5,小刻度线向内为0、向外为3
  customPlot->xAxis->setTickLength(0, 5);
  customPlot->xAxis->setSubTickLength(0, 3);
  //设置右侧Y轴刻度线,大刻度线向内为3、向外为3,小刻度线向内为1、向外为1
  customPlot->yAxis2->setTickLength(3, 3);
  customPlot->yAxis2->setSubTickLength(1, 1);
}
9、Logarithmic Demo【对数demo】
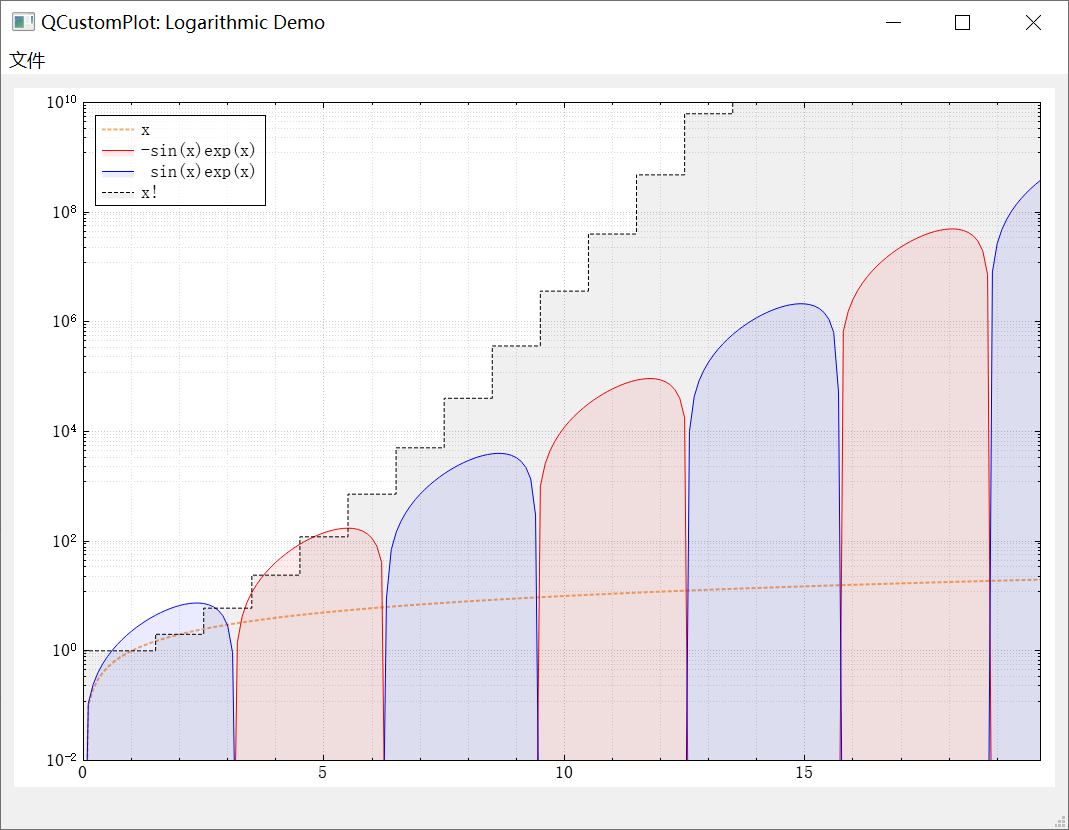
void MainWindow::setupLogarithmicDemo(QCustomPlot *customPlot)
{
  demoName = "Logarithmic Demo";
  //设置用户拖动轴时是否禁用此QCustomPlot的反走样
  //如果许多对象,特别是绘图对象,都是反锯齿绘制的,这将大大改善拖动期间的性能。因此,它创造了一个更灵敏的用户体验。一旦用户停止拖拽,最后重绘正常抗走样,恢复高图像质量。
  customPlot->setNoAntialiasingOnDrag(true);

  //添加图层
  customPlot->addGraph();
  QPen pen;	//初始化画笔
  pen.setColor(QColor(255,170,100));
  pen.setWidth(2);
  pen.setStyle(Qt::DotLine);
  customPlot->graph(0)->setPen(pen);	//设置图层画笔
  customPlot->graph(0)->setName("x");	//设置图层曲线名称

  //添加图层
  customPlot->addGraph();
  customPlot->graph(1)->setPen(QPen(Qt::red));	//设置图层画笔
  customPlot->graph(1)->setBrush(QBrush(QColor(255, 0, 0, 20)));	//设置图层画刷
  customPlot->graph(1)->setName("-sin(x)exp(x)");	//设置图层曲线名称

  //添加图层
  customPlot->addGraph();
  customPlot->graph(2)->setPen(QPen(Qt::blue));	//设置图层画笔
  customPlot->graph(2)->setBrush(QBrush(QColor(0, 0, 255, 20)));	//设置图层画刷
  customPlot->graph(2)->setName(" sin(x)exp(x)");	//设置图层曲线名称

  //添加图层
  customPlot->addGraph();
  pen.setColor(QColor(0,0,0));	//初始化画笔
  pen.setWidth(1);
  pen.setStyle(Qt::DashLine);
  customPlot->graph(3)->setPen(pen);	//设置图层画笔
  customPlot->graph(3)->setBrush(QBrush(QColor(0,0,0,15)));	//设置图层画刷
  customPlot->graph(3)->setLineStyle(QCPGraph::lsStepCenter);	//设置图层曲线线型
  customPlot->graph(3)->setName("x!");	//设置图层曲线名称

  //准备数据
  const int dataCount = 200;
  const int dataFactorialCount = 21;
  QVector<QCPGraphData> dataLinear(dataCount), dataMinusSinExp(dataCount), dataPlusSinExp(dataCount), dataFactorial(dataFactorialCount);
  for (int i=0; i<dataCount; ++i)
  {
    dataLinear[i].key = i/10.0;
    dataLinear[i].value = dataLinear[i].key;
    dataMinusSinExp[i].key = i/10.0;
    dataMinusSinExp[i].value = -qSin(dataMinusSinExp[i].key)*qExp(dataMinusSinExp[i].key);
    dataPlusSinExp[i].key = i/10.0;
    dataPlusSinExp[i].value = qSin(dataPlusSinExp[i].key)*qExp(dataPlusSinExp[i].key);
  }
  for (int i=0; i<dataFactorialCount; ++i)
  {
    dataFactorial[i].key = i;
    dataFactorial[i].value = 1.0;
    for (int k=1; k<=i; ++k) dataFactorial[i].value *= k; // factorial
  }
  //设置数据到各图层
  customPlot->graph(0)->data()->set(dataLinear);
  customPlot->graph(1)->data()->set(dataMinusSinExp);
  customPlot->graph(2)->data()->set(dataPlusSinExp);
  customPlot->graph(3)->data()->set(dataFactorial);

  //设置坐标轴小刻度网格线可见
  customPlot->yAxis->grid()->setSubGridVisible(true);
  customPlot->xAxis->grid()->setSubGridVisible(true);
  //设置左侧Y轴和右侧Y轴比例尺为对数比例尺
  customPlot->yAxis->setScaleType(QCPAxis::stLogarithmic);
  customPlot->yAxis2->setScaleType(QCPAxis::stLogarithmic);
  //设置左侧Y轴和右侧Y轴刻度为对数刻度
  QSharedPointer<QCPAxisTickerLog> logTicker(new QCPAxisTickerLog);
  customPlot->yAxis->setTicker(logTicker);
  customPlot->yAxis2->setTicker(logTicker);
  //设置左侧Y轴数字格式和精度
  customPlot->yAxis->setNumberFormat("eb"); // e = exponential, b = beautiful decimal powers
  customPlot->yAxis->setNumberPrecision(0); // makes sure "1*10^4" is displayed only as "10^4"
  设置下侧X轴和左侧Y轴坐标轴范围
  customPlot->xAxis->setRange(0, 19.9);
  customPlot->yAxis->setRange(1e-2, 1e10);
  //设置可以鼠标拖动画布、鼠标滚轮画布缩放
  customPlot->setInteractions(QCP::iRangeDrag | QCP::iRangeZoom);

  //设置上测X轴和右测Y轴,克隆下测X轴和左测Y轴,使得坐标轴矩形看起来更漂亮
  customPlot->axisRect()->setupFullAxesBox();
  //连接信号,使上、右轴与下、左轴同步移动
  connect(customPlot->xAxis, SIGNAL(rangeChanged(QCPRange)), customPlot->xAxis2, SLOT(setRange(QCPRange)));
  connect(customPlot->yAxis, SIGNAL(rangeChanged(QCPRange)), customPlot->yAxis2, SLOT(setRange(QCPRange)));

  //设置图例可见和图例背景画刷
  customPlot->legend->setVisible(true);
  customPlot->legend->setBrush(QBrush(QColor(255,255,255,150)));
  //修改图例位置
  customPlot->axisRect()->insetLayout()->setInsetAlignment(0, Qt::AlignLeft|Qt::AlignTop); // make legend align in top left corner or axis rect
}
10、Real Time Data Demo【实时数据demo】

未完待续…