一. Docker部署Prometheus
1.1 下载prom/prometheus镜像
docker pull prom/prometheus1.2 启动prometheus容器
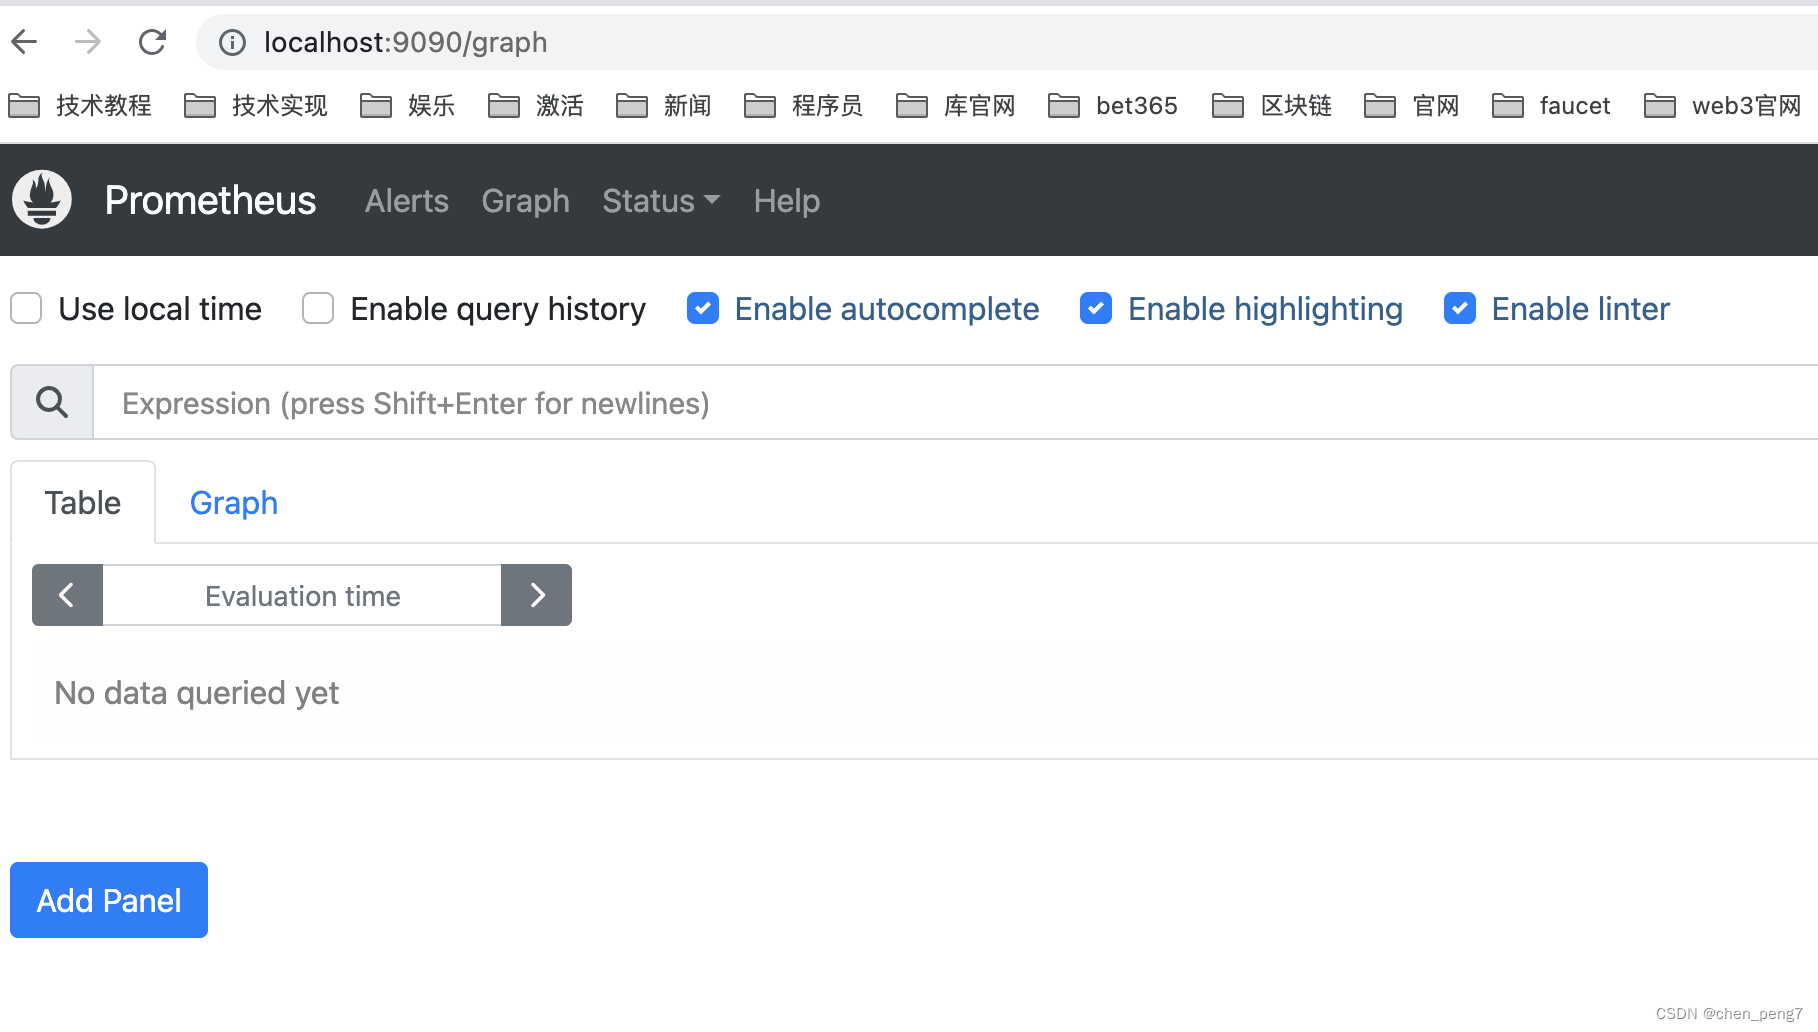
docker run -itd --name=prometheus -p 9090:9090 prom/prometheus打开本地http://localhost:9090/ 说明启动成功
1.3 将容器的配置文件复制出来
docker cp prometheus:/etc/prometheus/prometheus.yml /Users/chenpeng/share/prometheus/config1.4 删除老容器并重建挂载配置文件的容器
docker rm prometheus
docker run -itd --name=prometheus -v /Users/chenpeng/share/prometheus/config/prometheus.yml:/etc/prometheus/prometheus.yml -p 9090:9090 prom/prometheus
二. Docker部署Grafana
2.1 下载grafana/grafana镜像
docker pull grafana/grafana2.2 启动grafana容器
docker run -itd --name=grafana -p 3000:3000 grafana/grafana打开网页localhost:3000,初始用户密码都是admin,第一次登陆修改密码为123456

三. go代码添加监控示例
3.1 获取prometheus库
go get -u github.com/prometheus/client_golang/prometheus3.2 go示例代码
package main

import (
	"fmt"
	"github.com/gin-gonic/gin"
	"github.com/prometheus/client_golang/prometheus"
	"github.com/prometheus/client_golang/prometheus/promhttp"
	"math/rand"
	"net/http"
	"strconv"
	"time"
)

var (
	// 随机数
	ran = rand.New(rand.NewSource(time.Now().UnixMilli()))
	// 请求处理时间指标
	httpRequestDurationVec *prometheus.HistogramVec
	// 请求个数指标
	httpRequestCountVec *prometheus.CounterVec
	// DefaultBuckets prometheus buckets in seconds.
	DefaultBuckets = []float64{0.1, 0.3, 0.5, 1.0, 3.0, 5.0}
)

func main() {
	router := gin.Default()
	router.Use(Middleware)

	router.GET("/metrics", Metrics())

	apiGroup := router.Group("/api")
	{
		apiGroup.GET("/A", CommonControl)
		apiGroup.GET("/B", CommonControl)
		apiGroup.GET("/C", CommonControl)
		apiGroup.GET("/D", CommonControl)
		apiGroup.GET("/E", CommonControl)
	}

	_ = router.Run(":60000")
}

// 初始化prometheus
func init() {
	httpRequestDurationVec = prometheus.NewHistogramVec(prometheus.HistogramOpts{
		Name:    "http_server_requests_seconds",
		Help:    "How long it took to process the HTTP request, partitioned by status code, method and HTTP path.",
		Buckets: DefaultBuckets,
	}, []string{"code", "method", "uri"})

	httpRequestCountVec = prometheus.NewCounterVec(prometheus.CounterOpts{
		Name: "http_server_requests_count",
		Help: "How long it took to process the HTTP request, partitioned by status code, method and HTTP path.",
	}, []string{"code", "method"})

	prometheus.MustRegister(httpRequestDurationVec, httpRequestCountVec)
}

// 统一处理函数
func CommonControl(ctx *gin.Context) {
	time.Sleep(time.Duration(ran.Intn(100)) * time.Millisecond)

	ctx.JSON(http.StatusOK, gin.H{
		"message": "success",
	})
}

// 中间件记录请求指标
func Middleware(ctx *gin.Context) {
	start := time.Now()
	ctx.Next()

	// 返回状态码
	statusCode := strconv.Itoa(ctx.Writer.Status())
	// 标签
	labels := []string{statusCode, ctx.Request.Method, ctx.Request.URL.Path}
	// 请求处理时间
	duration := float64(time.Since(start).Nanoseconds()) / 1000000000

	// 添加指标
	httpRequestDurationVec.WithLabelValues(labels...).Observe(duration)
	httpRequestCountVec.WithLabelValues(statusCode, ctx.Request.Method).Inc()
	fmt.Printf("code: %d | method: %s | path: %s | duration: %f\n ", statusCode, ctx.Request.Method, ctx.Request.URL.Path, duration)
}

// http metrics 指标页面,配置给prometheus
func Metrics() gin.HandlerFunc {
	h := promhttp.Handler()

	return func(c *gin.Context) {
		h.ServeHTTP(c.Writer, c.Request)
	}
}
3.3 访问metrics页面
http://localhost:60000/metrics

3.4 修改prometheus配置文件
修改刚刚docker挂载的配置文件,我这里的路径是/Users/chenpeng/share/prometheus/config/prometheus.yml
# A scrape configuration containing exactly one endpoint to scrape:
# Here it's Prometheus itself.
scrape_configs:
  # The job name is added as a label `job=<job_name>` to any timeseries scraped from this config.
  - job_name: "prometheus"

    # metrics_path defaults to '/metrics'
    # scheme defaults to 'http'.

    static_configs:
      - targets: ["localhost:9090"]

  - job_name: "gopractice"

    static_configs:
      - targets: ["192.168.50.43:60000"] #这里要填本地ip,容器里localhost访问不到
重启prometheus docker容器
docker restart prometheus访问 http://localhost:9090/targets?search=

可以看到prometheus已经收录了项目的metrics
3.5 配置grafana
进入grafana选datasource
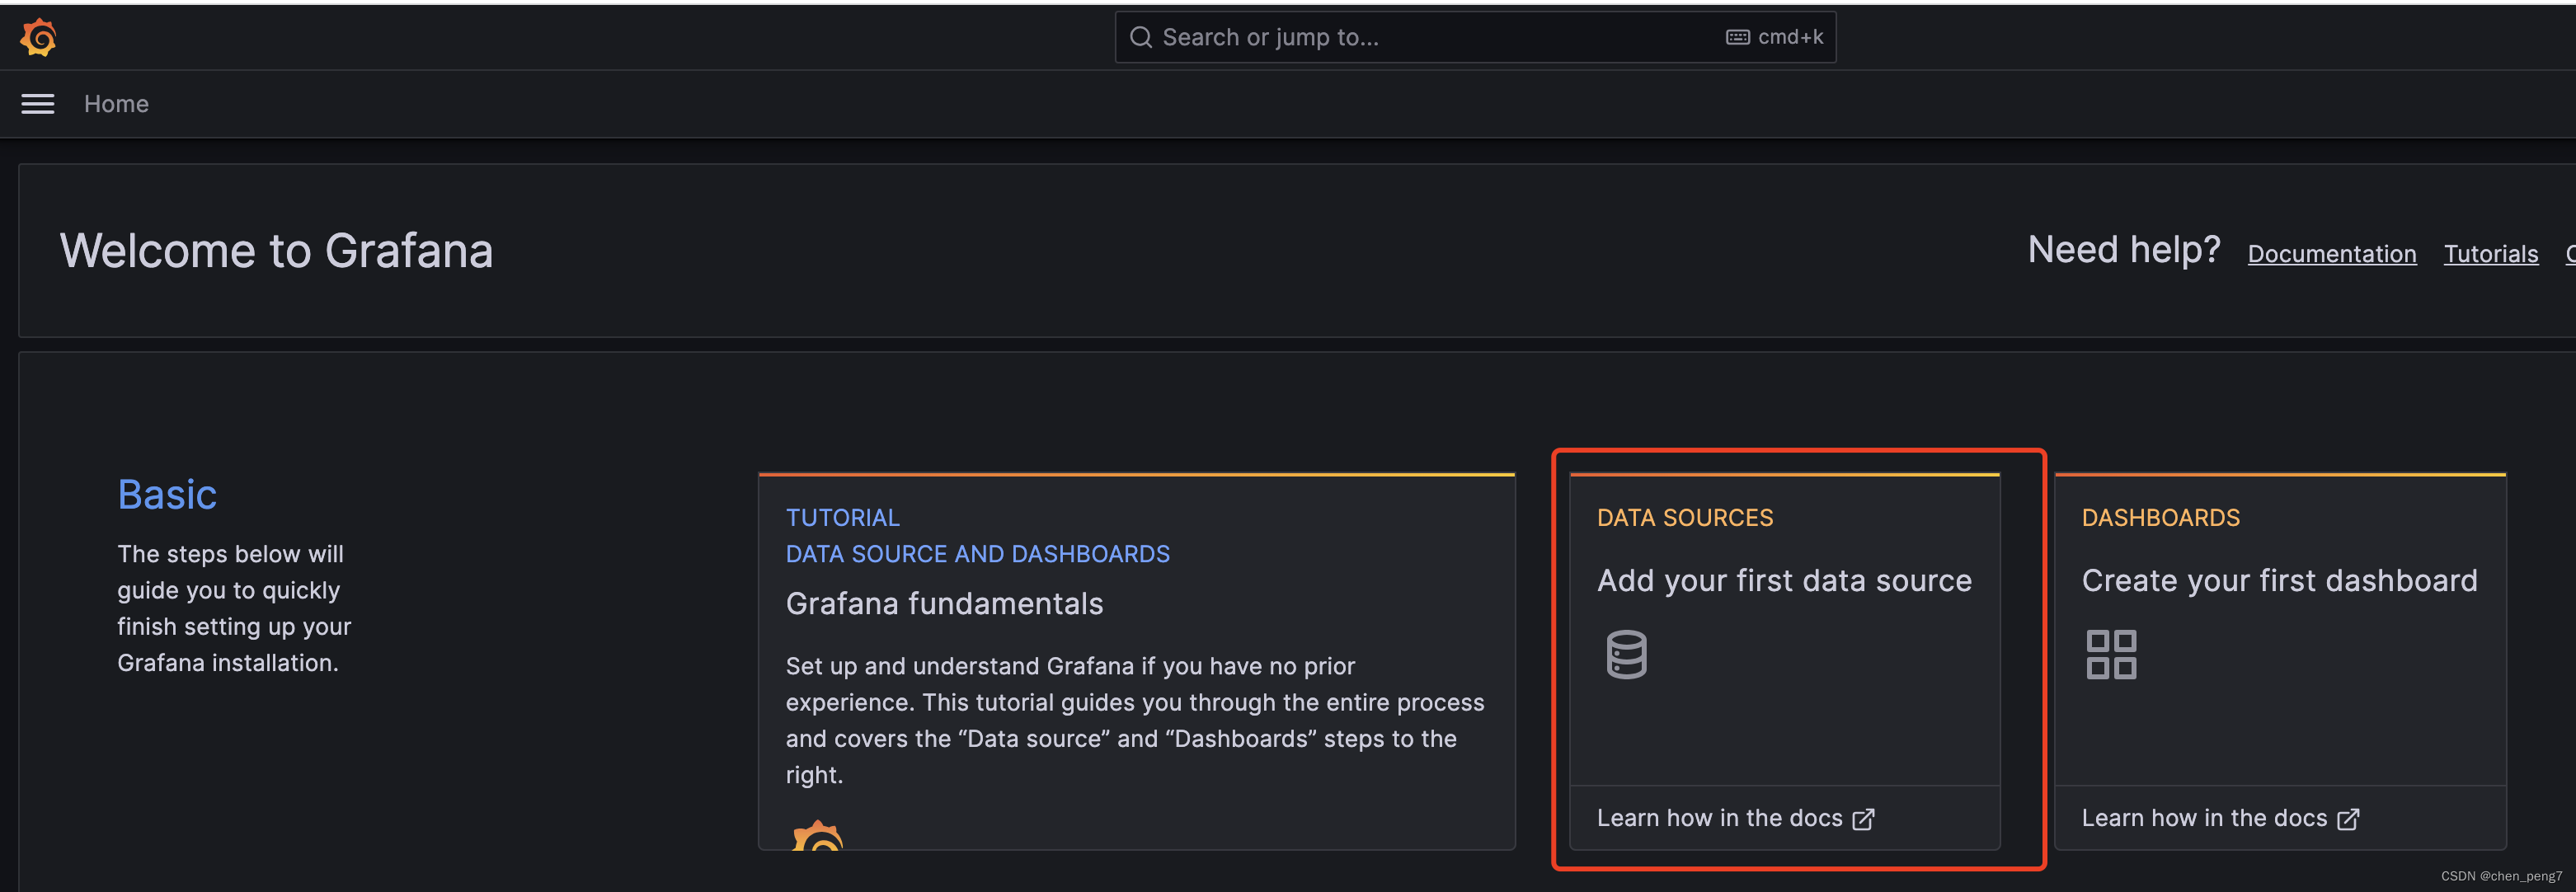
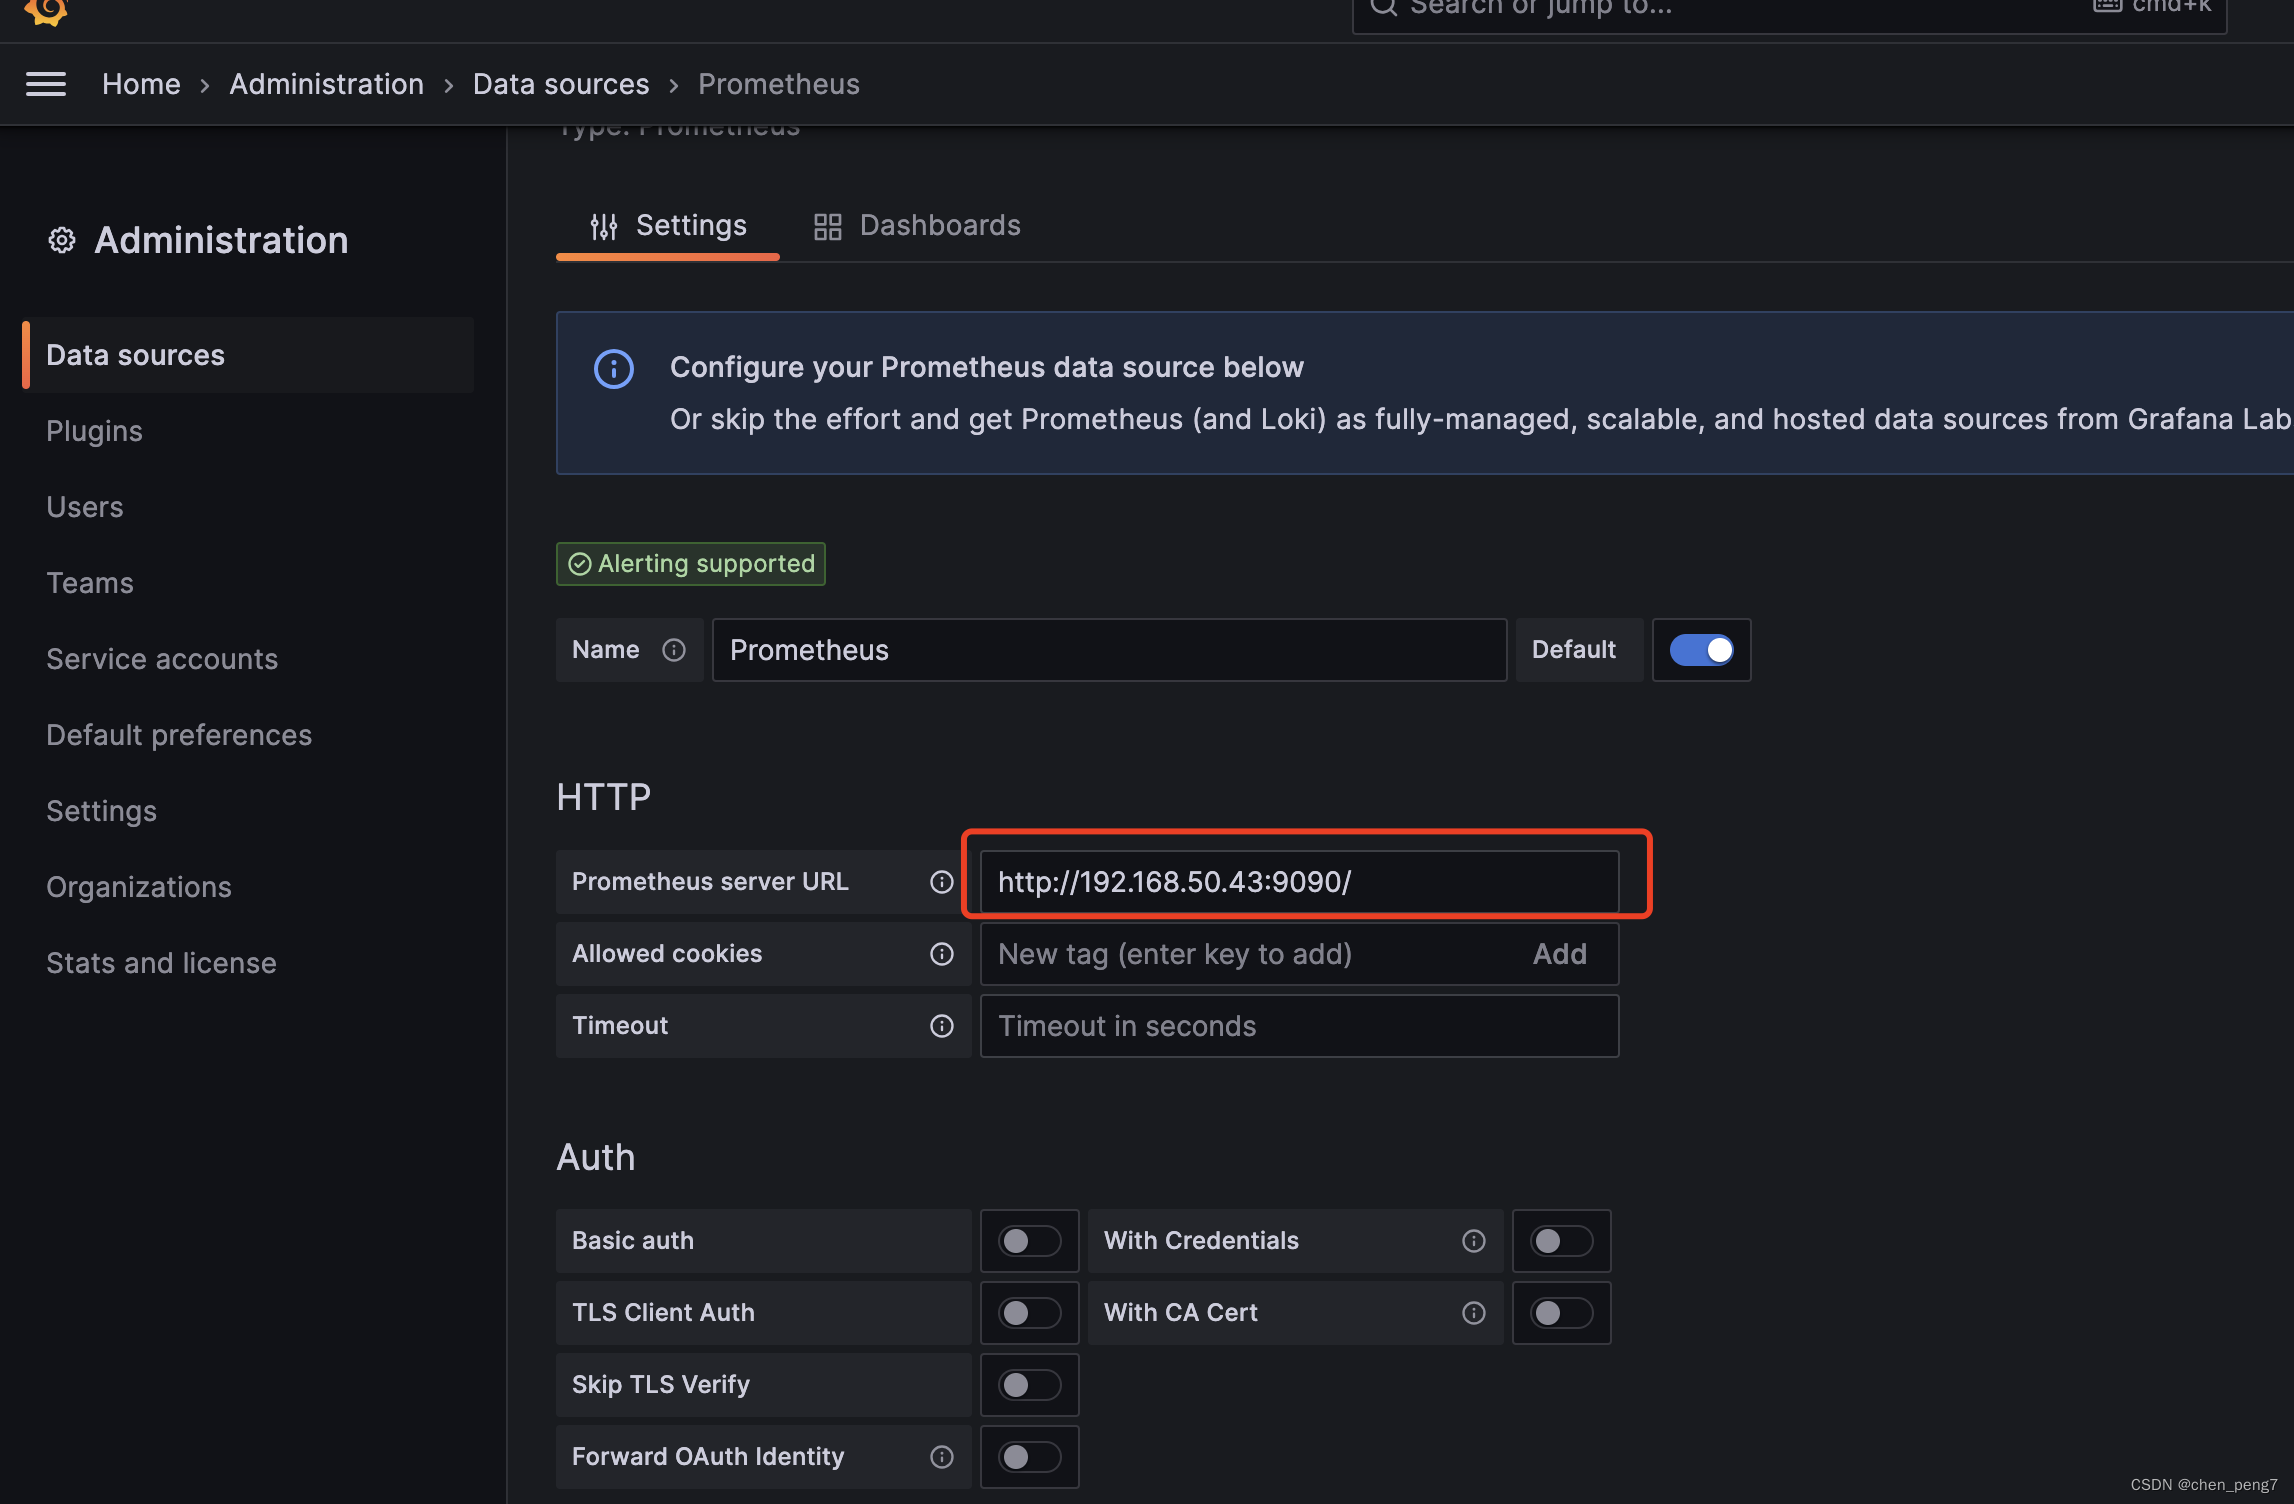
进入DATA SOURCES选prometheus

配置prometheus地址,同样要使用本机内网ip地址 ,点save&test
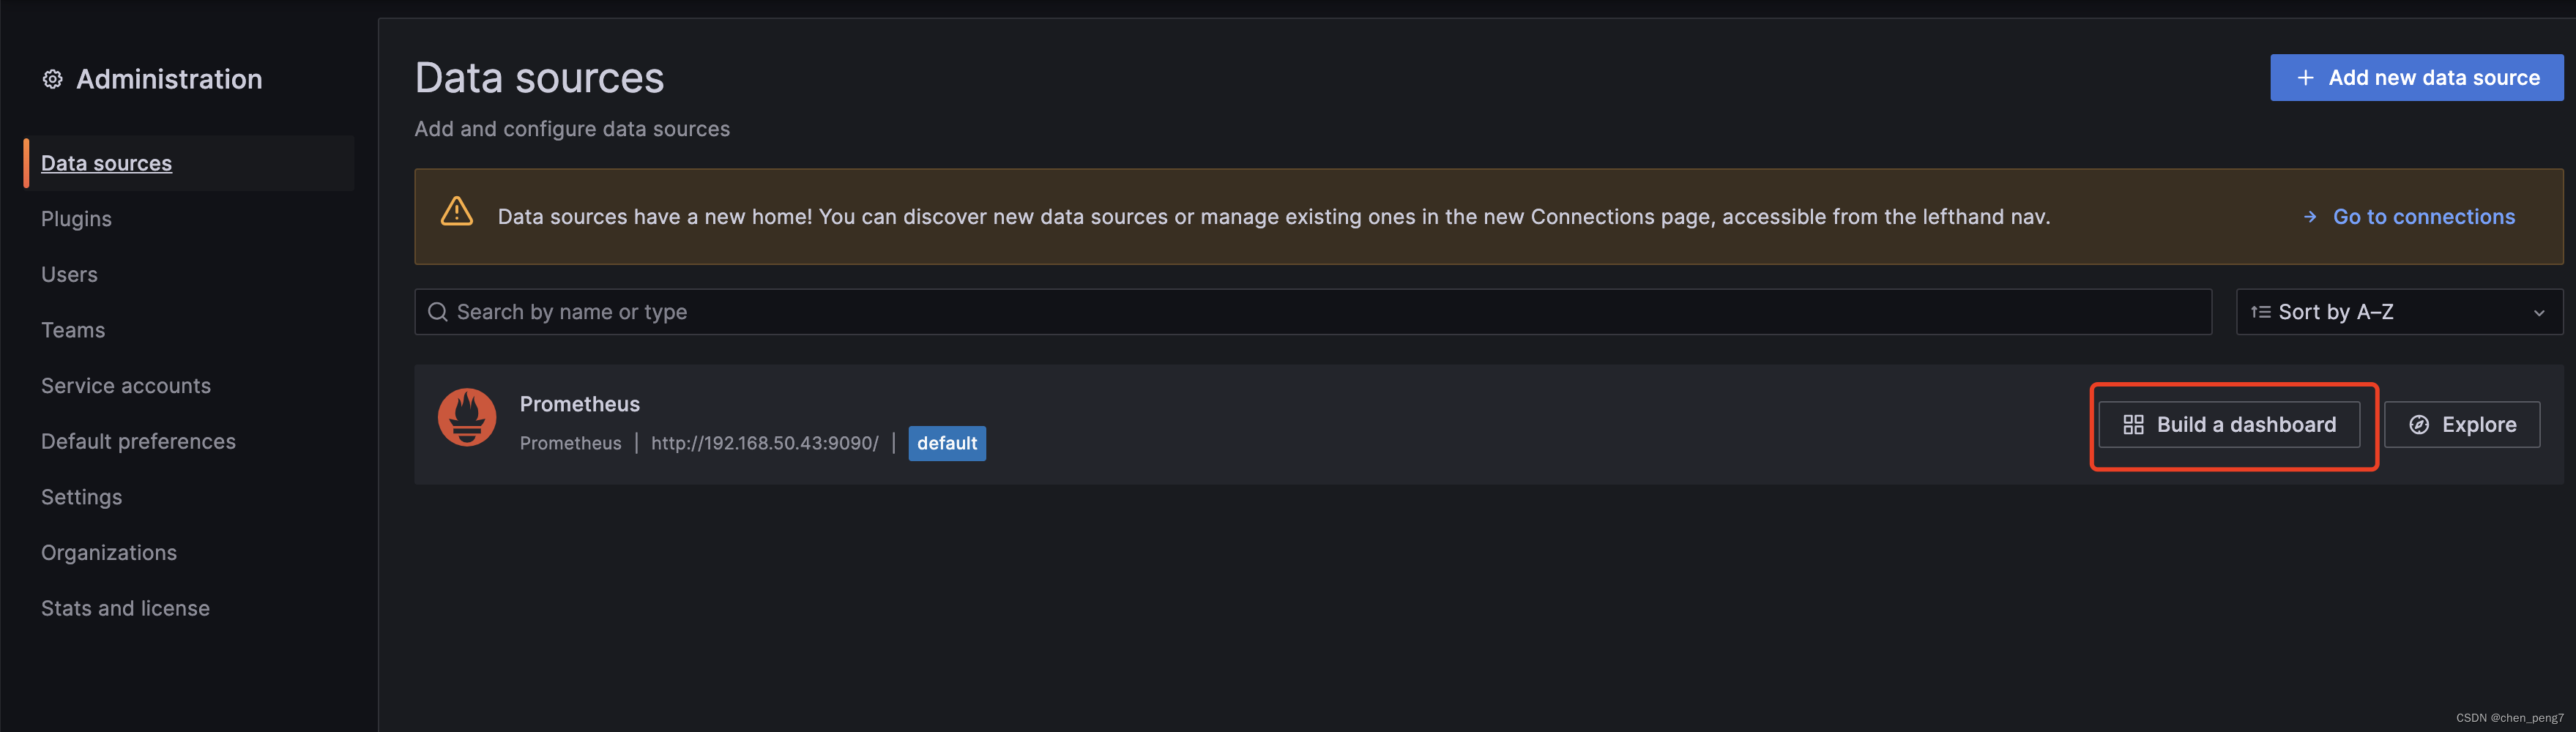
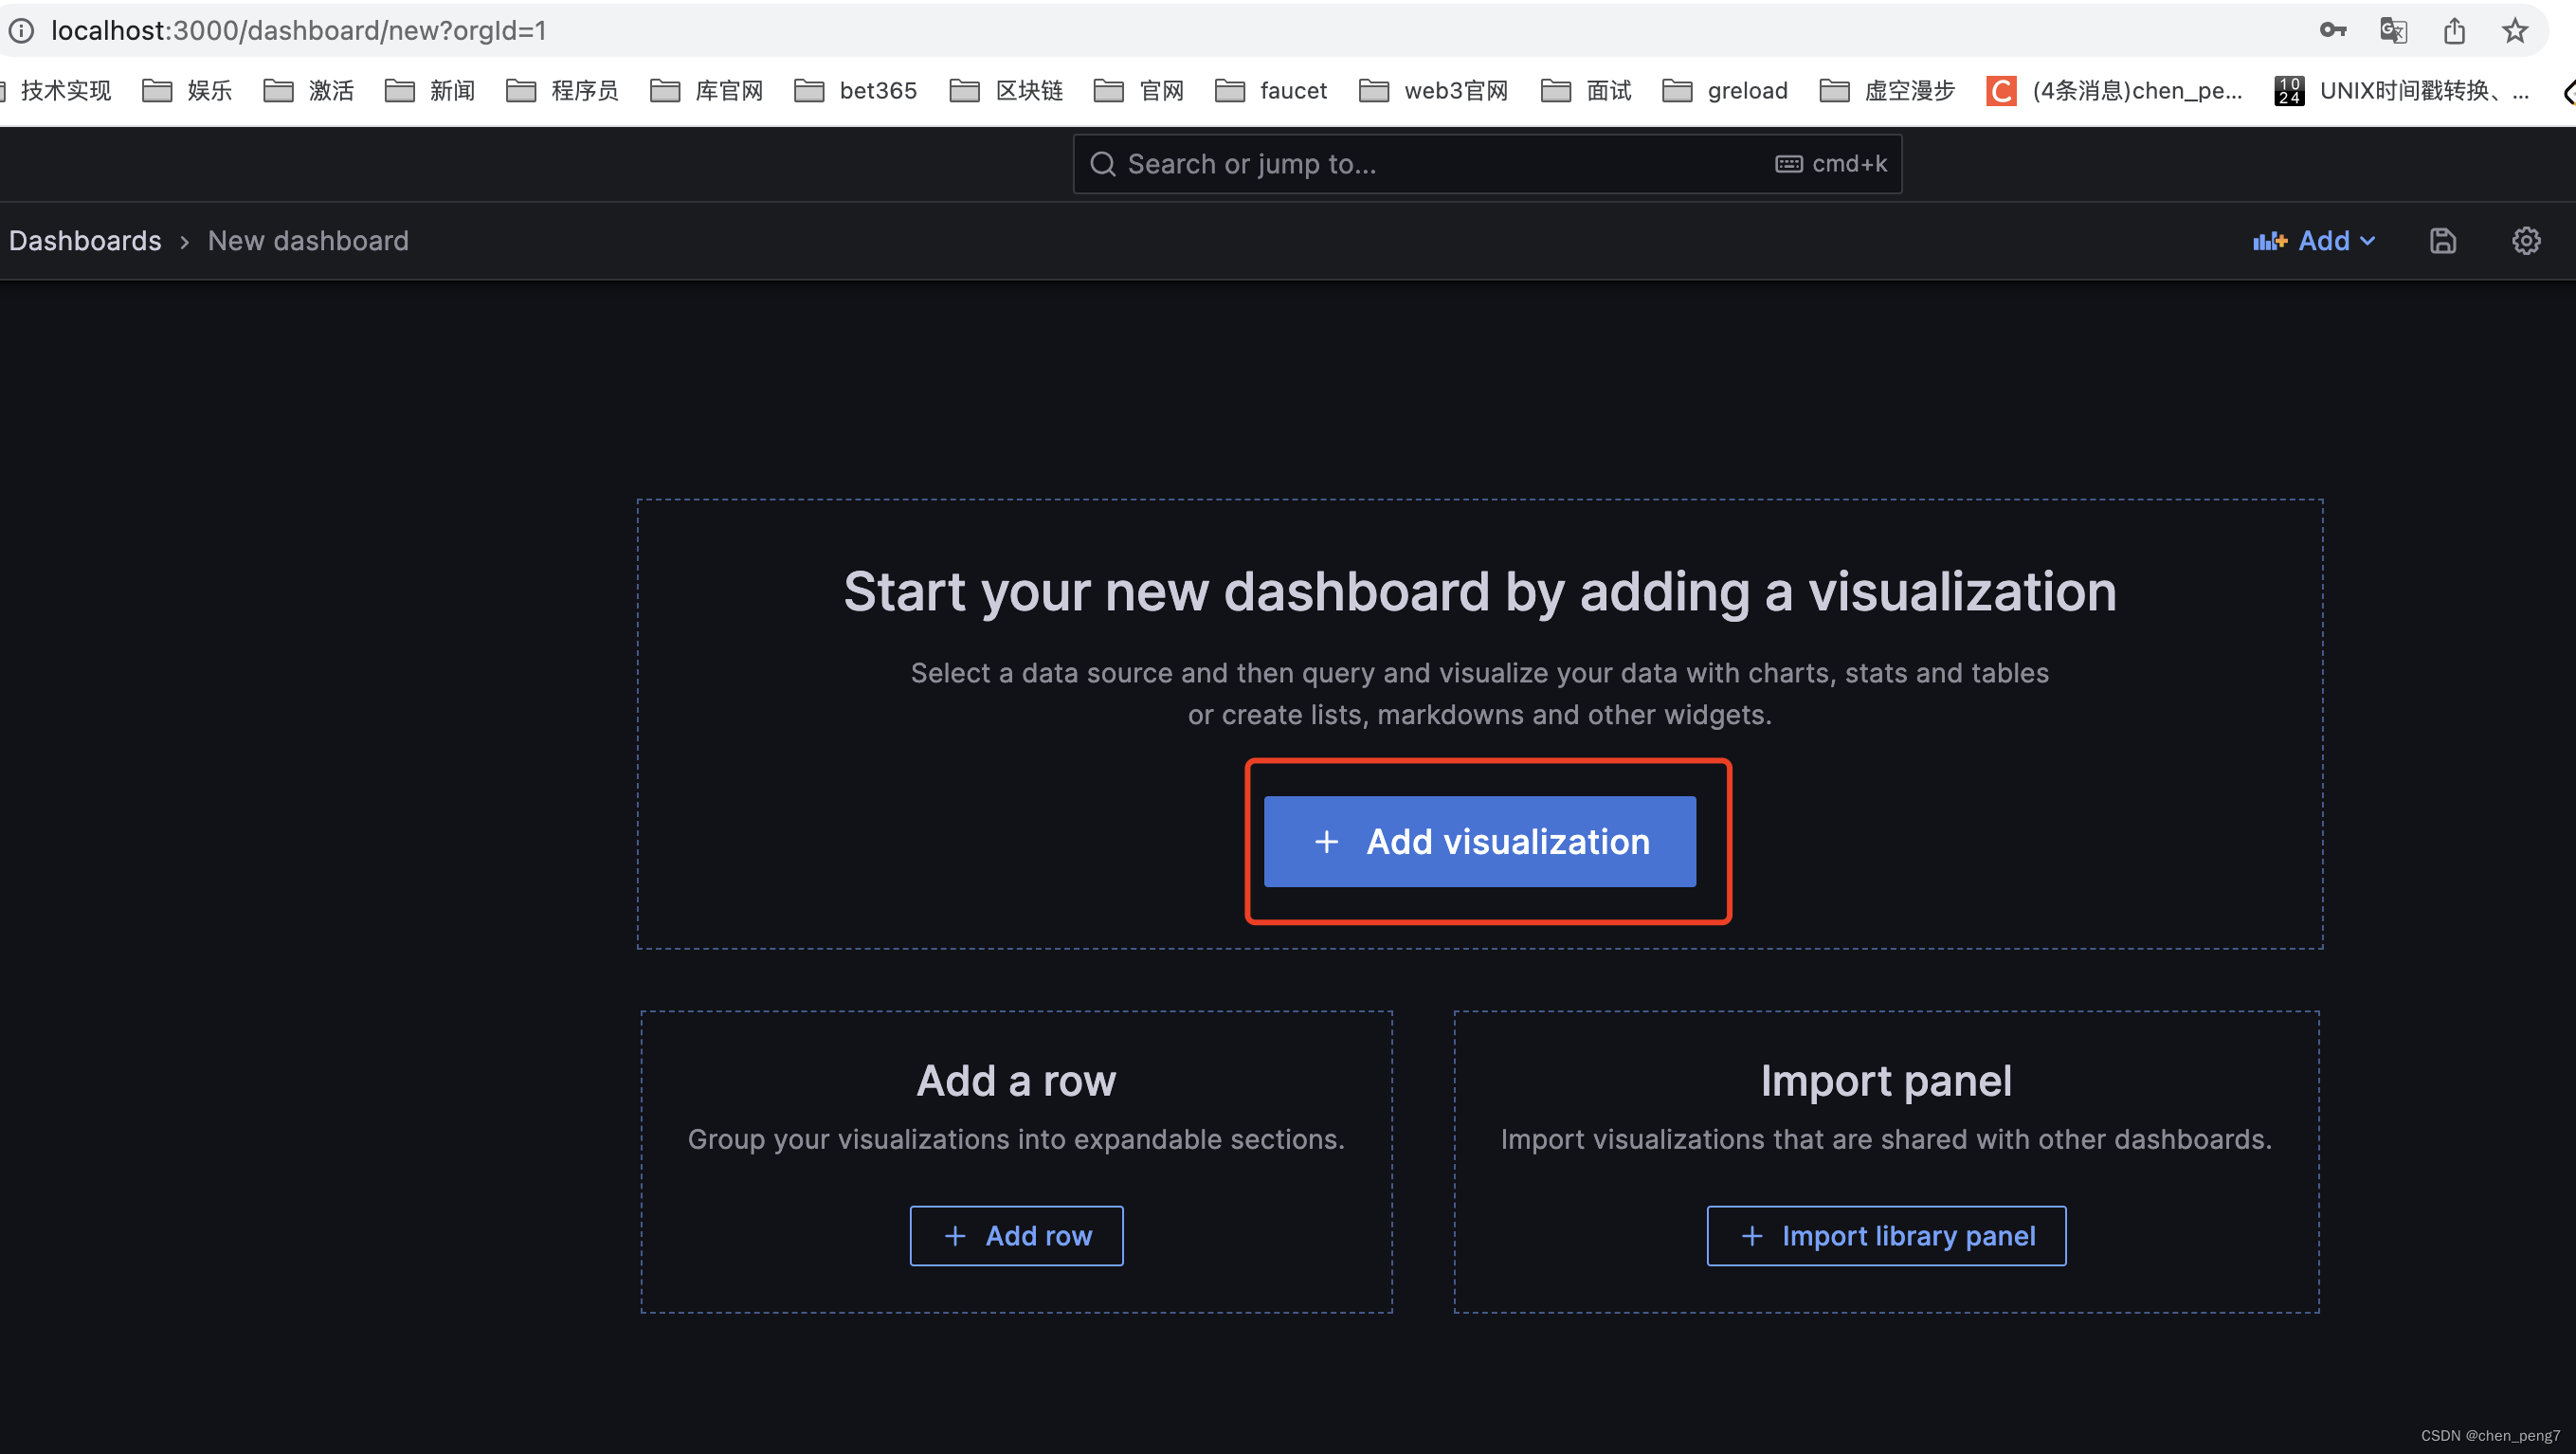
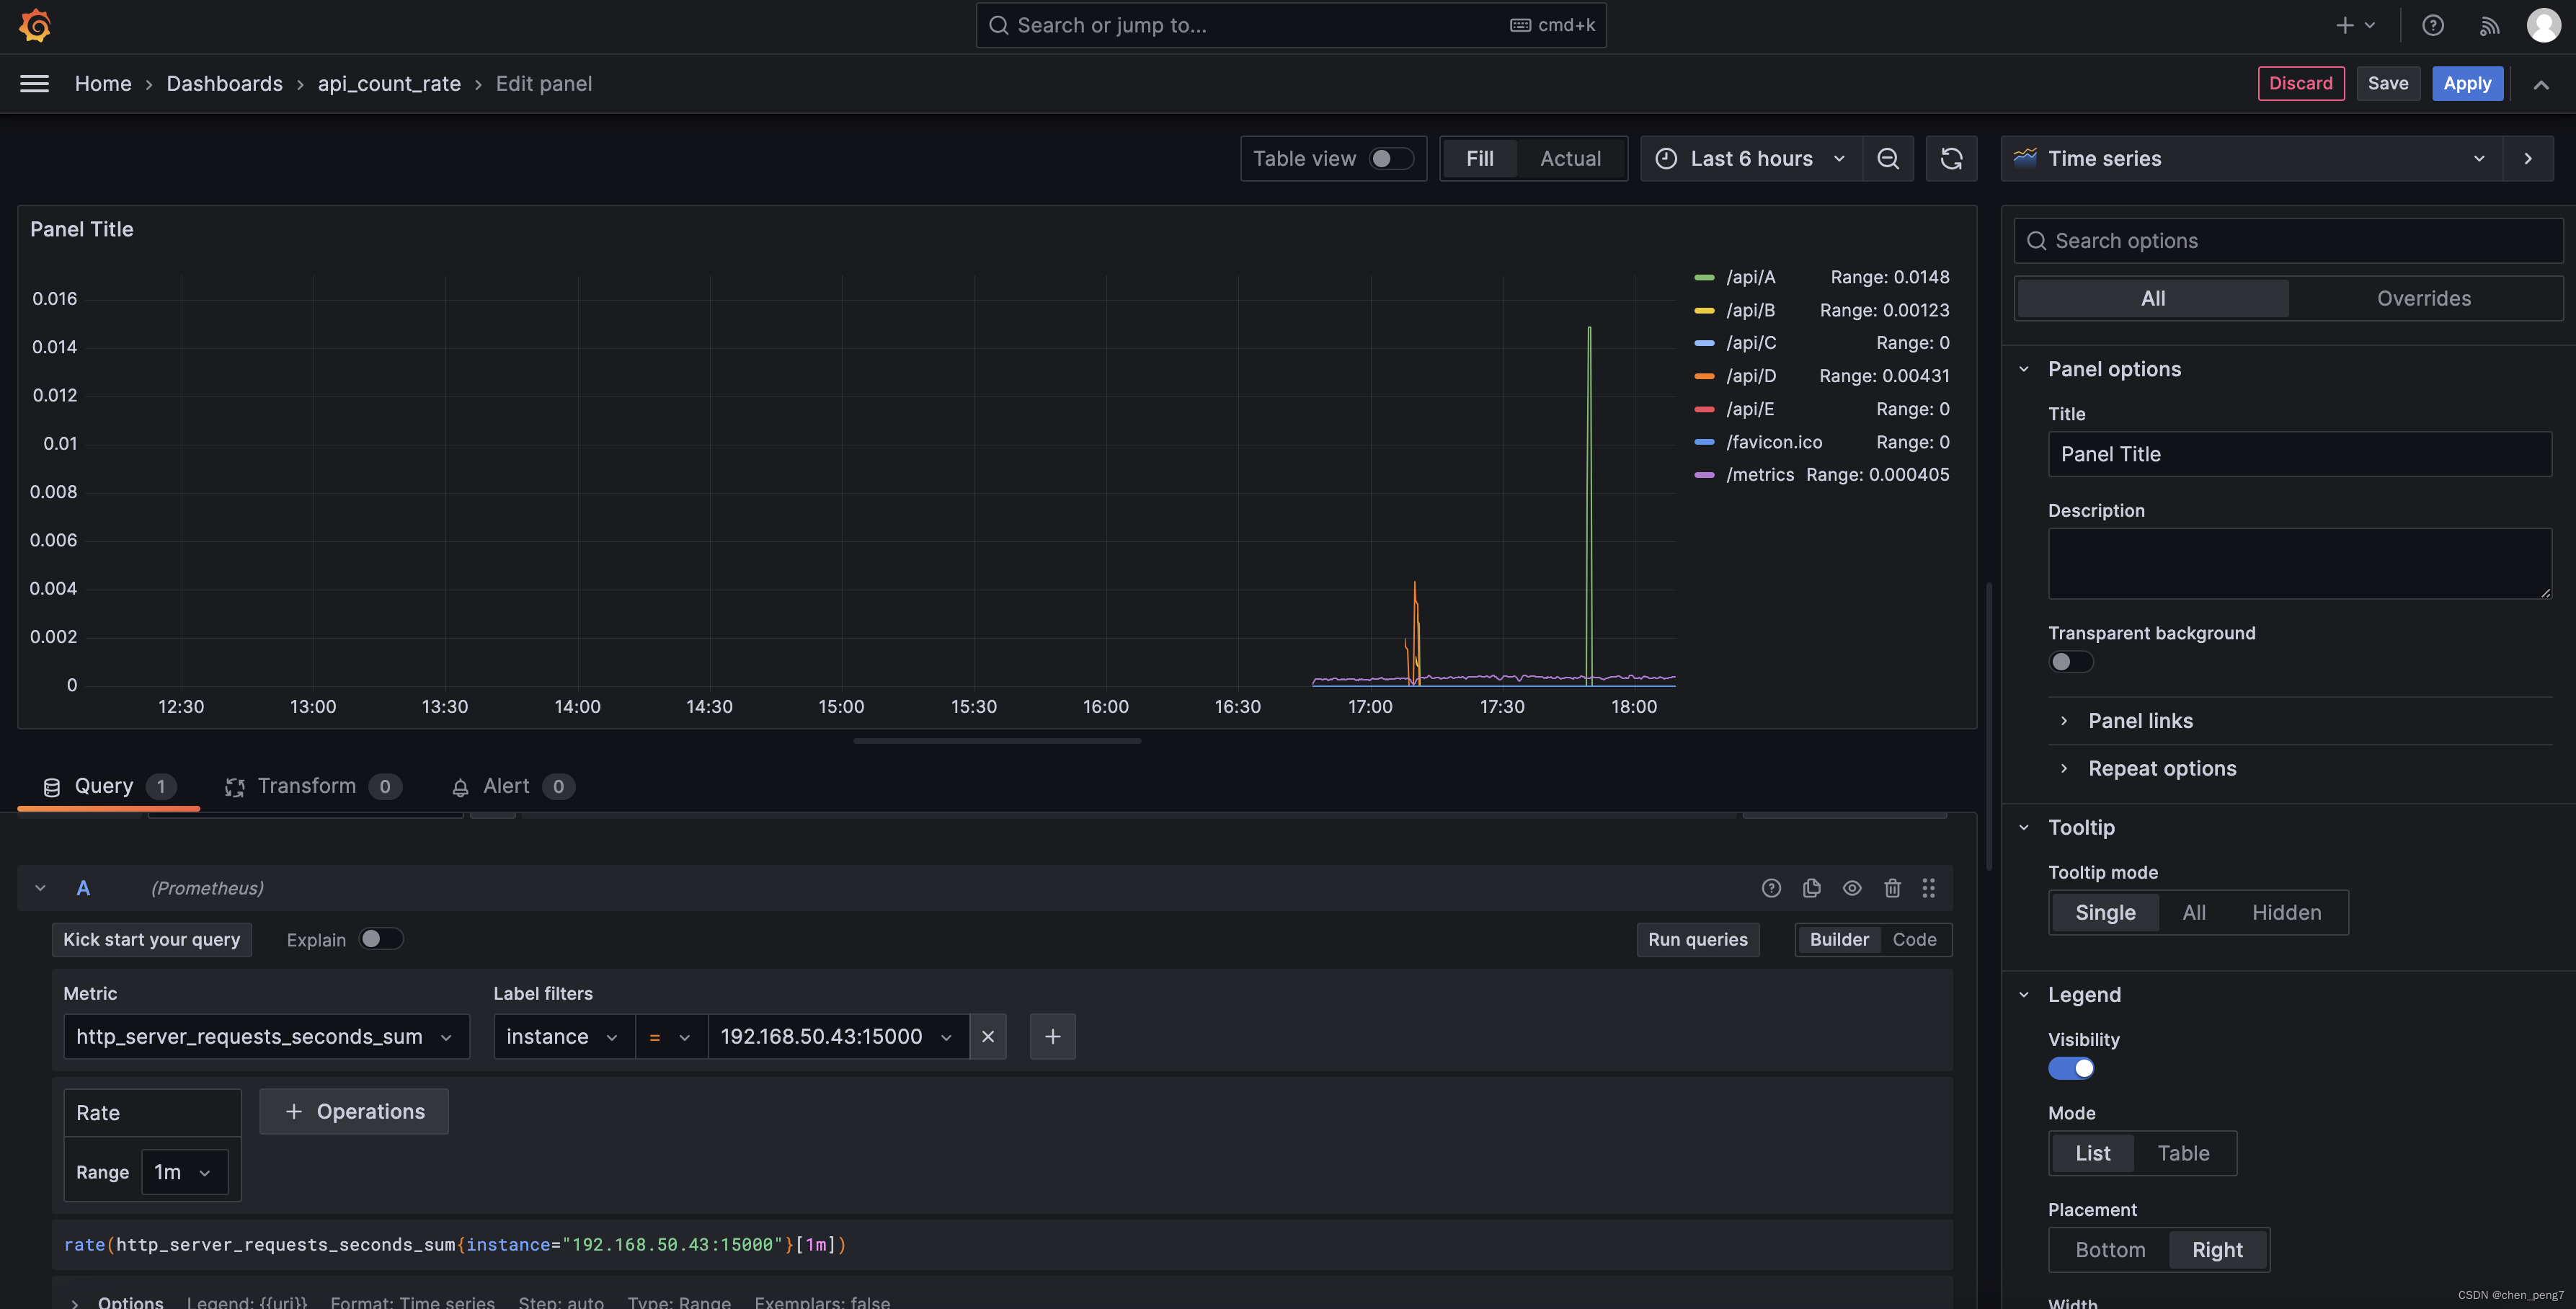
添加图表并设置对应函数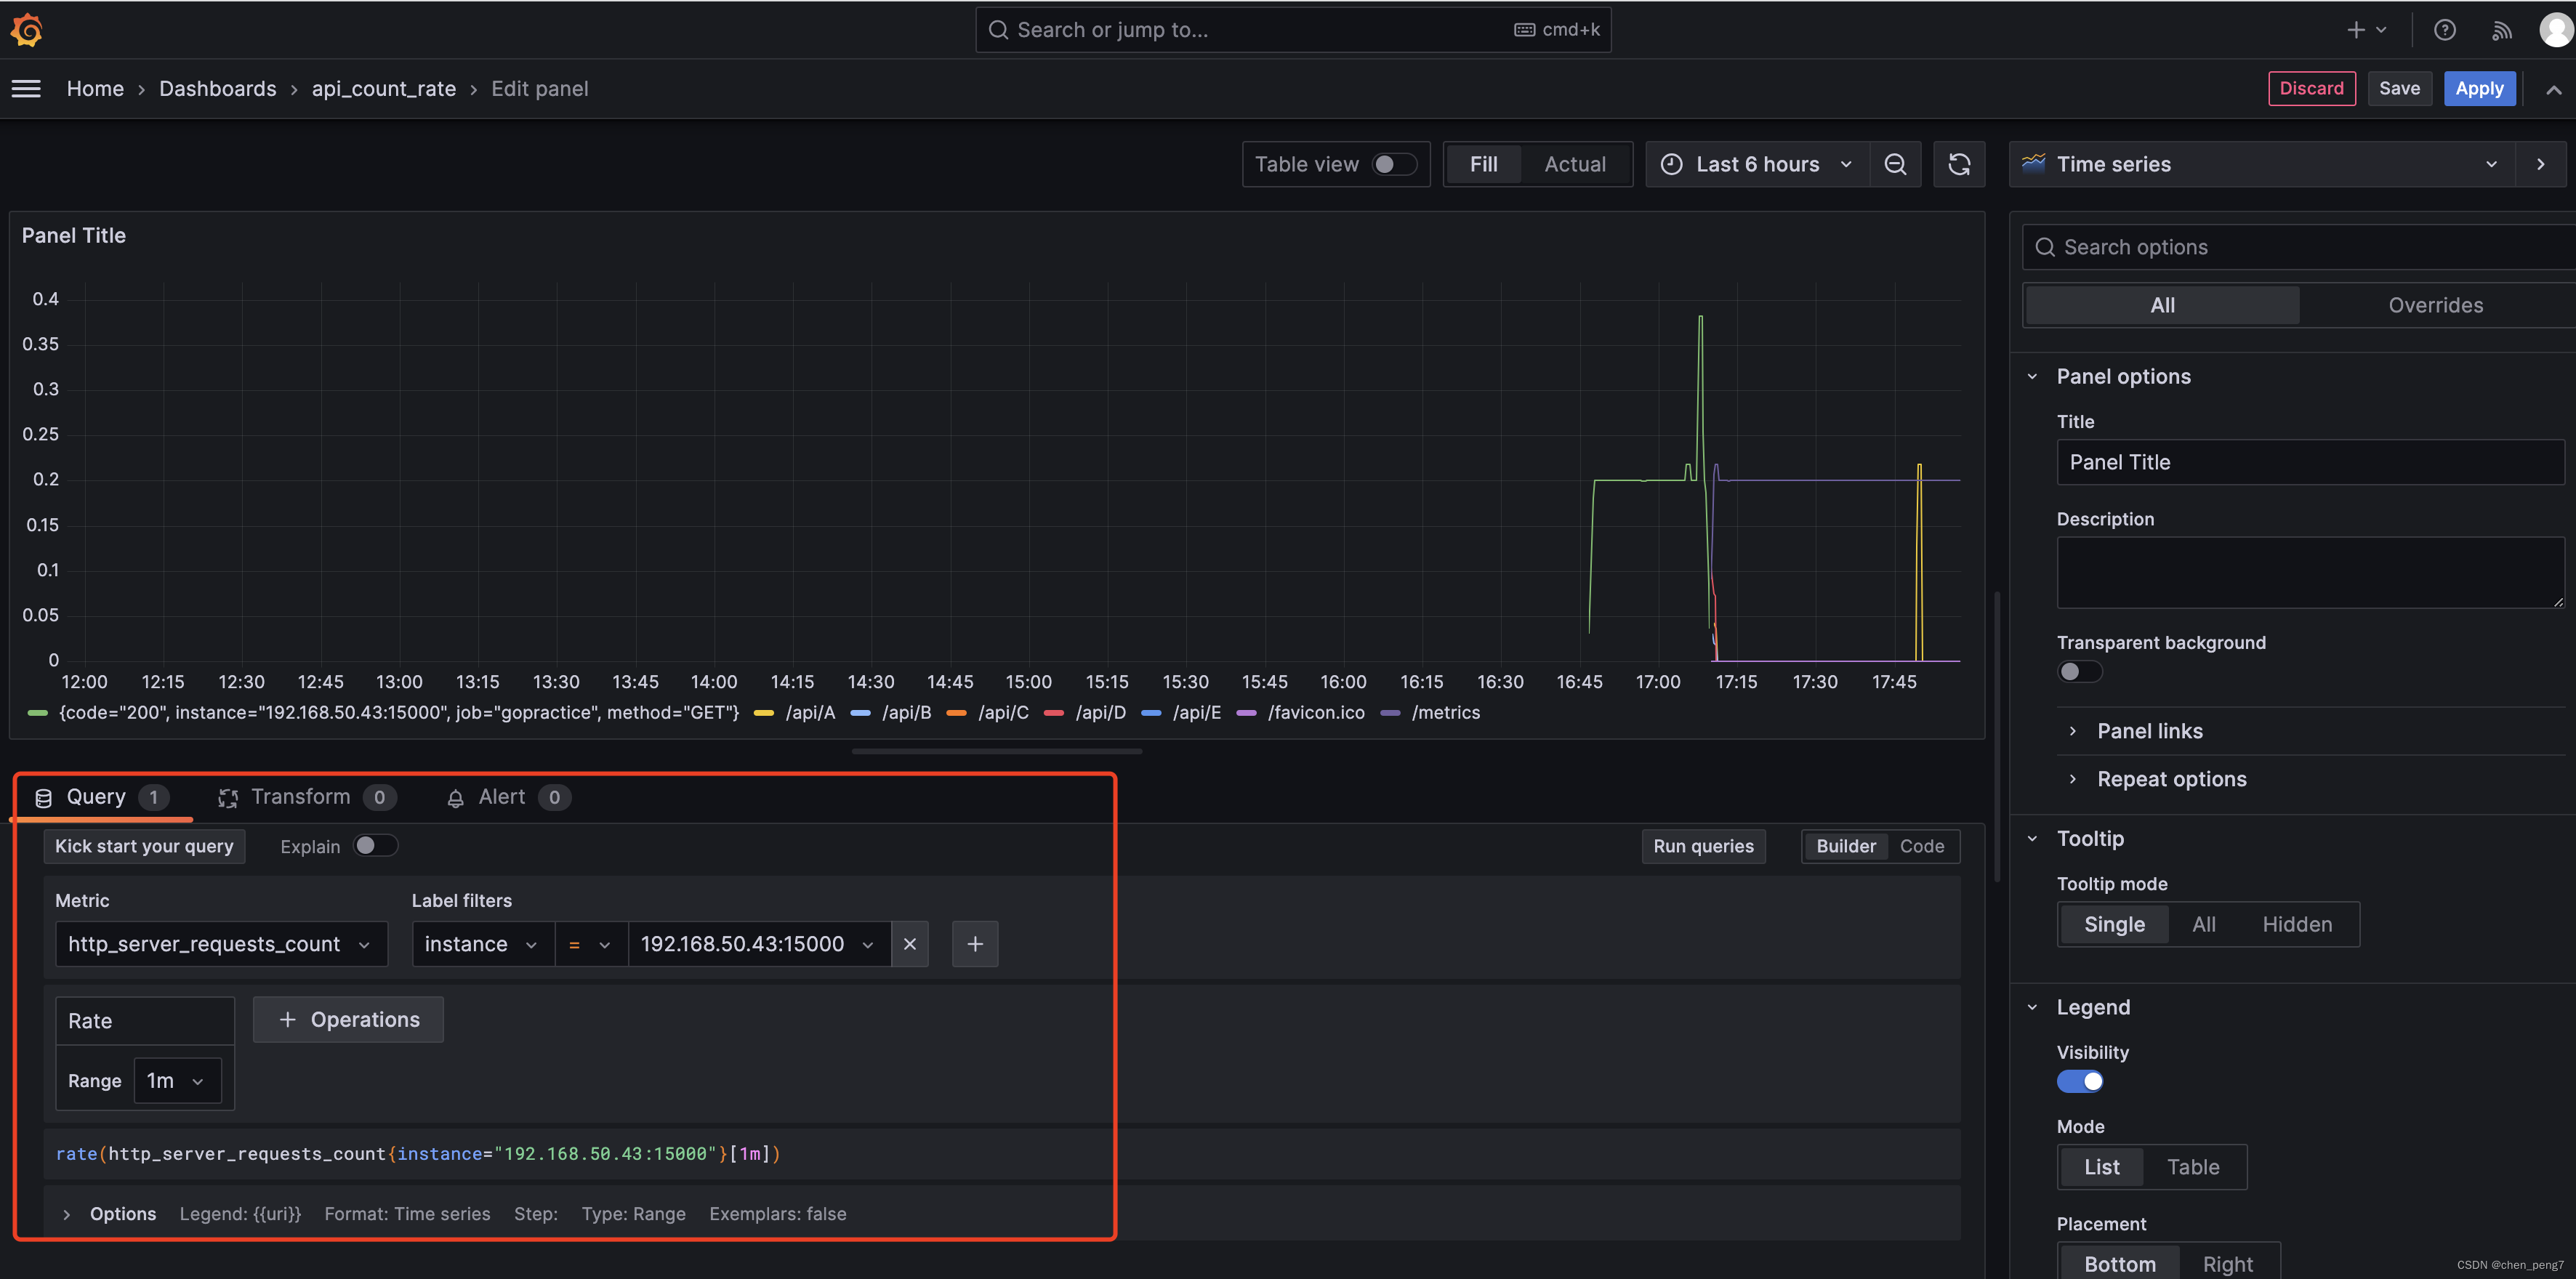

![[进阶]TCP通信实现BS架构,网站开发的原理,线程池优化BS架构](https://img-blog.csdnimg.cn/04ac05ba6af04765ae57f5860668a7e9.png)