系类文章目录
机器学习算法——KD树算法介绍以及案例介绍
机器学习的一些常见算法介绍【线性回归,岭回归,套索回归,弹性网络】
文章目录
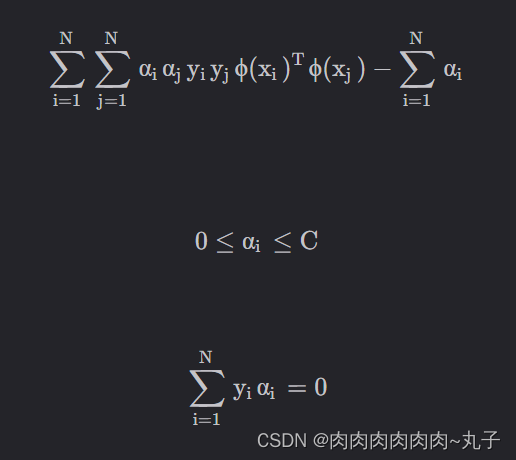
一、SVM支持向量机介绍
1.1、SVM介绍
1.2、几种核函数简介
a、sigmoid核函数
b、非线性SVM与核函数
重要参数kernel作为SVC类最重要的参数之一,“kernel"在sklearn中可选以下几种选项:编辑c、kernel=“poly”
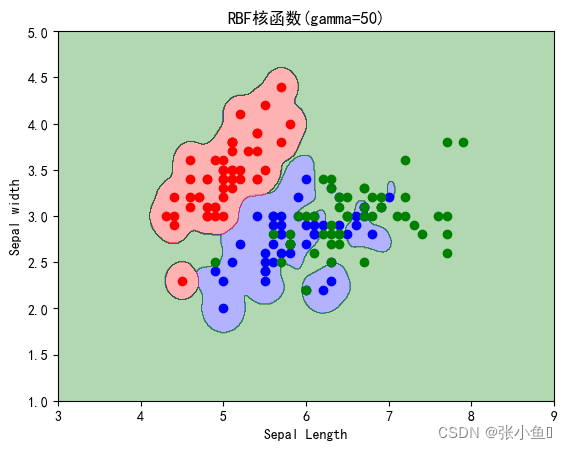
d、kernel=“rbf” 和 gamma
二、SVM案例介绍
2.1、利用波斯顿房价数据对SVM支持向量机使用不同核函数处理数据
2.2、利用鸢尾花数据进行SVM分类
总结
前言
本文简单介绍SVM分类器、以及核函数、SVM分类器的应用。以下案例经供参考
一、SVM支持向量机介绍
1.1、SVM介绍
- SVM是按照监督类学习方式进行运作的。即:数据当中含有目标值。
- SVM采用监督学习方式,对数据进行二分类(这点跟逻辑回归一样)。但是,SVM和逻辑回归(LR)有有很多不同点。
两者的相同点
- 二者都是线性分类器
- 二者都是监督学习算法
- 都属于判别模型(KNN, SVM, LR都属于判别模型),所谓判别模型就是指:通过决策函数,判别各个样本之间的差别来进行分类。
- 二者的损失函数和目标函数不一样。
- 二者对数据和参数的敏感度不同。SVM由于采用了类似于“过度边界”的方式,泛化能力更好
SVM可以作线性分类器,但是在引入核函数(Kernel Method)之后,也可以进行非线性分类
1.2、几种核函数简介
a、sigmoid核函数

b、非线性SVM与核函数
重要参数kernel & degree & gamma
重要参数kernel
作为SVC类最重要的参数之一,“kernel"在sklearn中可选以下几种选项:
 c、kernel=“poly”
- 方法一:
多项式思维:扩充原本的数据,制造新的多项式特征;(对每一个样本添加多项式特征)
步骤:
- PolynomialFeatures(degree = degree):扩充原始数据,生成多项式特征;
- StandardScaler():标准化处理扩充后的数据;
- LinearSVC:使用 SVM 算法训练模型;
- 方法二:
使用scikit-learn 中封装好的核函数: SVC(kernel=‘poly’, degree=degree, C=C)
**功能:**当 SVC() 的参数 kernel = ‘poly’ 时,直接使用多项式特征处理数据;
注:使用 SVC() 前,也需要对数据进行标准化处理
d、kernel=“rbf” 和 gamma
1、高斯核函数、高斯函数
- μ:期望值,均值,样本平均数;(决定告诉函数中心轴的位置:x = μ)
- σ2:方差;(度量随机样本和平均值之间的偏离程度:为总体方差,为变量, 为总体均值, 为总体例数)
- 实际工作中,总体均数难以得到时,应用样本统计量代替总体参数,经校正后,样本方差计算公式:$S^2= \sum (X-μ)^2/(n-1) $为样本均值,n为样本例数。
- σ:标准差;(反应样本数据分布的情况:σ 越小高斯分布越窄,样本分布越集中;σ 越大高斯分布越宽,样本分布越分散)
- γ = 1 / (2 σ 2 σ^2σ2 ):γ 越大高斯分布越窄,样本分布越集中;γ 越小高斯分布越宽,样本分布越密集;
超参数 γ 值越小模型复杂度越低,γ 值越大模型复杂度越高
Sigmoid核函数,它在非线性数据上强于两个线性核函数,但效果明显不如rbf,它在线性数据上完全比不上线性的核函数们,对扰动项的抵抗也比较弱,所以它功能比较弱小,很少被用到。
rbf,高斯径向基核函数基本在任何数据集上都表现不错,属于比较万能的核函数。我个人的经验是,无论如何先试试看高斯径向基核函数,它适用于核转换到很高的空间的情况,在各种情况下往往效果都很不错,如果rbf效果不好,那我们再试试看其他的核函数。另外,多项式核函数多被用于图像处理之中。
1.线性核,尤其是多项式核函数在高次项时计算非常缓慢
2.rbf和多项式核函数都不擅长处理量纲不统一的数据集
二、SVM案例介绍
2.1、利用波斯顿房价数据对SVM支持向量机使用不同核函数处理数据
import numpy as np
import matplotlib.pyplot as plt
plt.rcParams['font.sans-serif'] = ['SimHei']
import warnings#引入警告信息库
warnings.filterwarnings('ignore')#过滤警告信息
#导入波斯顿房价数据
from sklearn.datasets import load_boston
boston = load_boston()
#导入数据集拆分工具
from sklearn.model_selection import train_test_split
#建立训练数据集和测试数据集
X,y = boston.data,boston.target
X_train,X_test,y_train,y_test=train_test_split(X,y,random_state = 8)
#打印训练集与测试集状态
print('train datasets size:',X_train.shape)
print('test datasets size:',X_test.shape)
print('\n')
from sklearn.svm import SVR
for kernel in ['linear','rbf','sigmoid']:
    svr = SVR(kernel = kernel,gamma = 'auto')
    svr.fit(X_train,y_train)
    print(kernel,'核函数的模型训练集得分:{:.3f}'.format(svr.score(X_train,y_train)))
    print(kernel,'核函数的模型测试集得分:{:.3f}\n'.format(svr.score(X_test,y_test)))
#导入数据预处理工具
from sklearn.preprocessing import StandardScaler
#对数据集进行数据预处理
scaler = StandardScaler()
scaler.fit(X_train)
X_train_scaled = scaler.transform(X_train)
X_test_scaled = scaler.transform(X_test)
#用预处理后的数据查询训练模型
for kernel in ['linear','rbf','sigmoid']:
    svr = SVR(kernel = kernel)
    svr.fit(X_train,y_train)
    print('数据预处理后',kernel,'核函数的模型训练集得分:{:.3f}'.format(svr.score(X_train,y_train)))
    print('数据预处理后',kernel,'核函数的模型测试集得分:{:.3f}\n'.format(svr.score(X_test,y_test)))
svr = SVR(C = 100,gamma = 0.1,kernel = 'rbf')
svr.fit(X_train_scaled,y_train)
print('调节参数后的''rbf内核的SVR模型训练集得分:{:.3f}'.format(svr.score(X_train_scaled,y_train)))
print('调节参数后的''rbf内核的SVR模型测试集得分:{:.3f}\n'.format(svr.score(X_test_scaled,y_test)))
程序运行结果:
train datasets size: (379, 13)
test datasets size: (127, 13)


linear 核函数的模型训练集得分:0.709
linear 核函数的模型测试集得分:0.696

rbf 核函数的模型训练集得分:0.145
rbf 核函数的模型测试集得分:0.001

sigmoid 核函数的模型训练集得分:-0.024
sigmoid 核函数的模型测试集得分:-0.027

数据预处理后 linear 核函数的模型训练集得分:0.709
数据预处理后 linear 核函数的模型测试集得分:0.696

数据预处理后 rbf 核函数的模型训练集得分:0.192
数据预处理后 rbf 核函数的模型测试集得分:0.222

数据预处理后 sigmoid 核函数的模型训练集得分:0.059
数据预处理后 sigmoid 核函数的模型测试集得分:0.075

调节参数后的rbf内核的SVR模型训练集得分:0.966
调节参数后的rbf内核的SVR模型测试集得分:0.894
2.2、利用鸢尾花数据进行SVM分类
#使用svm分类器实现鸢尾花数据的分类
import numpy as np
import matplotlib.pyplot as plt
plt.rcParams['font.sans-serif'] = ['SimHei']
from matplotlib.colors import ListedColormap
#import warnings#引入警告信息库
#warnings.filterwarnings('ignore')#过滤警告信息
#导入鸢尾花数据集,总共150
from sklearn import datasets
from sklearn import svm
from sklearn.linear_model import LogisticRegression

iris = datasets.load_iris()
x=iris.data[:,:2]
print("Train data size:",np.shape(x))
y=iris.target
plt.figure(2)
for i in range(len(y)):
    if y[i]==0:
        p0=plt.scatter(x[i,0],x[i,1],alpha=1,c='r',marker='s')
    elif y[i]==1:
        p1=plt.scatter(x[i,0],x[i,1],alpha=1,c='b',marker='*')
    else:
        p2=plt.scatter(x[i,0],x[i,1],alpha=1,c='green',marker='o')
plt.legend([p0,p1,p2],['0','1','2'],loc = 'upper left')
plt.title('鸢尾花样本分布图')
plt.show()
print(40*'*')


gamma=50
svc=svm.SVC(kernel='rbf',C=10,gamma=gamma)
svc.fit(x,y)
print('SV number:',svc.support_)
print('SV set:',svc.support_vectors_)
print('SVC score:',svc.score(x,y))
print(40*'*')
logi = LogisticRegression(C=1.0,penalty='l2',solver='sag',max_iter=1000)

svc_linear=svm.SVC(C=1.0,kernel="linear")

svc_poly=svm.SVC(C=1.0,kernel="poly",degree=7)

svc_rbf1=svm.SVC(C=1.0,kernel="rbf",gamma=0.5)

svc_rbf2=svm.SVC(C=1.0,kernel="rbf",gamma=50)
clfs=[logi,svc_linear,svc_poly,svc_rbf1,svc_rbf2]
titles=["逻辑斯蒂回归",'线性回归函数SVM','7阶多项式核函数SVM','RBF核函数(gamma=0.5)','RBF核函数(gamma=50)']

for clf,i in zip(clfs,range(len(clfs))):
    clf.fit(x,y)
    print(titles[i],'在全体样本集上的性能评分:',clf.score(x,y))
print(40*'*')
def plot_decision_regions(X,y,classifier,resolution = 0.01):
    markers = ('s','x','o','^','v')
    colors = ('r','b','green','k','ightgreen')
    #通过ListedColormap从颜色列表创建色度图,为每个分类分配一个颜色
    #用于将数字映射到颜色或者以以为颜色数组进行颜色规格转换
    #用于生成网格矩阵区域,程序中根据属性上下进行自动调整
    cmap = ListedColormap(colors[:len(np.unique(y))])
    x1_min = np.floor(X[:,0].min()-0.5)
    x1_max = np.ceil(X[:,0].max()+0.5)
    x2_min = np.floor(X[:,1].min()-0.5)
    x2_max = np.ceil(X[:,1].max()+0.5)
    #创建网格阵列
    xx1,xx2 = np.meshgrid(np.arange(x1_min,x1_max+resolution,resolution),np.arange(x2_min,x2_max+resolution,resolution))
    #xx1,xx2 = np.meshgrid(np.linspace(x1_min,x1_max,int((x1_max-x1_min)/resolution)),np.linspace(x2_min,x2_max,int((x1_max-x2_min)/resolution)))
    #用predict方法预测相关的网格点的分类标签
    Z = classifier.predict(np.array([xx1.ravel(),xx2.ravel()]).T)
    Z = Z.reshape(xx1.shape)
    plt.contourf(xx1,xx2,Z,alpha = 0.3,cmap = cmap)#画出函数的轮廓图
    plt.xlim(x1_min,x1_max)
    plt.ylim(x2_min,x2_max)
    for idx,cl in enumerate(np.unique(y)):
        plt.scatter(x=X[y==cl,0],y=X[y==cl,1],alpha=1.0,c=colors[idx],label=cl)
for clf,i in zip(clfs,range(len(clfs))):
    clf.fit(x,y)
    plt.figure(i)
    plot_decision_regions(x,y,classifier=clf)
    plt.xlabel('Sepal Length')
    plt.ylabel('Sepal width')
    plt.title(titles[i])
plt.show()
程序运行结果:
Train data size: (150, 2)
****************************************
SV number: [  3   4   6   8  10  13  14  15  16  17  18  21  22  23  24  25  26  27
  28  29  30  31  32  33  34  35  36  37  41  42  43  45  46  47  48  50
  51  52  53  54  56  57  58  59  60  61  62  64  65  67  68  69  70  72
  73  74  75  76  77  78  79  81  82  83  84  85  86  87  88  89  90  91
  92  93  94  95  97  98  99 100 101 102 103 104 105 106 107 108 109 110
 111 112 113 114 115 117 118 119 120 121 122 123 124 125 126 127 128 129
 130 131 132 134 135 136 137 138 139 140 141 142 144 145 146 147 148 149]
PS:此处我省略了一部分结果集
SVC score: 0.9266666666666666
****************************************
逻辑斯蒂回归 在全体样本集上的性能评分: 0.8133333333333334
线性回归函数SVM 在全体样本集上的性能评分: 0.82
7阶多项式核函数SVM 在全体样本集上的性能评分: 0.8266666666666667
RBF核函数(gamma=0.5) 在全体样本集上的性能评分: 0.8266666666666667
RBF核函数(gamma=50) 在全体样本集上的性能评分: 0.8933333333333333
****************************************
总结
以上就是对SVM分类器的部分介绍,希望对初学者有所帮助。
最后欢迎大家点赞👍,收藏⭐,转发🚀,
如有问题、建议,请您在评论区留言💬哦。


