引言
博文字数7000,建议阅读时间20分钟。
这篇博客对当前几种典型的图像异常检测算法进行了比较,包括Kmeans、Kmeans++以及大津法(OTSU),并给出了相关的代码实现与测试方法。总结的比较结果如下表所示:
| 方法类型 | Kmeans | Kmeans++ | OTSU |
|---|---|---|---|
| 推理时间消耗(inference time) | 1.368s | 30.726s | 0.078s |
主要结论如下:
- Kmeans++的中心选择算法当然有较大的优化空间,此处是简单的for循环python代码,仍然存在较大提升空间。
- 三种算法OTSU相对最快,Kmeans聚类则可以选择聚类数k,而Kmeans++则不受到聚类中心的影响。
基于Python的图像异常检测技术-基础详解
- 1. 基于K均值聚类(Kmeans)的图像异常检测
- 1.1 实现代码
- 1.2 测试效果
- 2. 基于K均值聚类(Kmeans++)的图像异常检测
- 2.1 实现代码
- 2.2 测试效果
- 3. 基于OTSU的图像异常检测
- 3.1 实现代码
- 3.2 测试效果
- 参考文献资料
1. 基于K均值聚类(Kmeans)的图像异常检测
1.1 实现代码
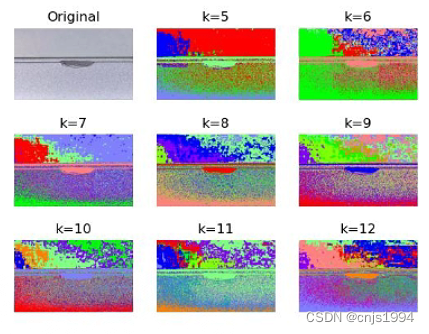
要识别图片中异常的地方,可以使用计算机视觉中的Image Segmentation(图像分割) 技术。下面是使用 Python 语言和 OpenCV 库实现的一个简单demo,使用 K-Means 算法进行颜色聚类,将相似的像素分为一组,然后使用二值化将其转换为黑白图像,最后使用形态学操作(腐蚀和膨胀)去除噪声并找到异常的区域。
import numpy as np
import matplotlib.pyplot as plt
import matplotlib.image as mpimg
from matplotlib.colors import ListedColormap
import matplotlib.colors as mcolors

if __name__ == '__main__':
    # Initialize rgb pixel values for each class in kmeans using specific values
    # Generate 10 equidistant colors
    # Define a list of 12 colors
    colors = ["#00008B", "#008B8B", "#FF8C00", "#FF69B4", "#008000", "#0000CD", "#4B0082", "#FF00FF", "#1E90FF",
              "#FFD700", "#FF1493", "#6495ED"]

    # Create the colormap
    selec_bgr = ListedColormap(colors)
    bgr_list = selec_bgr.colors
    # Reading images using matplotlib library
    image = mpimg.imread('./data/Tianchi_metal_defect.png')
    height, width, channel = image.shape
    # show original image
    plt.figure()
    plt.subplot(3, 3, 1)
    plt.axis('off')
    plt.title('Original')
    plt.imshow(image)
    # do kmeans segmentation
    for i, k in enumerate(range(5, 13, 1)):
        # extract bgr features
        features = []
        print(f"正在计算k={k},第{k-4}张聚类图...")
        try:
            for y in range(height):
                for x in range(width):
                    features.append(image[y, x, :] / 255)
            features = np.array(features)
            # initial segments center using random value in features
            kmeans_centers = features[np.random.choice(len(features), k), :]
            kmeans_centers = np.array(kmeans_centers)
        except:
            pass
        # update
        while True:
            # calculate distance matrix
            def euclidean_dist(X, Y):
                Gx = np.matmul(X, X.T)
                Gy = np.matmul(Y, Y.T)
                diag_Gx = np.reshape(np.diag(Gx), (-1, 1))
                diag_Gy = np.reshape(np.diag(Gy), (-1, 1))
                return diag_Gx + diag_Gy.T - 2 * np.matmul(X, Y.T)

            dist_matrix = []
            for start in range(0, len(features), 1000):
                dist_matrix.append(euclidean_dist(features[start:start + 1000, :], kmeans_centers))
            dist_matrix = np.concatenate(dist_matrix, axis=0)
            # dist_matrix = euclidean_dist(features, kmeans_centers)
            # get seg class for each sample
            segs = np.argmin(dist_matrix, axis=1)
            # update new kmeans center
            new_kmeans_centers = []
            for j in range(k):
                new_kmeans_centers.append(np.mean(features[segs == j, :], axis=0))
            new_kmeans_centers = np.array(new_kmeans_centers)
            # calculate whether converge
            if np.mean(abs(kmeans_centers - new_kmeans_centers)) < 0.1:
                break
            else:
                kmeans_centers = new_kmeans_centers
        # assign
        segs = segs.reshape(height, width)
        seg_result = np.zeros((height, width, channel), dtype=np.uint8)
        for y in range(height):
            for x in range(width):
                seg_result[y, x, :] = mcolors.hex2color(bgr_list[segs[y, x]])

        # show kmeans result
        plt.subplot(3, 3, i + 2)
        plt.title('k={}'.format(k))
        plt.axis('off')
        plt.imshow(seg_result)
        plt.savefig('Tianchi_metal_defect_kmeans.jpg')
1.2 测试效果
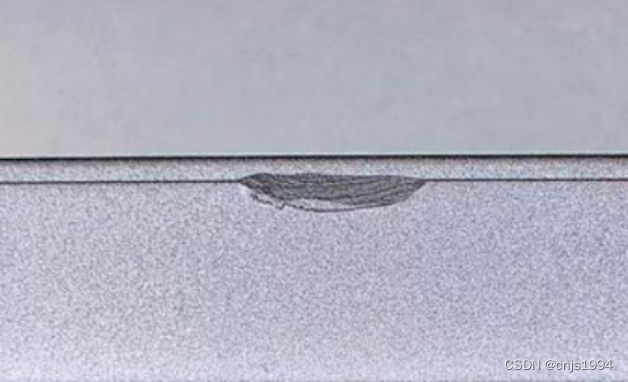
- 原图如下,数据是天池铝型材表面缺陷数据集的样例图片
- 检测结果如下
正在计算k=5,第1张聚类图...
正在计算k=6,第2张聚类图...
正在计算k=7,第3张聚类图...
正在计算k=8,第4张聚类图...
正在计算k=9,第5张聚类图...
正在计算k=10,第6张聚类图...
正在计算k=11,第7张聚类图...
正在计算k=12,第8张聚类图...

Process finished with exit code 0
以下是不同聚类数(k)的聚类结果。
2. 基于K均值聚类(Kmeans++)的图像异常检测
2.1 实现代码
Kmeans++是在Kmeans算法基础上,修订后实现的一种算法,避免了初始点选择所导致的聚类效果差异和偏差。具体来说,原始K-means算法最开始随机选取数据集中K个点作为聚类中心,而K-means++按照如下的思想选取K个聚类中心:假设已经选取了n个初始聚类中心(0<n<K),则在选取第n+1个聚类中心时:距离当前n个聚类中心越远的点会有更高的概率被选为第n+1个聚类中心。在选取第一个聚类中心(n=1)时同样通过随机的方法。可以说这也符合我们的直觉:聚类中心当然是互相离得越远越好。这个改进虽然直观简单,但是却非常得有效。
相比于Kmeans的代码,就是用下述函数,替换了中心的随机化过程:
#######################################################################################################################
# 计算聚类中心辅助函数
def distance_func(point1, point2):
    distance = np.linalg.norm(point1 - point2)
    return distance

def nearest(point, cluster_centers):
    '''
    计算point和cluster_centers之间的最小距离
    :param point: 当前的样本点
    :param cluster_centers: 当前已经初始化的聚类中心
    :return: 返回point与当前聚类中心的最短距离
    '''
    FLOAT_MAX = math.e-3
    min_dist = FLOAT_MAX
    m = np.shape(cluster_centers)[0]  # 当前已经初始化聚类中心的个数
    for i in range(m):
        # 计算point与每个聚类中心之间的距离
        d = distance_func(point, cluster_centers[i, ])
        # 选择最短距离
        if min_dist > d:
            min_dist = d
    return min_dist

# 计算聚类中心的主函数
def get_cent(points, k):
    '''
    kmeans++的初始化聚类中心的方法
    :param points: 样本
    :param k: 聚类中心的个数
    :return: 初始化后的聚类中心
    '''
    m, n = np.shape(points)
    cluster_centers = np.mat(np.zeros((k, n)))

    # 1、随机选择一个样本点作为第一个聚类中心
    index = np.random.randint(0, m)
    cluster_centers[0,] = np.copy(points[index,])  # 复制函数,修改cluster_centers,不会影响points

    # 2、初始化一个距离序列
    d = [0.0 for _ in range(m)]

    for i in range(1, k):
        sum_all = 0
        for j in range(m):
            # 3、对每一个样本找到最近的聚类中心点
            d[j] = nearest(points[j,], cluster_centers[0:i, ])
            # 4、将所有的最短距离相加
            sum_all += d[j]
        # 5、取得sum_all之间的随机值
        sum_all *= random.random()
        # 6、获得距离最远的样本点作为聚类中心点
        for j, di in enumerate(d):  # enumerate()函数用于将一个可遍历的数据对象(如列表、元组或字符串)组合为一个索引序列,同事列出数据和数据下标一般用在for循环中
            sum_all -= di
            if sum_all > 0:
                continue
            cluster_centers[i] = np.copy(points[j,])
            break
    return cluster_centers
#######################################################################################################################
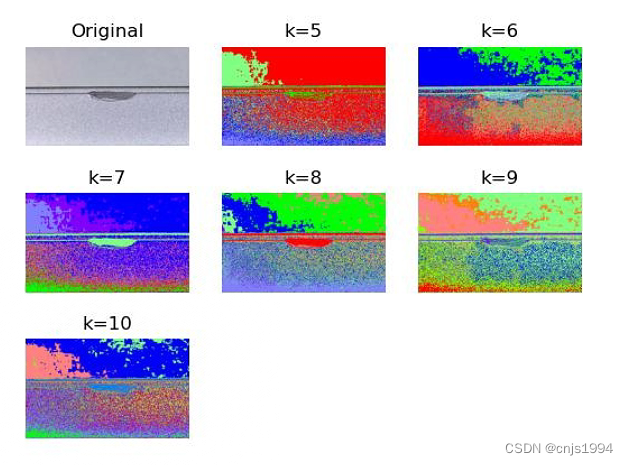
2.2 测试效果
- 运行日志如下:
正在计算k=5,第1张聚类图...
第1次聚类计算的时间消耗为:30.726s
正在计算k=6,第2张聚类图...
第2次聚类计算的时间消耗为:44.796s
正在计算k=7,第3张聚类图...
第3次聚类计算的时间消耗为:62.111s
正在计算k=8,第4张聚类图...
第4次聚类计算的时间消耗为:81.526s
正在计算k=9,第5张聚类图...
第5次聚类计算的时间消耗为:102.608s
正在计算k=10,第6张聚类图...
- 效果如下:
3. 基于OTSU的图像异常检测
3.1 实现代码
大津法(OTSU)是一种确定图像二值化分割阈值的算法,其处理通常是在灰度图的基础上,进一步将图像划分为二值图像,因此,其过程也可被称为二值化。由日本学者大津于1979年提出。从大津法的原理上来讲,该方法又称作最大类间方差法,因为按照大津法求得的阈值进行图像二值化分割后,前景与背景图像的类间方差最大。
它被认为是图像分割中阈值选取的最佳算法,计算简单,不受图像亮度和对比度的影响,因此在数字图像处理上得到了广泛的应用。它是按图像的灰度特性,将图像分成背景和前景两部分。因方差是灰度分布均匀性的一种度量,背景和前景之间的类间方差越大,说明构成图像的两部分的差别越大,当部分前景错分为背景或部分背景错分为前景都会导致两部分差别变小。因此,使类间方差最大的分割意味着错分概率最小。
**基本流程:**先使用预处理算法,比如:直方图规定化的方法对图像做出修正与增强, 再利用中值滤波的方法消除图像孤立的噪声点;Canny算子快速分辨出瑕疵位置, 再利用采用Otsu阈值方法求取自适应阈值自动选择并提取瑕疵。
import cv2
from PIL import Image
#读取彩色图像
color_img = cv2.imread(r'./data/Tianchi_metal_defect.png')
#在窗口中显示图像,该窗口和图像的原始大小自适应
cv2.imshow('original image',color_img)
#cvtColor的第一个参数是处理的图像,第二个是RGB2GRAY
gray_img=cv2.cvtColor(color_img,cv2.COLOR_RGB2GRAY)
#gray_img此时还是二维矩阵表示,所以要实现array到image的转换
gray=Image.fromarray(gray_img)
#将图片保存到当前路径下,参数为保存的文件名
gray.save('Tianchi_metal_defect_OTSU.jpg')
# Apply OTSU thresholding
_, binary_image = cv2.threshold(gray_img, 0, 255, cv2.THRESH_BINARY + cv2.THRESH_OTSU)

# Display the results
cv2.imshow('Binary Image', binary_image)
cv2.imshow('Gray Image',gray_img)
#如果想让窗口持久停留,需要使用该函数
cv2.waitKey(0)
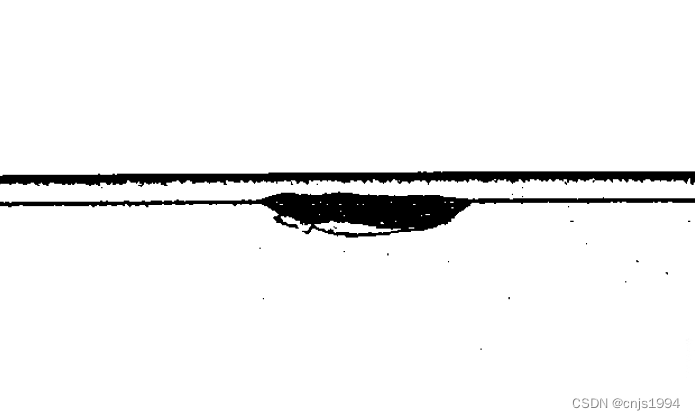
3.2 测试效果
二值化就是在灰度图的基础上,将像素转换为0、1两种值,呈现为黑、白两种简单色。
后记
更多关于计算机视觉和图像处理的内容请关注本人主页*,或者直接阅读**专栏-计算机视觉 - Opencv 强化学习等的 趣味小实验**
本博客和专栏将持续更新此方面的相关内容,感谢支持~🌹🌹🌹
参考文献资料
【1】官网-东北大学-钢材表面缺陷数据集
【2】天池-铝型材表面缺陷数据集
【3】综述论文-Machine vision based condition monitoring and fault diagnosis of machine tools using information from machined surface texture: A review


![[RocketMQ] Broker CommitLogDispatcher 异步构建ConsumeQueue和IndexFile源码解析 (十四)](https://img-blog.csdnimg.cn/5390a81d646040c9996c093700e7fa86.png)


