gnuplot命令行绘图工具命令
绘图示例预览
gnuplot工具非常强大,可以在命令行进行曲线绘图,当然也可以在UI界面绘图。
绘图命令:
gnuplot> plot 'test.csv' u ($0):1 w lp t 'c1', 'test.csv' u ($0):2 w lp t 'c2'
绘图效果:
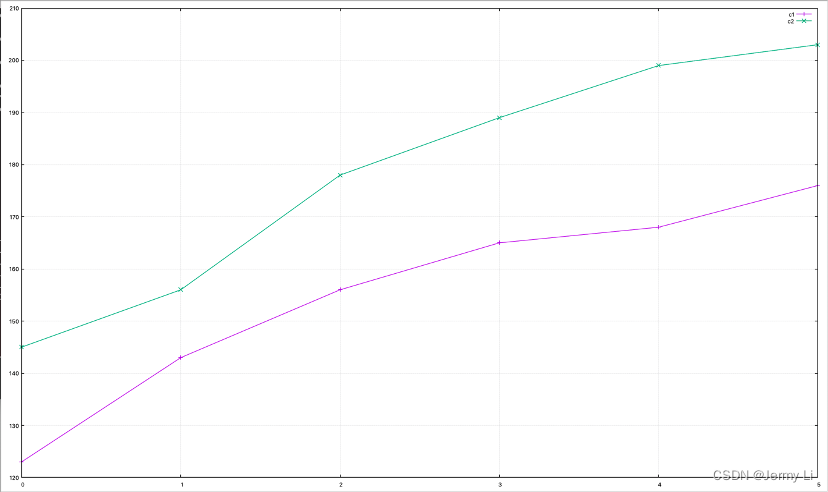
数据文件:
123 145
143 156
156 178
165 189
168 199
176 203
gnuplot常用命令
准备
安装gnuplot
$ brew install gnuplot
==> Installing dependencies for gnuplot: libpng, freetype, fontconfig, jpeg-turbo, brotli, giflib, imath, openexr, libtiff, webp, jpeg-xl, libvmaf, aom, libavif, gd, libcerf, lua, gettext, pcre2, glib, libpthread-stubs, xorgproto, libxau, libxdmcp, libxcb, libx11, libxext, libxrender, lzo, pixman, cairo, fribidi, graphite2, harfbuzz, pango and qt@5
==> Installing gnuplot dependency: libpng
==> Pouring libpng--1.6.38.arm64_monterey.bottle.tar.gz
...
==> Running `brew cleanup gnuplot`...
Disable this behaviour by setting HOMEBREW_NO_INSTALL_CLEANUP.
Hide these hints with HOMEBREW_NO_ENV_HINTS (see `man brew`).
启动
$ gnuplot

        G N U P L O T
        Version 5.4 patchlevel 4    last modified 2022-07-10

        Copyright (C) 1986-1993, 1998, 2004, 2007-2022
        Thomas Williams, Colin Kelley and many others

        gnuplot home:     http://www.gnuplot.info
        faq, bugs, etc:   type "help FAQ"
        immediate help:   type "help"  (plot window: hit 'h')

Terminal type is now 'qt'
gnuplot>
退出绘图模式
gnuplot> q
直接执行命令
gnuplot -e "set term dumb; plot 'test.csv';"
gnuplot -e 'set term dumb; plot "test.csv" u ($0):1 w lp t "c1", "test.csv" u ($0):2 w lp t "c2";'
查看帮助文档
 gnuplot --help
 gnuplot> h plot
 Syntax:
       plot {<ranges>} <plot-element> {, <plot-element>, <plot-element>}
 <press enter to exit>
切换输出模式
gnuplot> set term qt
gnuplot> set term dumb
执行shell命令
gnuplot> !cat text2.csv
采用缩写形式
u using
w with
lp linespoints
h help
绘图
设置图例名称
gnuplot> plot 'test.csv' title 'c1'
选取数据列绘图
gnuplot> plot 'test.csv' using 1:2
gnuplot> plot 'test.csv' using 1:2, 'test.csv' using 1:3
选择线条风格
gnuplot> plot 'test.csv' with lines
gnuplot> plot 'test.csv' with linespoints
gnuplot> plot 'test.csv' with points
使用行号作为横轴
gnuplot> plot 'test.csv' using ($0):1, 'test.csv' using ($0):2
设置
设置标题
gnuplot> set title 'Test Title'
gnuplot> set xlabel 'Times'
gnuplot> set ylabel 'Cost/ms'
设置注释箭头
gnuplot> set arrow 1 from 1,200 to 0.2,208
gnuplot> show arrow

        arrow 1, head nofilled back linewidth 1.000 dashtype solid
          from (1.00000, 200.000, 0.00000) to (0.00000, 208.000, 0.00000)
设置注释图例
set key at 2, 0.5
设置注释文本
set label "y=x" at 0, 208
参考文档
gnuplot使用文档
• http://www.gnuplot.info/
• https://alvinalexander.com/technology/gnuplot-charts-graphs-examples/
• https://stackoverflow.com/questions/50309923/plot-a-single-column-data-with-different-scale-on-the-horizontal-axis-in-gnuplot
• https://blog.csdn.net/qq_33523925/article/details/88219854
• https://www.cnblogs.com/xueqiuqiu/articles/12919148.html
matplotlib/pyplot使用文档
• https://stackoverflow.com/questions/911655/gnuplot-vs-matplotlib
• https://blog.csdn.net/pipisorry/article/details/37742423

