目录
补充实验-TCA+SVM置信区间
成功运行代码
误差棒图
置信区间与泛化性的关系
置信区间的计算公式
分类精度的置信区间
F1的置信区间
误差棒图
show confidence intervals for the prediction accuracy
补充实验-TCA+SVM置信区间
AUC的置信区间参考:
https://blog.csdn.net/coldLight1/article/details/124867858
python库参考:
https://github.com/mateuszbuda/ml-stat-util
可以看出不需要每个采样重新训练模型.
其中examples.ipynb给出了一个例子.
核心用法(Evaluate a model with 95% confidence interval):
| from sklearn.metrics import roc_auc_score import stat_util score, ci_lower, ci_upper, scores = stat_util.score_ci( y_true, y_pred, score_fun=roc_auc_score ) |
成功啦:
| score, ci_lower, ci_upper, scores = stat_util.score_ci( y_test_true, y_test_pred, score_fun=roc_auc_score ) print("roc_auc_score为:", score, "其95%置信区间为:",ci_lower,"-", ci_upper) print("采样scores:", scores) |
| roc_auc_score为: 0.8333333333333333 其95%置信区间为: 0.71875-0.9411764705882353 采样scores: [0.8947368421052632, 0.8333333333333333, ..., 0.91176470588235 |
源码阅读:
| Compute confidence interval for given score function based on labels and predictions using bootstrapping. 使用bootstrapping根据标签和预测计算给定评分函数的置信区间。 :param y_true: 1D list or array of labels. :param y_pred: 1D list or array of predictions corresponding to elements in y_true. :param score_fun: Score function for which confidence interval is computed. (e.g. sklearn.metrics.accuracy_score) :param sample_weight: 1D list or array of sample weights to pass to score_fun, see e.g. sklearn.metrics.roc_auc_score. :param n_bootstraps: The number of bootstraps. (default: 2000) :param confidence_level: Confidence level for computing confidence interval. (default: 0.95) :param seed: Random seed for reproducibility. (default: None) :param reject_one_class_samples: Whether to reject bootstrapped samples with only one label. For scores like AUC we need at least one positive and one negative sample. (default: True) :return: Score evaluated on labels and predictions, lower confidence interval, upper confidence interval, array of bootstrapped scores. :param y_true: 一维列表或标签数组。 :param y_pred:与 y_true 中的元素对应的一维预测列表或数组。 :param score_fun:计算置信区间的得分函数。 (例如 sklearn.metrics.accuracy_score) :param sample_weight:要传递给 score_fun 的一维列表或样本权重数组,请参见例如 sklearn.metrics.roc_auc_score。 :param n_bootstraps: 引导次数。 (默认值:2000) :param confidence_level:计算置信区间的置信水平。 (默认值:0.95) :param seed: 可重复性的随机种子。 (默认值:无) :param reject_one_class_samples: 是否拒绝只有一个标签的自举样本。 对于像 AUC 这样的分数,我们至少需要一个正样本和一个负样本。 (默认值:真) :return: 根据标签和预测评估的分数、置信区间下限、置信区间上限、自举分数数组。 |
其中给的例子还有作图和标准输出格式
| bins = plt.hist(scores) plt.plot([score, score], [0, np.max(bins[0])], color="tomato") plt.plot([ci_lower, ci_lower], [0, np.max(bins[0])], color="lime") plt.plot([ci_upper, ci_upper], [0, np.max(bins[0])], color="lime") print("AUC={:.2f}, 95% CI: {:.2f}-{:.2f}".format(score, ci_lower, ci_upper)) |

其中主要源码
| scores = [] for i in range(n_bootstraps): readers = np.random.randint(0, len(y_preds), len(y_preds)) indices = np.random.randint(0, len(y_true), len(y_true)) if reject_one_class_samples and len(np.unique(y_true[indices])) < 2: continue reader_scores = [] for r in readers: reader_scores.append(score_fun(y_true[indices], y_preds[r][indices])) scores.append(stat_fun(reader_scores)) mean_score = np.mean(scores) sorted_scores = np.array(sorted(scores)) alpha = (1.0 - confidence_level) / 2.0 ci_lower = sorted_scores[int(round(alpha * len(sorted_scores)))] ci_upper = sorted_scores[int(round((1.0 - alpha) * len(sorted_scores)))] return mean_score, ci_lower, ci_upper, scores |
这段代码计算了准确率的置信区间,其中:
- n_bootstraps是bootstrap的迭代次数,即从原始数据中重复抽样的次数。通常建议将其设置为原始数据集的大小。每次抽样抽出的样本个数与原数据集个数len(y_true)相同.
- y_true是真实标签,y_preds是模型预测的标签。其中y_preds为y_pred组成的数组, 当只有一个reader时为[[1,0,...,1,0]]
- score_fun是用于计算单个bootstrap样本的性能指标,例如准确率、F1分数、精确度或召回率。
- stat_fun是用于计算所有bootstrap样本的性能指标统计量,例如平均值或中位数。
- confidence_level是置信水平,通常取值为0.95或0.99。
代码的主要步骤如下:
1. 通过n_bootstraps次随机重复抽样,生成n_bootstraps个bootstrap样本。
2. 对于每个bootstrap样本,随机选择一组读者,并使用score_fun计算该组读者的性能指标(默认取mean)。
3. 使用stat_fun计算所有bootstrap样本的性能指标统计量。
4. 根据置信水平和排好序的性能指标列表,计算置信区间的上限和下限。
具体地说,代码中使用alpha = (1.0 - confidence_level) / 2.0计算置信区间的两侧的alpha值。然后,sorted_scores = np.array(sorted(scores))将所有bootstrap样本的性能指标排序,并将其存储在一个数组中。最后,ci_lower和ci_upper分别设置为排名为alpha * len(sorted_scores)和(1 - alpha) * len(sorted_scores)的性能指标。
2) chatgpt给出的置信区间计算代码有问题, 算出来都是同一个值
| c
|
成功运行代码
class_imbalance_SVM_CI.py
| #####################CI############################## score, ci_lower, ci_upper, scores = stat_util.score_ci( yt_test_fold, y_pred, score_fun=f1_score, seed=0 ) CI_f1[fold_count][0]=score CI_f1[fold_count][1]=ci_lower CI_f1[fold_count][2]=ci_upper
score, ci_lower, ci_upper, scores = stat_util.score_ci( yt_test_fold, y_pred, score_fun=accuracy_score, seed=0 ) print("ACC={:.2f}, 95% CI: {:.2f}-{:.2f}".format(score, ci_lower, ci_upper)) CI_ACC[fold_count][0]=score CI_ACC[fold_count][1]=ci_lower CI_ACC[fold_count][2]=ci_upper |
| CI_f1 = pd.DataFrame(CI_f1) CI_ACC = pd.DataFrame(CI_ACC) CI_f1.columns = ['F1','ci_lower','ci_upper'] CI_ACC.columns = ['ACC','ci_lower','ci_upper'] CI_f1.to_csv('./data/CI/{}_{}_F1_TCA+SVM_ROS_CI.csv'.format(curtime,y_columns[label_idx]), index=False) CI_ACC.to_csv('./data/CI/{}_{}_ACC_TCA+SVM_ROS_CI.csv'.format(curtime,y_columns[label_idx]), index=False) |
直方图
| plt.figure() bins = plt.hist(scores) plt.plot([score, score], [0, np.max(bins[0])], color="tomato") plt.plot([ci_lower, ci_lower], [0, np.max(bins[0])], color="lime") plt.plot([ci_upper, ci_upper], [0, np.max(bins[0])], color="lime") plt.title('Histogram of {} Accuracy'.format(y_columns[label_idx])) # 设置标题 plt.xlabel('Accuracy') plt.ylabel('Frequency') plt.legend(loc='upper left') plt.savefig("./fig/CI/{} ACC_CI{}.png".format(y_columns[label_idx],fold_count)) |
误差棒图
我的成功小demo

| x=["A","B","C"] y=[80,90,100] dy=[[1,5,1],[1,1,1]] plt.errorbar(x,y,yerr=dy,fmt='o',ecolor='r',color='b',elinewidth=2,capsize=4) #fmt : 'o' ',' '.' 'x' '+' 'v' '^' '<' '>' 's' 'd' 'p' plt.show() |
其中dy的两行分别代表向下的误差和向上的误差.
| 86.12,79.05, 97.18,94.83,89.64,99.29,98.82,100.00,99.77 5.88,6.82, 2.82,4.00,5.18,1.18,1.41,0.00,0.47 5.18,6.59, 2.12,3.06,4.71,0.71,0.94,0.00,0.23 |
| x=label_list y=[86.12,79.05, 97.18,94.83,89.64,99.29,98.82,100.00,99.77] dy=[[5.88,6.82, 2.82,4.00,5.18,1.18,1.41,0.00,0.47],[5.18,6.59, 2.12,3.06,4.71,0.71,0.94,0.00,0.23]] plt.errorbar(x,y,yerr=dy,fmt='o',ecolor='r',color='b',elinewidth=2,capsize=4) # 图片设置 # # 图片大小 # plt.figure(figsize=(0.9 * max_display + 1, 0.8* max_display + 1)) # # 添加数值标签 # for i, v in enumerate(y_values): # plt.text(i, v+0.02*y_max , str("%.3f" %v), ha='center') #调整 图表 的上下左右 plt.subplots_adjust(bottom=0.45) # 添加y轴标签 plt.ylabel('Accuracy(%)') plt.xticks(rotation=90) # plt.show() plt.savefig("./fig/CI/ACC_CI.pdf") |
Upper and lower 97.5 % confidence limits
Coverage of standard 95% confidence intervals.
其它论文表述置信区间例子:
the DSS model achieved an AUC of 0.8172 (95% confidence interval, 0.8124–0.8219), indicating that our model outperforms the conventional radiomics-based AI models and is more competitive.
The similarity has been further determined by means of the Dice coefficient [27] (DSC) with its 95% confidence intervals [28] (Table 5). These statistics show that the most substantial resemblance is within the genes differentially expressed in ALL and CLL, although a powerful similarity is also present between the AML and ALL groups. The least important closeness may be seen in the case of each main leukaemia group when compared to MDS. Detailed analysis of DSC values between MDS and leukaemia types reveals that MDS is the most similar to AML in systemic response to disease, having significantly the highest value of Dice similarity coefficients (0.259; 95%
CI from 0.245 to 0.272), which is in compliance with the findings of other authors [29].
通过骰子系数[27](DSC)及其95%置信区间[28]进一步确定了相似性(表5)。这些统计数据表明,最实质性的相似性是在ALL和CLL中差异表达的基因内,尽管AML和ALL组之间也存在很强的相似性。与MDS相比,在每个主要白血病组的病例中都可以看到最不重要的亲密关系。对MDS和白血病类型之间DSC值的详细分析表明,MDS在对疾病的全身反应中与AML最相似,具有显着最高的Dice相似系数值(0.259;\(95\%\)CI从0.245到0.272),这符合其他作者的发现
Two of these features were common and the remaining were correlated with effect size at least at a medium level. the results are on a similar level.
此外,总体加权平均灵敏度95%
置信区间如表11所示。很明显,通过建议的分析管道选择的特征比使用前 100 DEG 原始方法选择的特征具有更高的平均特异性。
The consistency of the experimental and theoretical values was determined by calculating R2 values of each protein segment. The R2 values of the two segments are significant (Table 1 and Figs. 4(a)- 4(d)). The R2 values of similarity and GD of the two segments obtained from these experiments are shared common values (Table 1). In addition to confirming the result, the variance analysis (ANOVA) was performed at 95% confidence interval. Here the values of ‘Prob>F’ was less than 0.0500 indicating model terms are significant. It is shown in Table 1 that the two protein segments show values of < 0.0001, which is statistically significant. It should be noted that the perfect consistency is observed between the experimental and theoretical values. It shows that the experimental values obtained from ClustalW (similarity) and MEGA4.1 (GD) are acceptable
通过计算每个蛋白质片段的R2值来确定实验值和理论值的一致性。这两个片段的R2值是显著的(见表1和图4(a)-4(d))。这些实验得到的两个片段的相似性和GD的R2值相同(见表1)。除了确认结果外,还进行了95%置信区间的方差分析(ANOVA)。在这里,“Prob>F”值小于0.0500,表明模型项是显著的。表1显示,这两个蛋白质片段的值小于0.0001,具有统计学意义。值得注意的是,实验值和理论值之间存在完美的一致性。这表明从ClustalW(相似性)和MEGA4.1(GD)获得的实验值是可接受的。


Using disease prevalence of 3 and 50 per cent, estimates of PPV and NPV, their 95 per cent
confidence intervals and interval lengths were calculated using the four described methods. These results are summarized in Table IX.
The standard methods, both transformed and untransformed, usually produced a larger estimate than their adjusted counterparts. These differences were remarkably small, <1 per cent, and did not have a significant effect on the overall interval length (Table IX). The point estimates of NPV were 98 per cent when the prevalence was 3 per cent, thus indicating if a patient tested negative for the ApoE.e4 gene, then the investigators were almost certain that the patient did not have AD. As the prevalence increased to 50 per cent, then the NPV estimate decreased to 64 per cent while the PPV estimate increased from 7 to 71 per cent. Regardless of the estimation method, similar intervals were obtained, which results from the large sample size.
标准方法,无论是转换的还是未转换的,通常比调整后的方法产生更大的估计。这些差异非常小,< 1%,并且对总体间隔长度没有显著影响(表9)。当患病率为3%时,NPV的点估计值为98%,从而表明患者是否检测出ApoE阴性。e4基因,那么研究人员几乎可以肯定病人没有阿尔茨海默病。
当患病率增加到50%时,NPV估计值下降到64%,而PPV估计值从7%增加到71%。无论采用哪种估计方法,都获得了相似的区间,这是由于样本量大。
这段话是在描述一项研究的结果。这项研究可能是关于某种疾病的诊断方法,其中使用了一种名为"ApoE.e4 gene"的基因检测。以下是对这段话中使用的技术术语的解释:
- "standard methods":指一种常规的统计分析方法,可能包括将数据进行转换以使其符合分析要求。
- "transformed and untransformed":指对数据进行转换或不转换的两种不同方法。
- "adjusted counterparts":指对数据进行了调整以考虑其他因素的方法。
- "point estimates":指对某个参数(在这里是NPV)的单个值估计。
- "NPV":指负预测值(Negative Predictive Value),即测试结果为阴性时,被检测者实际上不患病的概率。
- "PPV":指阳性预测值(Positive Predictive Value),即测试结果为阳性时,被检测者实际上患病的概率。
- "interval length":指估计值与真实值之间的差距,通常用置信区间来表示。
- "prevalence":指在人群中患有某种疾病或基因的比例。
- "large sample size":指样本容量较大,通常会导致更准确的估计结果。
总体来说,这段话描述了不同方法估计 NPV 和 PPV 的结果,并说明了这些结果如何随着患病率的变化而变化。此外,由于样本容量较大,使用不同方法得到的估计值之间的差异非常小。
这段话描述了一项研究的结果。该研究可能涉及某种疾病的诊断方法,其中使用了一种名为"ApoE.e4 gene"的基因检测。研究发现,标准方法和经过转换的方法通常会产生比经过调整的方法更大的估计值。这些差异非常小,小于1%,并且对总体区间长度没有显著影响(见第九张表)。当患病率为3%时,NPV的点估计为98%,这意味着如果患者的ApoE.e4基因检测结果为阴性,则调查人员几乎可以确定该患者没有患阿尔茨海默病。随着患病率增加到50%,NPV估计值下降到64%,而PPV估计值从7%增加到71%。无论使用哪种估计方法,都可以得到类似的区间,这是由于样本量很大。
置信区间与泛化性的关系
参考:
https://machinelearningmastery.com/confidence-intervals-for-machine-learning/
中文翻译版
https://www.jiqizhixin.com/articles/2018-07-06-5
估计某个算法在未知数据上的性能。
任意总体统计的置信区间都可以用bootstrap以一种分布无关法(distribution-free)进行估计
置信区间是一个范围的可能性。 真正的模型性能可能在这个范围之外。
置信区间属于称为估计统计(estimation statistics)的统计学领域,估计统计用于表示和解释实验结果,可以替代或补充统计显著性检验
置信区间是一种对估计不确定性的量化方法,它们可以用来在总体参数(例如平均值mean,就是从总体中的一个独立观测样本上估计而来)上添加一个界限或者可能性。
例如,置信区间可以用来呈现分类模型的性能,可以这样描述:给定样本,范围x到y覆盖真实模型精度的可能性为95%。或者,在95%的置信水平下,模型精度是x+/-y。
置信区间也能在回归预测模型中用于呈现误差,例如:范围x到y覆盖模型真实误差的可能性有95%。或者,在95%的置信水平下,模型误差是x+/-y。
选择95%的置信度在展现置信区间时很常见,但是其他不那么常见的值也会被使用,比如90%和99.7%。实践中,你可以使用任何喜欢的值
作为单独的半径测量,置信区间通常被称为误差范围,并可通过使用误差图来图形化地表示估计的不确定性。
更小的置信区间:更精确的估计
更大的置信区间:不太精确的估计
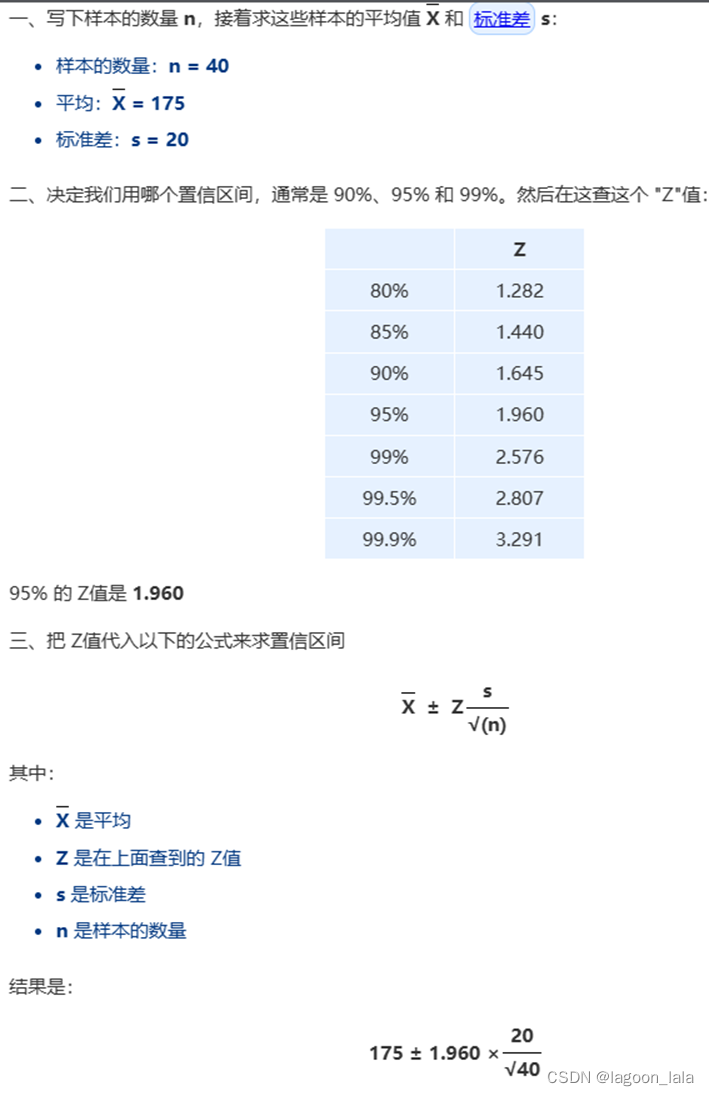
置信区间的计算公式
https://www.shuxuele.com/data/confidence-interval.html
这是在高斯/正态分布下的公式, 当抽样次数足够多时, 可以近似为正态分布
分类精度的置信区间
confidence intervals for the prediction accuracy
其中accuracy = total correct predictions / total predictions made * 100
该准确率可以用模型从未见过的数据集计算,例如验证集或测试集。
我们可以使用比例(即分类准确度或误差)的高斯分布假设来轻松地计算置信区间。
在分类误差的情况下,区间半径可以这样计算:
interval = z * sqrt( (error * (1 - error)) / n)
在分类准确率的情况,这样计算:
interval = z * sqrt( (accuracy * (1 - accuracy)) / n)
公式中的interval是置信区间的半径,error和accuracy是分类误差和分类准确率,n是样本大小,sqrt是平方根函数,z是高斯分布的临界值。用术语表述,这就是二项式比例置信区间。
高斯分布中常用的临界值及其相应的显着性水平如下:
1.64(90%)
1.96(95%)
2.33(98%)
2.58(99%)
| 下面的例子在假设的情况下演示了这个函数,其中一个模型从100个实例的数据集中做出88个正确的预测,并且我们对95%的置信区间(作为0.05的显著性供给函数)感兴趣。 from statsmodels.stats.proportion import proportion_confint lower, upper = proportion_confint(88, 100, 0.05) print('lower=%.3f, upper=%.3f' % (lower, upper)) 运行示例输出模型分类准确率的上下界: lower=0.816, upper=0.944 |
F1的置信区间
参考如何在 Python 中计算置信区间
https://www.geeksforgeeks.org/how-to-calculate-confidence-intervals-in-python/
按照惯例,confidence_level通常应设置为 .95。值越高, 置信区间越宽。
在总体中所有标记的数据点都已修正(即已标记)的情况下, 您可以在实例化期间提供exact_precision值;否则,置信区间 还将创建精度。总体中并非所有标记的数据点的情况 修正是指标记的项目总数太大且只有一个子集 其中已得到补救。
您的样本数量应足够大,以使置信区间变窄。
参考论文:
Confidence Intervals for Random Forests in Python
Estimating confidence intervals on accuracy in classification in machine learning
详细的直方图+置信区间
https://towardsdatascience.com/get-confidence-intervals-for-any-model-performance-metrics-in-machine-learning-f9e72a3becb2
参考二元分类置信区间:
https://stats.stackexchange.com/questions/260068/confidence-interval-binary-classification
绘制输入数据的随机样本,训练模型并计算误差(准确性、精度、马修斯系数等)。重复此过程 N 次,然后从输出分布误差中可以轻松提取置信区间。
对受试者的预测求平均值是不正确的。 决定使用自举来计算 p 值并比较模型。
| For N iterations: sample 5 subjects with replacement sample 100 test cases with replacement compute mean performance of sampled subjects on sampled cases for model M1 compute mean performance of sampled subjects on sampled cases for model M2 take the difference of mean performance between M1 and M2 p-value equals to the proportion of differences smaller or equal than 0 |
误差棒图
(线段图)
参考中文:
https://www.cnblogs.com/shona/p/12201313.html
| import matplotlib.pyplot as plt import numpy as np x_ticks = ("Thing 1", "Thing 2", "Other thing", "Yet another thing") x_1 = np.arange(1, 5) x_2 = x_1 + 0.1 y_1 = np.random.choice(np.arange(1, 7, 0.1), 4) y_2 = np.random.choice(np.arange(1, 7, 0.1), 4)#numpy.random.choice(a, size=None, replace=True, p=None) err_1 = np.random.choice(np.arange(0.5, 3, 0.1), 4) err_2 = np.random.choice(np.arange(0.5, 3, 0.1), 4) # 绘制置信区间图 plt.errorbar(x=x_1, y=y_1, yerr=err_1, color="black", capsize=3, linestyle="None", marker="s", markersize=7, mfc="black", mec="black") plt.errorbar(x=x_2, y=y_2, yerr=err_2, color="gray", capsize=3, linestyle="None", marker="s", markersize=7, mfc="gray", mec="gray") plt.xticks(x_1, x_ticks, rotation=90) plt.tight_layout() plt.show() |
彩色
https://blog.csdn.net/The_lastest/article/details/79829046
| import matplotlib.pyplot as plt import numpy as np x=np.linspace(1,10,20) dy=np.random.rand(20) y=np.sin(x)*3 plt.errorbar(x,y,yerr=dy,fmt='o',ecolor='r',color='b',elinewidth=2,capsize=4) #fmt : 'o' ',' '.' 'x' '+' 'v' '^' '<' '>' 's' 'd' 'p' plt.show() |
英文
条形图+线段
https://python-graph-gallery.com/8-add-confidence-interval-on-barplot/
箱线图
https://python-graph-gallery.com/boxplot/
置信区间误差线
| plot_errorbars("ci", n_boot=5000, seed=10) |
| def plot_errorbars(arg, **kws): np.random.seed(sum(map(ord, "error_bars"))) x = np.random.normal(0, 1, 100) f, axs = plt.subplots(2, figsize=(7, 2), sharex=True, layout="tight") sns.pointplot(x=x, errorbar=arg, **kws, capsize=.3, ax=axs[0]) sns.stripplot(x=x, jitter=.3, ax=axs[1]) |
https://seaborn.pydata.org/tutorial/error_bars.html
matplotlib误差线中包含不同的上限和下限
https://matplotlib.org/stable/gallery/statistics/errorbar_limits.html
| import numpy as np import matplotlib.pyplot as plt # example data x = np.arange(0.1, 4, 0.5) y = np.exp(-x) # example error bar values that vary with x-position error = 0.1 + 0.2 * x fig, (ax0, ax1) = plt.subplots(nrows=2, sharex=True) ax0.errorbar(x, y, yerr=error, fmt='-o') ax0.set_title('variable, symmetric error') # error bar values w/ different -/+ errors that # also vary with the x-position lower_error = 0.4 * error upper_error = error asymmetric_error = [lower_error, upper_error] ax1.errorbar(x, y, xerr=asymmetric_error, fmt='o') ax1.set_title('variable, asymmetric error') ax1.set_yscale('log') plt.show() |

