示例:
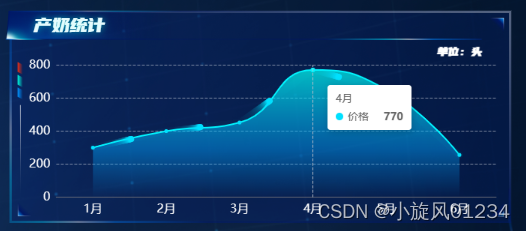
说明:
因为现在公司经常要做大屏可视化特效,没办法,只能让图尽量动起来(之前开会挨叼了,说俺们深圳做的,不能比西安那些人做的差。。。)
主要代码:
折线图的滚呀滚特效(ts的,改成js把: Object和 as any[]两个删了就行了):
let animationChart = (option: Object) => {
  // 动画
  let lowLine = [] as any[];
  var zrUtil = echarts.util;

  if (xData.length > 0) {
    // console.log(xData, sData);
    lowLine = [];

    zrUtil.each(xData, function (item, index) {
      lowLine.push([
        {
          coord: [index, sData[index]],
        },
        {
          coord: [index + 1, sData[index + 1]],
        },
      ]);
    });
  }
  if (option.series.length > 1) {
    option.series[1] = {
      name: "出栏总数",
      type: "lines",
      coordinateSystem: "cartesian2d",
      zlevel: 1,
      smooth: true,
      symbol: "circle",
      effect: {
        show: true,
        smooth: true,
        period: 2,
        symbolSize: 8,
      },
      lineStyle: {
        normal: {
          color: "#00E0FF",
          width: 0,
          opacity: 0,
          curveness: 0,
        },
      },
      data: lowLine,
    };
  } else {
    option.series.push({
      name: "出栏总数",
      type: "lines",
      coordinateSystem: "cartesian2d",
      zlevel: 1,
      smooth: true,
      symbol: "circle",
      effect: {
        show: true,
        smooth: true,
        period: 2,
        symbolSize: 8,
      },
      lineStyle: {
        normal: {
          color: "#00E0FF",
          width: 0,
          opacity: 0,
          curveness: 0,
        },
      },
      data: lowLine,
    });
  }
  // 动画结束
};
使用:(加在Chart.setOption,生成折线图前)
  if (!myChart) {
    myChart = echarts.init(echartsRef.value);
  }
  let option = getOptions();
  animationChart(option);
  myChart.setOption(option);
隔几秒高亮特效:
  let app = {
    currentIndex: -1,
  };
  setInterval(function () {
    let dataLen = option.series[0].data.length;
    // 取消之前高亮的图形
    myChart.dispatchAction({
      type: "downplay",
      seriesIndex: 0,
      dataIndex: app.currentIndex,
    });
    app.currentIndex = (app.currentIndex + 1) % dataLen;
    console.log(app.currentIndex);
    // 高亮当前图形
    myChart.dispatchAction({
      type: "highlight",
      seriesIndex: 0,
      dataIndex: app.currentIndex,
    });
    // 显示 tooltip
    myChart.dispatchAction({
      type: "showTip",
      seriesIndex: 0,
      dataIndex: app.currentIndex,
    });
  }, 1000 * 10);
使用:
这个放在Chart.setOption后,就是生成图表后面


