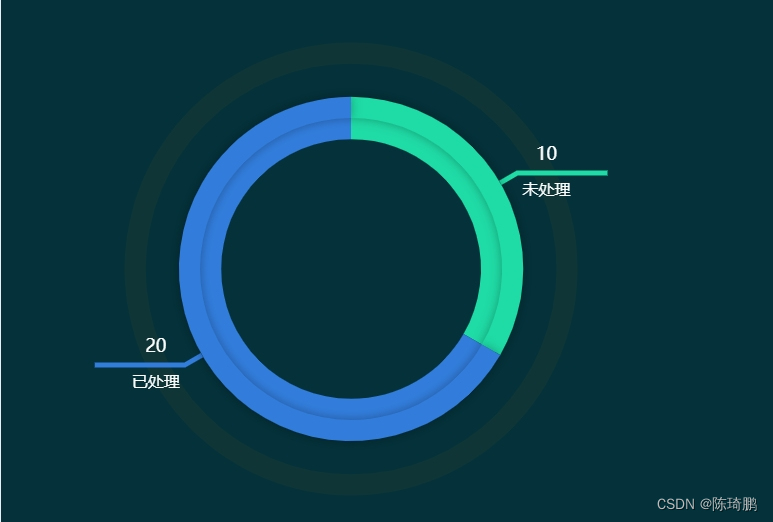
在公司客户端项目开发中,用来区分已处理与未处理两个状态的双层饼图,以下是项目案例:
下载Echarts
//npm
npm install echarts --save

//淘宝镜像cnpm(安装速度快)
cnpm install echarts --save

//yarn
yarn add echarts
代码示例
<template>
    <div id="echartsTwo" style="width: 100%;height: 100%;"></div>
</template>

<script setup>
    import * as echarts from 'echarts';
    import { onMounted,ref } from 'vue';
    onMounted(()=>{
        getEcharts();
    })
    const getEcharts = () => {
        let chartDom = document.getElementById("echartsTwo");
        let myChart = echarts.init(chartDom);
        let option = {
      	    backgroundColor: "#04313a",
      	    series: [{
      			name: '',
      			type: 'pie',
      			zlevel: 2,
      			radius: ['43%', '55%'],
      			center: ['45%', '50%'],
      			color: [
      				'#1fdba5',
      				'#327ddc',
      			],
      			label: {
      				show: false,
      			},
      			labelLine: {
      				show: false,
      			},
      			tooltip: {
      				show: false,
      			},
      			data: [{
      					name: "未处理",
      					value: 10
      				},
      				{
      					name: "已处理",
      					value: 20
      				},
      			]
      		},
      		{
      			name: 'title',
      			type: 'pie',
      			zlevel: 3,
      			hoverAnimation: false,
      			legendHoverLink: false,
      			radius: ['50%', '57%'],
      			center: ['45%', '50%'],
      			color: [
      				'#1dd898',
      				'#3367da',
      			],
      			label: {
      				show: true,
      				formatter: '{cc|{c}}\n{bb|{b}}',
      				rich: {
      					bb: {
      						align: "center",
      						fontSize: 16,
      					},
      					cc: {
      						align: "center",
      						fontSize: 18,
      					}
      				},
      				padding: [0, -90],
      				textStyle: {
      					lineHeight: 35,
      					color: "#fff"
      				}
      			},
      			labelLine: {
      				show: true,
      				// showAbove:true,
      				length: 20,
      				length2: 90,
      				lineStyle: {
      					width: 5
      				}

      			},
      			itemStyle: {
      				shadowBlur: 10,
      				shadowColor: 'rgba(0, 0, 0, 0.3)',
      			},
      			data: [{
      					name: "未处理",
      					value: 10
      				},
      				{
      					name: "已处理",
      					value: 20
      				},
      			]
      		},
      		{
      			name: '外边框',
      			type: 'pie',
      			clockWise: false, //顺时加载
      			hoverAnimation: false, //鼠标移入变大
      			center: ['45%', '50%'],
      			radius: ['75%', '68%'],
      			label: {
      				normal: {
      					show: false
      				}
      			},
      			data: [{
      				value: 1,
      				name: '',
      				itemStyle: {
      					normal: {
      						color: "rgba(23, 56, 52,.6)",
      						// shadowBlur: 10,
      						// shadowColor: 'rgba(22, 55, 51, .3)',
      					}
      				}
      			}]
      		}
      	],
      };
        myChart.setOption(option);
    }
</script>
运行结果
