文章目录
- 前言
- 一、定义
- 二、Tips
- 1.常用方法
- 2. 常用module
- statistics 统计分析常用模块
- SciPy 算法及统计分析库
- 总结
前言
本文用来记录在使用python时一些基础的定义、基础用法或Tips。
一、定义
多变量定义:
a, b, c = 0, 0, 0
数组定义:
# 变量定义
a = []
# 作为函数参数时
a: List[int]
函数定义:
def function(a: int, b: List[int])
# 返回值 -> 跟返回变量类型
def function(self) -> bool
返回多个值,指定变量类型:
from typing import Tuple

def function(self) -> Tuple[bool, int]
类定义继承:
class Base:
	def __init__(self, name: str):
	self.print(f"class name: {name}")
	# 或如下打印形式
	# self.print("class name: {}".format(name))
class A_Base(Base):
	def __init__(self):
		# 调用父类构造
		super().__init__("Base")
		# 打印子类输出
		self.print(f"class name: A_Base")
二、Tips
1.常用方法
自加减乘除:
a = 10
# a = a + 10
a += 10
# a = a - 10
a -= 10
# a = a * 10
a *= 10
# a = a / 10
a /= 10
求解N次方:
# b = a * a
# **n是求解n次方
a = 10
b = a**2
# b = 100
开方:
from math import sqrt

a = sqrt(100)
# a = 10
取整:
>>> round(345.345)
345
>>> round(345.345,2)
345.35
>>> round(345.345,1)
345.3
>>> round(345.345,0)
345.0
>>> round(345.345,-1)
350.0
>>> round(345.345,-2)
300.0
求平均、最大、最小
# average
from statistics import mean
a = [3, 4, 5, 1, 6, 2, 9, 7, 10, 8]
b = mean(a)
# b = 5.5

# min
b = min(a)
# b = 1

# max
b = max(a)
# b = 10
2. 常用module
statistics 统计分析常用模块
- Mean 平均数
- Median 中位数
- Median Low 双数时中间两位中较小的一个,单数取中间
- Median High 双数时中间两位中较小的一个,单数取中间
- Mode 众数
import statistics
>>> statistics.mean([3, 4, 5, 1, 6, 2, 9, 7, 10, 8])
5.5
>>> statistics.median_low([1, 4, 7])
4
>>> statistics.median_low([1, 4, 7, 10])
4
>>> statistics.median_high([1, 4, 7, 10])
7
>>> statistics.mode([3, 4, 5, 1, 6, 2, 2, 9, 7, 10, 8])
2
SciPy 算法及统计分析库
SciPy 是基于Python的NumPy扩展构建的数学算法和便利函数的库1。
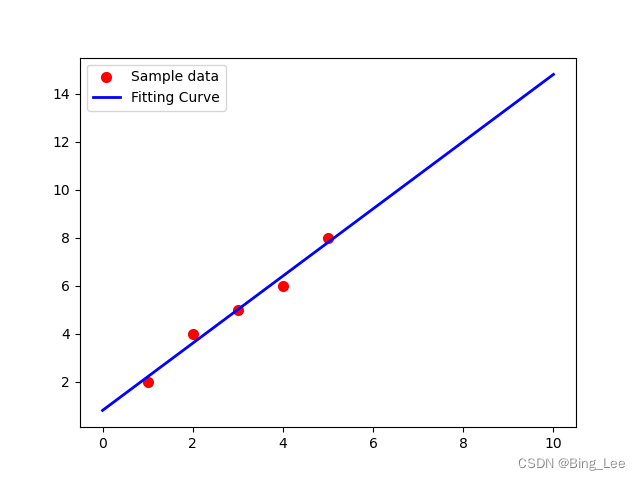
- scipy.optimize.leastsq 求解最小二乘方程
from scipy.optimize import leastsq
import numpy as np
import matplotlib.pyplot as plt

def fun(p,x):
    k,b = p
    return k*x+b

def error(p,x,y):
    return fun(p,x)-y

Xi = np.array([1,2,3,4,5])
Yi = np.array([2,4,5,6,8])

p0 = np.array([1,3])
para = leastsq(error,p0,args=(Xi,Yi))

k,b = para[0]
print(f"k = {k}, b = {b}")
plt.scatter(Xi, Yi, color='red', label='Sample data', linewidth=2)

x = np.linspace(0, 10, 5)
y = k * x + b
plt.plot(x, y, color='blue', label='Fitting Curve', linewidth=2)
plt.legend()  # 图例

plt.show() # 显示
# k = 1.4000000000008725, b = 0.799999999995201
总结
User Guide官方函数说明样例 ↩︎

