ECharts,一个使用 JavaScript 实现的开源可视化库,可以流畅的运行在 PC 和移动设备上,兼容当前绝大部分浏览器,底层依赖矢量图形库 ZRender,提供直观,交互丰富,可高度个性化定制的数据可视化图表。
ECharts的使用
安装
npm install echarts --save
使用
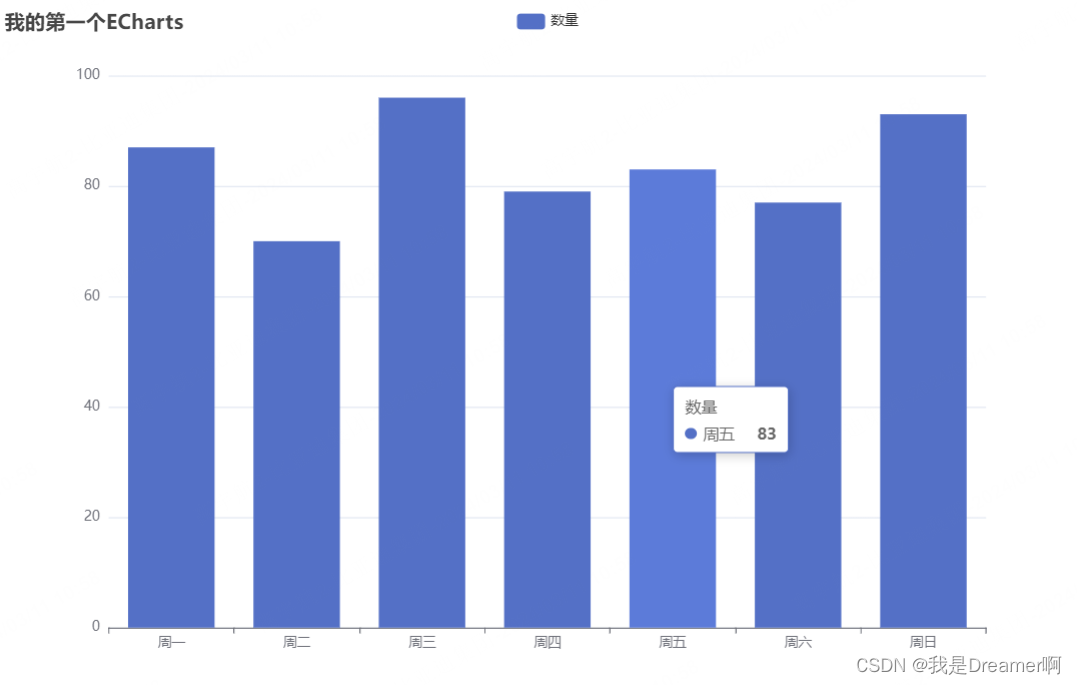
在使用时,我们需要先在HTML中为ECharts准备一个定义了宽高的区域以备存放图片
<div id="main" style="width: 300px;height:200px;"></div>
然后再javascript区域,我们需要做三件事
- 基于准备好的dom,初始化echarts实例
- 指定图表的配置项和数据
- 使用刚指定的配置项和数据显示图表。
      var myChart = echarts.init(document.getElementById('main'));
      var option = {
        title: {
          text: '我的第一个ECharts'
        },
        tooltip: {},
        legend: {
          data: ['数量']
        },
        xAxis: {
          data: ['周一', '周二', '周三', '周四', '周五', '周六','周日']
        },
        yAxis: {},
        series: [
          {
            name: '数量',
            type: 'bar',
            data: [87, 70, 96, 79, 83, 77,93]
          }
        ]
      };
      myChart.setOption(option);
这样一个简单的ECharts就做好啦。
较复杂的ECharts
ECharts中大部分的设置都可以在ECharts的配置项手册中看到,根据设置option的不同值可以生产不同的图。
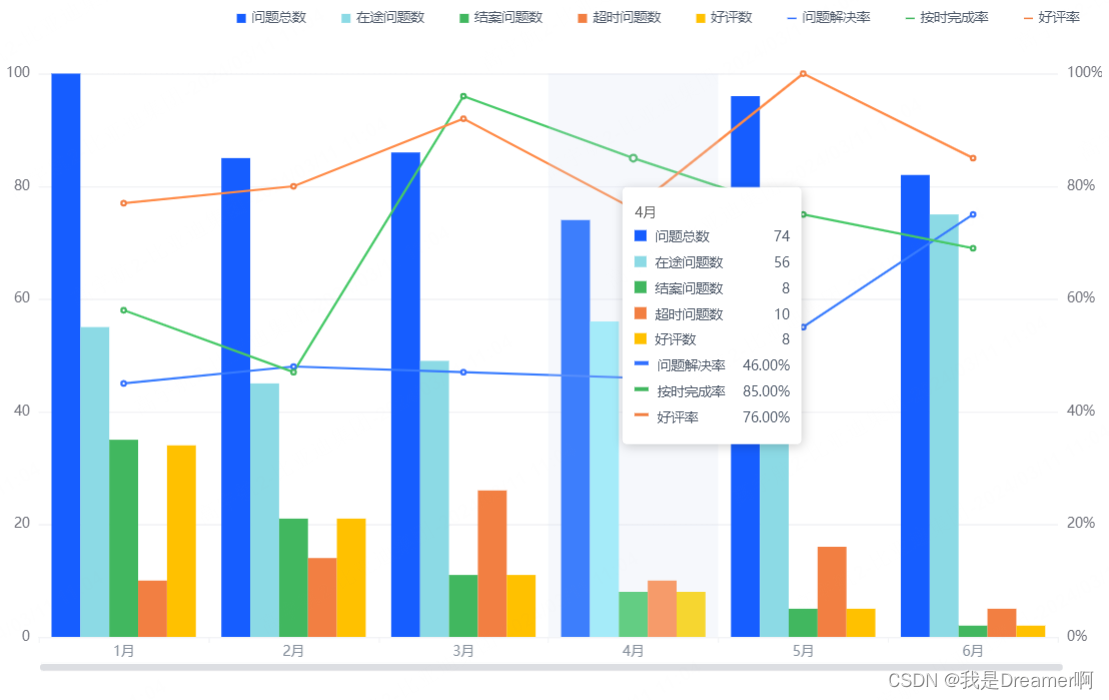
例如如下的折柱混合图(代码中增加了各个配置项的注释):
option = {
        legend: {//图例
            right: '16',//距离 右边框位置
            itemWidth: 8,//图标宽度
            itemHeight: 8,//图标大小
            itemGap: 32,
            lineStyle: {//线段类型
                type: 'solid'
            },
            data: [//图例数据
                {
                    name: '问题总数',
                    icon: 'rect'//图标形状为圆形
                },
                {
                    name: '在途问题数',
                    icon: 'rect'
                },
                {
                    name: '结案问题数',
                    icon: 'rect'
                },
                {
                    name: '超时问题数',
                    icon: 'rect'
                },
                {
                    name: '好评数',
                    icon: 'rect'
                },
                {
                    name: '问题解决率',
                    icon:
                        'path://m0.010277,5.945418l24.979446,0l0,4.109164l-24.979446,0l0,-1.109164z'//图标形状为线段
                },
                {
                    name: '按时完成率',
                    icon:
                        'path://m0.010277,5.945418l24.979446,0l0,4.109164l-24.979446,0l0,-1.109164z'
                },
                {
                    name: '好评率',
                    icon:
                        'path://m0.010277,5.945418l24.979446,0l0,4.109164l-24.979446,0l0,-1.109164z'
                }
            ],
            textStyle: {
                color: '#4E5969'//图例文字颜色
            }
        },
        tooltip: {//提示框组件
            trigger: 'axis',//触发方式--坐标轴触发,主要在柱状图,折线图等会使用类目轴的图表中使用。
            axisPointer: {//坐标轴指示器配置项。
                type: 'shadow',//类型--阴影指示器
                backgroundColor: '#F4F6F9'//阴影部分背景颜色
            },
            //提示框内容
            formatter: function(params) {
                return (
                    `<span style="font-size:12px">${params[0].axisValue}</span>`//标题
                     +
                    `<br>` +
                    params
                        .map(item => {//数据详情
                            let strVal;
                            let str = `<span style="display:inline-block;width:10px;height:10px;margin: 0 8px 0 0;
                    background-color:${item.color};"></span>`;
                            let val = item.data;
                            if (item.componentSubType == 'line') {
                                str = `<span style="display:inline-block; width: 12px;height: 3px; margin: 0 8px 5px 0;background-color: ${item.color}"></span>`;
                                val = (val * 100).toFixed(2) + '%';
                            }
                            return `<span style="display:flex; justify-content:space-between; margin-bottom: 2px;color:#4E5969;font-size:12px">
                                <span>${str}${item.seriesName}</span>
                                <span style="margin-left:16px">${val}</span>
						    </span>`;
                        })
                        .join(``)
                );
            }
        },
        dataZoom: [
            //X轴滑动条

            {
                type: 'slider', //滑动条
                realtime: true, //开启
                xAxisIndex: [0],
                start: 0, //初始化时,滑动条宽度开始标度
                end: 100, //初始化时,滑动条宽度结束标度
                fillerColor: '#dcdee2', // 滚动条颜色
                borderColor: '#fff',
                backgroundColor: '#fff',
                handleSize: 0, // 两边手柄尺寸
                showDetail: false, // 拖拽时是否展示滚动条两侧的文字
                brushSelect: false,//是否开启刷选功能。
                height: 8,//dataZoom-slider 组件的高度。
                showDataShadow: false,//是否在 dataZoom-silder 组件中显示数据阴影。
                moveHandleStyle: {
                    borderType: 'round'//移动手柄的样式
                },
                borderRadius:0,//圆角半径
                handleSize: '15%',//控制手柄的尺寸
                handleStyle:{//两侧缩放手柄的样式配置
                    borderWidth: 5,
                    borderCap:'round',
                    color:"#dcdee2",
                    borderColor:"#dcdee2"
                },
            },
            {
                type: 'inside', // 支持内部鼠标滚动平移
                start: 0,//初始状态为0-100,展示整个表
                end: 100,
                zoomOnMouseWheel: true, // 关闭滚轮缩放
                moveOnMouseWheel: false, // 开启滚轮平移
                moveOnMouseMove: true // 鼠标移动能触发数据窗口平移
            }
        ],
        dataset: {
            source: []//数据源
        },
        grid: {//直角坐标系内绘图网格
            left: 0,//grid 组件离容器左侧的距离。
            right: 0,
            bottom: 40,
            containLabel: true //grid 区域是否包含坐标轴的刻度标签。
        },
        xAxis: [//x轴
            {
                type: 'category',
                axisLabel: {
                    color: '#86909C'
                },
                axisLine: {
                    show: true,
                    lineStyle: {
                        color: '#F2F3F5'
                    }
                },
                data: ["1月","2月","3月","4月","5月","6月"]
            }
        ],
        yAxis: [//y轴
            {//左边的Y轴
                type: 'value',
                position: 'left',//位置:左边
                alignTicks: true, //左右刻度线对齐
                splitLine: {//坐标轴在 grid 区域中的分隔线。
                    lineStyle: {
                        color: '#F2F3F5'
                    }
                },
                axisLabel: {//坐标轴刻度标签的相关设置。
                    formatter: '{value}'
                }
            },
            {//右边的Y轴
                type: 'value',
                position: 'right',//位置:右边
                alignTicks: true,
                splitLine: {
                    lineStyle: {
                        color: '#F2F3F5'
                    }
                },
                axisLabel: {
                    formatter: value => {
                        return 100 * value + '%';//修改刻度标签的内容
                    }
                }
            }
        ],
        series: [//图表数据
            { name: '问题总数', type: 'bar', data: [100,85,86,74,96,82], barGap: 0 },  //name:柱状图名称   type:类型,bar柱状,line,折线
            { name: '在途问题数', type: 'bar', data: [55,45,49,56,75,75] },  //barGap:柱状图柱子之间的间距,yAxisIndex:对应的Y轴
            { name: '结案问题数', type: 'bar', data: [35,21,11,8,5,2] },
            { name: '超时问题数', type: 'bar', data: [10,14,26,10,16,5] },
            { name: '好评数', type: 'bar', data: [34,21,11,8,5,2] },
            { name: '问题解决率', type: 'line', data: [0.45,0.48,0.47,0.46,0.55,0.75], yAxisIndex: 1 },
            { name: '按时完成率', type: 'line', data: [0.58,0.47,0.96,0.85,0.75,0.69], yAxisIndex: 1 },
            { name: '好评率', type: 'line', data: [0.77,0.80,0.92,0.76,1.00,0.85], yAxisIndex: 1 }
        ],
        color: [//颜色
            '#165DFF',
            '#8CDAE5',
            '#41B75F',
            '#F27F42',
            '#FFC100',
            '#3270FF',
            '#41B75F',
            '#F27F42'
        ]
    };
又例如如下的饼图:
    option = {
        title: {
            text: '问题解决率',//标题名称
            subtext: '85%',//标题内容
            textStyle: {//标题名称样式
                fontSize: 12,
                color: '#4E5969',
                fontWeight: 400
            },

            subtextStyle: {//标题内容样式
                fontSize: 16,
                color: '#1D2129',
                fontWeight: 500
            },
            textAlign: 'center',//标题位置设置
            left: '82',
            top: '45%'
        },
        tooltip: {//提示框
            trigger: 'item',//提示框触发方式
            borderColor: '#fff',//提示框背景
            formatter: function(info) {//提示框内容
                return `<div style="color: #86909C;line-height:24px">${info.data.name}</div><div style="color: #4E5969;line-height:24px">${info.marker}${info.data.value}</div>`;
            },

            textStyle: {
                fontSize: '12'
            }
        },
        legend: {//图例设置
            orient: 'vertical',//图例布局朝向
            right: '0',//图例位置
            bottom: '0',
            icon: 'circle',//图例图标样式
            itemWidth: 8,//图例图标大小
            itemHeight: 8,
            itemGap: 12,//图例间距
            textStyle: {//图例文字样式
                color: '#4E5969',

            }
        },
        series: [//图的设置
            {
                name: '',
                type: 'pie',//类型
                radius: ['65%', '95%'],//圈的大小
                avoidLabelOverlap: true,//是否启用防止标签重叠策略
                left: '0',//位置设置
                top: 'middle',
                width: '180px',//大小设置
                height: '180px',
                label: {//饼图图形上的文本标签
                    show: true,
                    position: 'inner',//显示位置
                    formatter: '{c}',//内容
                    fontSize: '12',//大小
                    color: '#fff',//颜色
                    fontWeight: '400'//字重
                },
                labelLine: {
                    show: false
                },
                data: [{name:"1部",value:"80"},{name:"2部",value:"49"},{name:"3部",value:"85"},{name:"4部",value:"56"},{name:"5部",value:"73"},{name:"6部",value:"46"},{name:"7部",value:"70"},{name:"8部",value:"68"}]
            }
        ],
        color: [            '#165DFF',
            '#8CDAE5',
            '#41B75F',
            '#F27F42',
            '#FFC100',
            '#3270FF',
            '#41B75F',
            '#F27F42']
    };
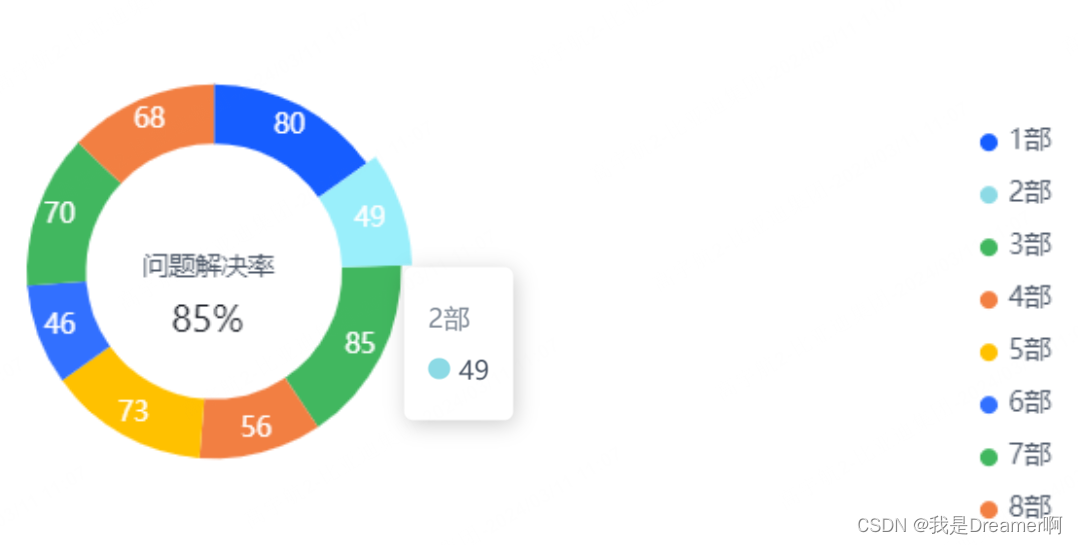
以上ECharts中常见的两种图处理起来并不难,但是在设置option时需要耐心的查看配置项文档。
当然,ECharts中的还有很多其他类型的图,就不一一列举了,使用时可以参考ECharts中的配置文档。

