PyEcharts
就是百度的Echarts,针对Python有一款专门的,所以就叫PyEcharts
官方网站:
文档:
https://pyecharts.org/#/zh-cn/
示例:
https://gallery.pyecharts.org/#/README
通过pip安装
pip install pyecharts
或者通过PyCharm安装都行
入门操作
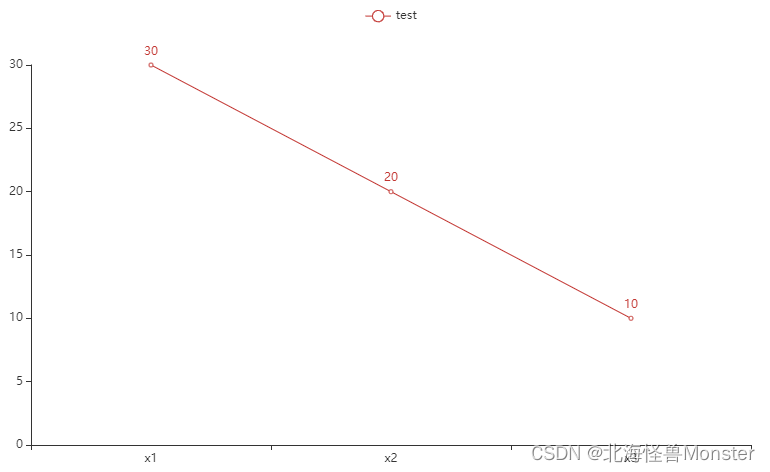
折现图:
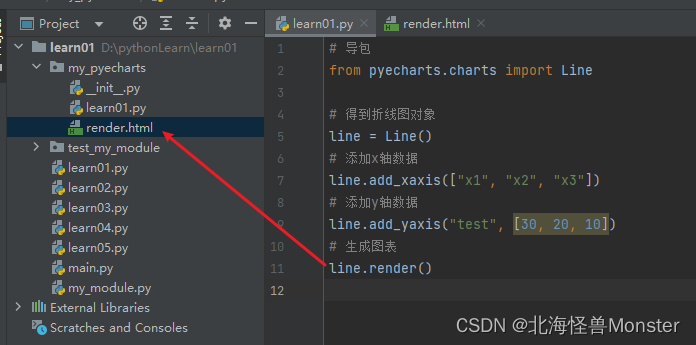
运行之后会生成一个html文件
效果如下:
全局配置项:
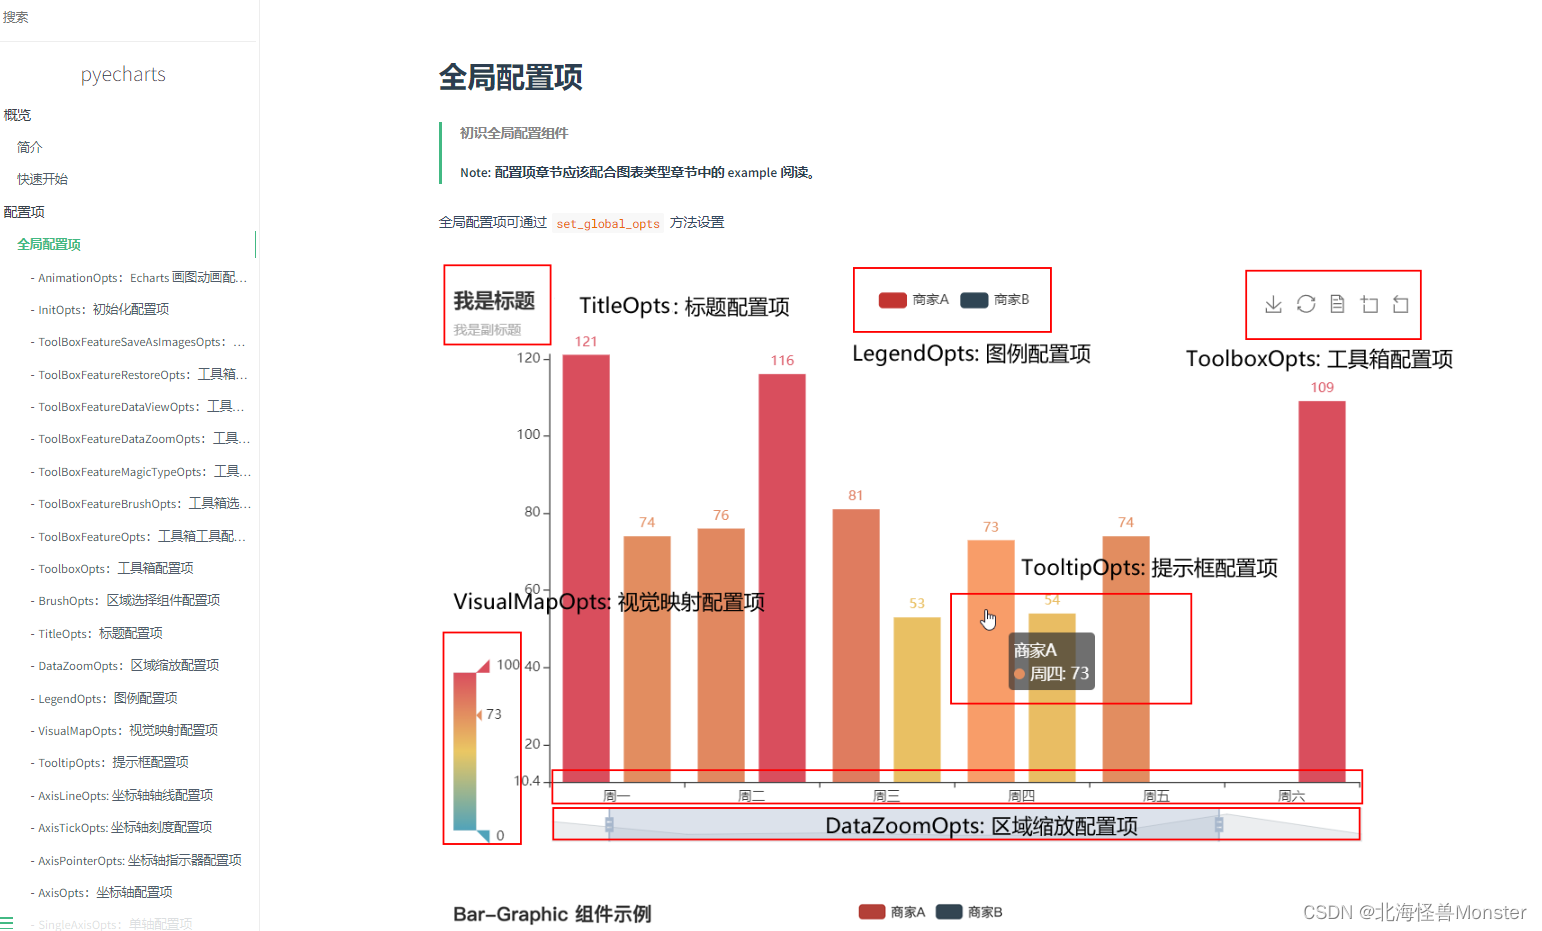
每个图表都有一些功能的东西,例如 : 标题、工具箱、图例等,所有图表都需要这些,那么这些东西就通过全局配置项进行设置。
关于全局配置项的设置,需要导入options模块。
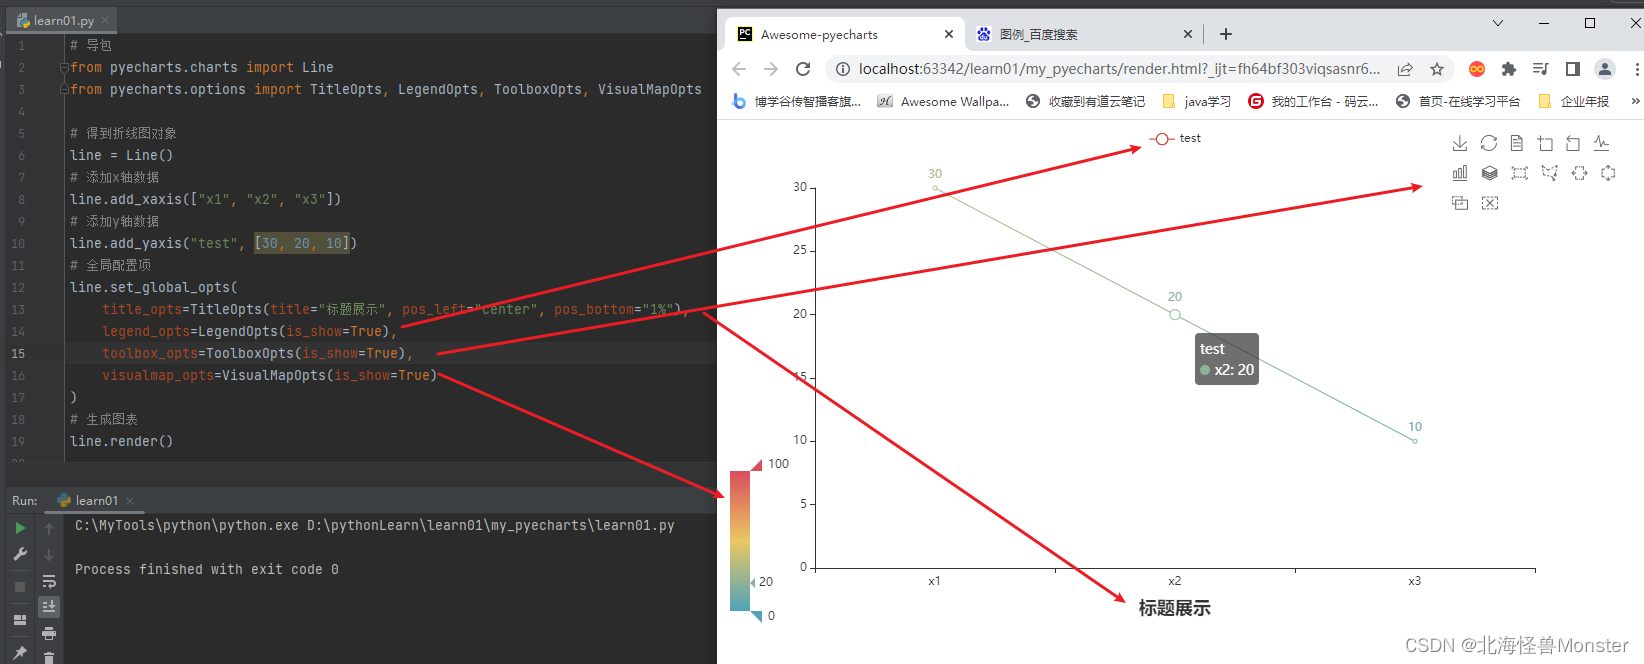
其他的配置项可以通过官方文档进行查阅
系列配置项:
针对每种图形的特征进行配置。
地图 Echarts
from pyecharts.charts import Map
from pyecharts.options import VisualMapOpts

# 地图对象
map = Map()
# 数据
data = [
    ("北京", 99),
    ("上海", 199),
    ("天津", 299),
    ("四川", 399),
    ("陕西", 499),
    ("重庆", 599)
]

# 添加数据
map.add('测试地图', data, 'china')
# 设置全局选项
map.set_global_opts(
    visualmap_opts=VisualMapOpts(
        is_show=True, # 视觉指示器
        is_piecewise=True,  # 设置分段
        pieces=[  # 自定义分段
            {"min": 1, "max": 9, "label": "1-9人", "color": "#ccffff"},
            {"min": 10, "max": 99, "label": "10-99人", "color": "#ffff99"},
            {"min": 100, "max": 499, "label": "99-499人", "color": "#ff9966"},
            {"min": 500, "max": 999, "label": "499-999人", "color": "#ff6666"},
            {"min": 1000, "max": 9999, "label": "1000-9999人", "color": "#cc3333"},
            {"min": 10000, "label": "10000以上", "color": "#990033"},
        ]
    )
)
# 绘图
map.render("my_map.html")
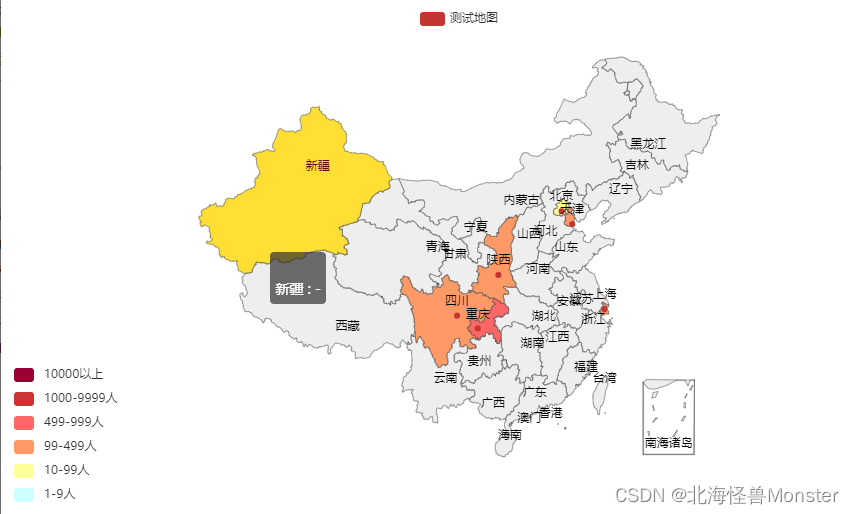
效果图
柱状图
基础柱状图:

基础时间线柱状图
就是添加许多柱状图,然后给你自动切换。
from pyecharts.charts import Bar, Timeline
from pyecharts.options import LabelOpts
from pyecharts.globals import ThemeType

bar1 = Bar()
bar1.add_xaxis(["test01", "test02", "test03"])
bar1.add_yaxis("测试数据", [30, 20, 10], label_opts=LabelOpts(position="right"))
bar1.reversal_axis()

bar2 = Bar()
bar2.add_xaxis(["test01", "test02", "test03"])
bar2.add_yaxis("测试数据", [40, 40, 20], label_opts=LabelOpts(position="right"))
bar2.reversal_axis()

bar3 = Bar()
bar3.add_xaxis(["test01", "test02", "test03"])
bar3.add_yaxis("测试数据", [50, 60, 70], label_opts=LabelOpts(position="right"))
bar3.reversal_axis()

timeline = Timeline(
    {"theme": ThemeType.LIGHT}  # 设置主题
)
timeline.add(bar1, "点1")
timeline.add(bar2, "点2")
timeline.add(bar3, "点3")
# 自动播放设置
timeline.add_schema(
    play_interval=1000,  # 自动播放的时间间隔,单位毫秒
    is_timeline_show=True,  # 是否在自动播放的时候显示时间线
    is_auto_play=True,  # 是否自动播放
    is_loop_play=True  # 是否循环自动播放
)
timeline.render("基础时间线柱状图.html")

