效果图
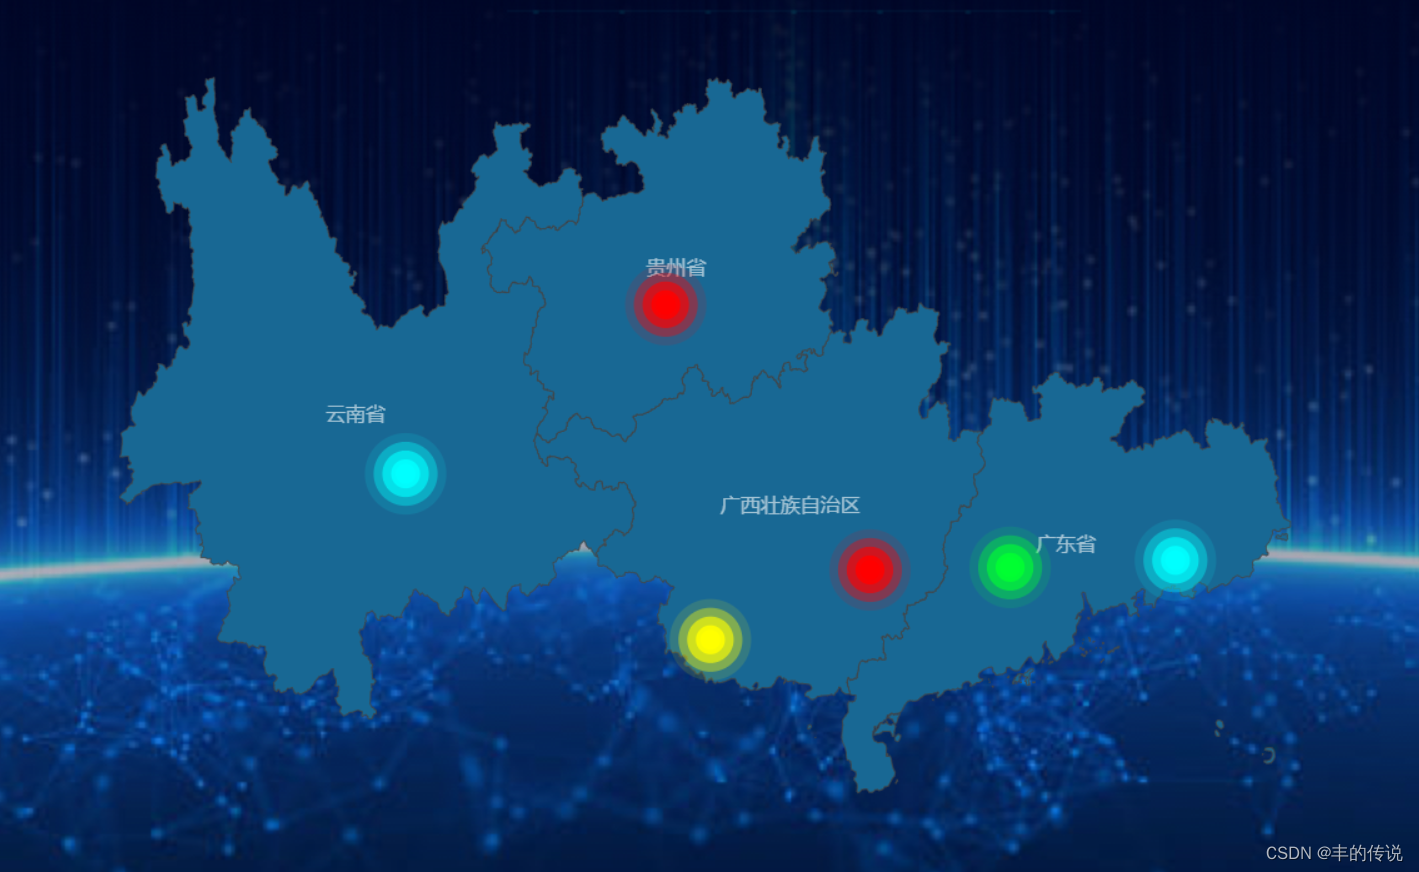
业务组件
<template>
   <mapEcharts
      :itemStyle="mapProps.itemStyle"
      :emphasisLabelStyle="mapProps.emphasisLabelStyle"
      :emphasisItemStyle="mapProps.emphasisItemStyle"
      :labelInfo="mapProps.labelInfo"
      :rippleEffect="mapProps.rippleEffect"
      :tooltipProps="mapProps.tooltipProps"
      :tooltipFormat="mapProps.tooltipFormat"
      :itemColorFormat="mapProps.itemColorFormat"
      :seriesData="mapProps.seriesData">
    </mapEcharts>
</template>


<script setup lang="ts">
const mapProps = reactive({
    itemStyle: {
        areaColor: '#186894',//区域颜色
        shadowColor: '#2894c9',//边缘阴影颜色
        color: 'rgba(255, 255, 255, 1)'//文字颜色
    },
    emphasisLabelStyle: {
        color: "rgba(255, 255, 255, 1)"
    },
    emphasisItemStyle: {
        areaColor: '#39baf6',
        shadowColor: '#2894c9',
    },
    labelInfo: {
        show: true,
        color: 'rgba(255,255,255,0.6)',
        position: 'inside',
        distance: 0,
        fontSize: 10,
        rotate: 0,
    },
    rippleEffect: {
        number: 4,
        period: 4,
        scale: 4.5,
        brushType: 'fill'
    },
    tooltipProps: {
        show: true,
        shadowColor: 'rgba(0, 0, 0, 0)', // 设置阴影颜色为透明
        shadowBlur: 0, // 设置阴影模糊度为0,即无阴影
        backgroundColor: "rgba(21, 29, 56,0)",
        borderColor: "rgba(21, 29, 56,0)"
    },
    tooltipFormat: (params: any) => {
        console.log("params11", params)
        const curItem = mapDataByProvice(params.name)
        let fromatStr =
            `<div style="background:url(${getImg('/src/assets/img/mapHoverBg.png')});width:324px;height:225px;background-size:contain;background-repeat:no-repeat;">
                <div style="width: 100px;height: 90px;padding-top:4px;position:relative;">
                    <div  style="position:absolute;left:20px;top:10px;font-weight:bold;color:#fff;">
                        ${params.name}
                    </div>
                    <div  style="position:absolute;left:120px;top:58px;color:#fff;width:120px;text-align:right;">
                        ${curItem.selfCount}
                    </div>
                    <div  style="position:absolute;left:135px;top:108px;color:#fff;width:120px;text-align:right;">
                        ${curItem.toCount}
                    </div>
                    <div  style="position:absolute;left:166px;top:158px;color:#fff;width:120px;text-align:right;">
                        ${curItem.inCount}
                    </div>
                </div>
            </div>`
        return fromatStr
    },
    itemColorFormat: (params: any) => {
        console.log("params001", params)
        if (params.value[2] > 0 && params.value[2] <= 100) {
            return '#00ff31';
        } else if (params.value[2] > 100 && params.value[2] <= 200) {
            return '#f00';
        } else if (params.value[2] > 200 && params.value[2] <= 300) {
            return '#0ff';
        } else if (params.value[2] > 300 && params.value[2] <= 400) {
            return '#ff0';
        }
    },
    seriesData: [{ name: '肇庆市', value: [112.48461, 23.05196, 100] },
    { name: '佛山市', value: [110.130214, 23.018978, 200] },
    { name: '广州', value: [115.261081, 23.139856, 300] },
    { name: '南宁', value: [107.45, 22.139856, 400] },
    { name: '贵阳', value: [106.7, 26.36, 200] },
    { name: '昆明', value: [102.33, 24.23, 300] }]
})

const mapDataByProvice = (provinceName: String) => {
    let listData = [
        {
            name: "广东省",
            selfCount: 123,
            toCount: 300,
            inCount: 987
        },
        {
            name: "广西壮族自治区",
            selfCount: 23,
            toCount: 55,
            inCount: 278
        },
        {
            name: "云南省",
            selfCount: 256,
            toCount: 2456,
            inCount: 745
        },
        {
            name: "贵州省",
            selfCount: 963,
            toCount: 4521,
            inCount: 963
        }
    ]
    const curItem: any = listData.find(ele => ele.name == provinceName)
    return curItem
}
</script>
封装组件
<template>
    <div ref="mapEcharts" style="width: 100%;height: 100%;"></div>
</template>

<script setup lang="ts">
import * as echarts from 'echarts'
import gdGxJSON from './xnall.json'
const mapEcharts = ref(null)
const getImg = () => {
    return new URL(`/src/components/echartsCom/img/hover_bg.png`, import.meta.url).href;
}

const propsVal = defineProps({
    title: {//标题
        type: Object,
        default: {

        }
    },
    itemStyle: {//地图项样式
        type: Object,
        default: {
            areaColor: '#186894',//区域颜色
            shadowColor: '#2894c9',//边缘阴影颜色
            color: 'rgba(255, 255, 255, 1)'//文字颜色
        }
    },
    emphasisLabelStyle: {//鼠标移入 文本 label 高亮的样式
        type: Object,
        default: {
            color: "rgba(255, 255, 255, 1)"
        }
    },
    emphasisItemStyle: {//鼠标移入 地图高亮样式
        type: Object,
        default: {
            areaColor: '#39baf6',
            shadowColor: '#2894c9',
        }
    },
    labelInfo: {
        type: Object,//地图标签配置 如 云南省等
        default: {
            show: true,
            color: 'rgba(255,255,255,0.6)',
            position: 'inside',
            distance: 0,
            fontSize: 10,
            rotate: 0,
        }
    },
    rippleEffect: {//点的闪烁配置
        type: Object,
        default: {
            number: 4,
            period: 4,
            scale: 4.5,
            brushType: 'fill'
        }
    },
    tooltipProps: {//鼠标移动提示框的样式
        type: Object,
        default: {
            show: false,//是否显示,默认不显示
            backgroundColor: '#fff'//提示框的背景色
        }
    },
    tooltipFormat: {//提示 格式
        type: Function,
        default: () => { }
    },
    itemColorFormat: {//颜色格式化
        type: Function,
        default: () => { }
    },

    seriesData: {//地图点标记数据
        type: Array,
        default: []
    }
})
const initEcharts = () => {
    echarts.registerMap('guangdong', gdGxJSON)
    nextTick(() => {
        const map = echarts.init(mapEcharts.value, null, {
            renderer: 'canvas',
        })
        const option = {
            title: propsVal.title,
            // 悬浮窗
            tooltip: {
                trigger: 'item',//触发条件
            },
            geo: {
                map: 'guangdong',
                zoom: 1,
                roam: 'move',
                label: propsVal.labelInfo,
                // 所有地图的区域颜色
                itemStyle: propsVal.itemStyle,
                emphasis: {
                    label: propsVal.emphasisLabelStyle,
                    itemStyle: propsVal.emphasisItemStyle
                },
                tooltip: {
                    ...propsVal.tooltipProps,
                    formatter: (params: any) => {
                        return propsVal.tooltipFormat(params)
                    }


                    /*                 (params: any) => {
                                        console.log("params11", params)
                                        const curItem = mapDataByProvice(params.name)
                                        let fromatStr =
                                            `<div style="background:url(${getImg()});width:120px;height:70px;background-size:contain;background-repeat:no-repeat;">
                                                <div style="width: 100px;height: 90px;padding-top:4px;">
                                                    <div  style="width: 100px;height: 14px;box-sizing: content-box;padding-bottom: 8px;text-align: right;">
                                                        ${curItem.selfCount}
                                                    </div>
                                                    <div  style="width: 100px;height: 14px;box-sizing: content-box;padding-bottom: 8px;text-align: right;">
                                                        ${curItem.toCount}
                                                    </div>
                                                    <div  style="width: 100px;height: 14px;box-sizing: content-box;padding-bottom: 8px;text-align: right;">
                                                        ${curItem.inCount}
                                                    </div>
                                                </div>
                                            </div>
                                        `
                                        return fromatStr
                                    } */
                }
            },
            series: [
                {
                    name: 'Top 5',
                    type: 'effectScatter',
                    colorBy: 'series',
                    effectType: 'ripple',
                    showEffectOn: 'render',
                    rippleEffect: propsVal.rippleEffect,
                    itemStyle: {
                        color: (params: any) => {
                            return propsVal.itemColorFormat(params)

                        }
                    },


                    /*                     {
                                            color: (params: any) => {
                                                console.log("params001", params)
                                                if (params.value[2] > 0 && params.value[2] <= 100) {
                                                    return '#00ff31';
                                                } else if (params.value[2] > 100 && params.value[2] <= 200) {
                                                    return '#f00';
                                                } else if (params.value[2] > 200 && params.value[2] <= 300) {
                                                    return '#0ff';
                                                } else if (params.value[2] > 300 && params.value[2] <= 400) {
                                                    return '#ff0';
                                                }
                                            }
                                        }, */
                    coordinateSystem: 'geo',
                    data: propsVal.seriesData

                    /*  [{ name: '肇庆市', value: [112.48461, 23.05196, 100] },
                     { name: '佛山市', value: [110.130214, 23.018978, 200] },
                     { name: '广州', value: [115.261081, 23.139856, 300] },
                     { name: '南宁', value: [107.45, 22.139856, 400] },
                     { name: '贵阳', value: [106.7, 26.36, 200] },
                     { name: '昆明', value: [102.33, 24.23, 300] }] */

                }
            ],
        }
        map.setOption(option)
    })
}
/* const mapDataByProvice = (provinceName: String) => {
    let listData = [
        {
            name: "广东省",
            selfCount: 123,
            toCount: 300,
            inCount: 987
        },
        {
            name: "广西壮族自治区",
            selfCount: 23,
            toCount: 55,
            inCount: 278
        },
    ]
    const curItem: any = listData.find(ele => ele.name == provinceName)
    return curItem
} */
onMounted(() => {
    console.log("propsval", propsVal)
    initEcharts()
})

</script>

<style scoped>
.map-echart {
    height: 600px;
    width: 900px;
}
</style>

