文章目录
- 一、语法
- 二、参数
- 三、返回值
- 四、实例
- 4.1 基本桑基图
- 4.2 桑基图的hovertemplate和customdata
- 4.3 定义节点位置
- 4.4 带有彩色链接的更复杂的桑基图
- 4.5 Dash中的桑基图
- 4.6 风格桑基图
一、语法
用于网络流量数据分析的桑基图。节点在 中指定,nodes源和目标之间的链接在中指定links。颜色在nodes[i].color和 中设置links[i].color,否则使用默认值。
plotly.graph_objects.Sankey(arg=None,
                            arrangement=None,
                            customdata=None,
                            customdatasrc=None,
                            domain=None,
                            hoverinfo=None,
                            hoverlabel=None,
                            ids=None,
                            idssrc=None,
                            legendgrouptitle=None,
                            legendrank=None,
                            link=None,
                            meta=None,
                            metasrc=None,
                            name=None,
                            node=None,
                            orientation=None,
                            selectedpoints=None,
                            stream=None,
                            textfont=None,
                            uid=None,
                            uirevision=None,
                            valueformat=None,
                            valuesuffix=None,
                            visible=None,
                            **kwargs)
二、参数
-
arg - 与此构造函数或实例兼容的属性字典plotly.graph_objects.Sankey
-
arrangement - 如果值为snap(默认值),节点排列由元素的自动捕捉辅助,以保留通过指定的节点之间的空间nodepad。如果值为perpendicular,则节点只能沿垂直于流的线移动。如果值为 freeform,则节点可以在平面上自由移动。如果值为fixed,则节点是静止的。
-
customdata – 为每个数据分配额外的数据。这在侦听悬停、单击和选择事件时可能很有用。请注意,“分散”跟踪还会在标记 DOM 元素中附加自定义数据项
-
customdatasrc – 在 Chart Studio Cloud 上为 customdata.
-
domain –plotly.graph_objects.sankey.Domain具有兼容属性的实例或字典
-
hoverinfo – 确定在悬停时显示哪些跟踪信息。如果 设置none或skip,则悬停时不显示任何信息。但是,如果none设置,单击和悬停事件仍会触发。请注意,此属性分别被节点和链接node.hoverinfo所取代。node.hoverinfo
-
hoverlabel –plotly.graph_objects.sankey.Hoverlabel 具有兼容属性的实例或字典
-
ids – 为每个数据分配 id 标签。这些 id 用于动画期间数据点的对象恒定性。应该是字符串数组,而不是数字或任何其他类型。
-
idssrc – 在 Chart Studio Cloud 上为 ids.
-
legendgrouptitle –plotly.graph_objects.sankey.Legendgrouptitle 具有兼容属性的实例或字典
-
legendrank – 设置此跟踪的图例等级。排名较小的项目和组显示在顶部/左侧,而它们位于底部/右侧。默认的 legendrank 为 1000,因此您可以使用 rank 小于 1000 将某些项目放置在所有未排序的项目之前,而将 rank 大于 1000 放置在所有未排序的项目之后。reversed `legend.traceorder
-
link ——桑基图的链接。
-
meta - 分配与此跟踪相关的额外元信息,可用于各种文本属性。trace name、graph、axis和colorbar title.text、annotation text rangeselector、 text等属性都updatemenues支持。要访问 同一跟踪中属性中的跟踪值,只需使用 where是相关 项目的索引或键。要访问布局属性中的跟踪,请使用where 是索引或 的键,并且是跟踪索引。sliders labelmetameta%{meta[i]}imetameta%{data[n[.meta[i]}imetan
-
metasrc – 在 Chart Studio Cloud 上为 meta.
-
name – 设置跟踪名称。跟踪名称显示为图例项并悬停。
-
node – 桑基图的节点。
-
orientation - 设置桑基图的方向。
-
selectedpoints - 包含所选点的整数索引的数组。仅对支持选择的迹线有效。请注意,空数组表示unselected所有点都打开的空选择,而任何其他非数组值都表示在selected和unselected样式无效的情况下没有选择。
-
stream -plotly.graph_objects.sankey.Stream具有兼容属性的实例或字典
-
textfont – 设置节点标签的字体
-
uid – 为该跟踪分配一个 id,使用它在动画和过渡期间提供跟踪之间的对象恒定性。
-
uirevision - 控制对跟踪的一些用户驱动更改的持久性:constraintrange在parcoords跟踪中,以及一些修改,例如 和。默认为. 请注意,其他用户驱动的跟踪属性更改由属性控制:由 控制, 由控制 ,并且 (可通过 访问)由 控制。跟踪更改由 跟踪,如果没有提供,则仅回退到跟踪索引。因此,如果您的应用程序可以在数组末尾添加/删除跟踪,这样相同的跟踪具有不同的索引,如果您给每个跟踪一个 editable: truenamecolorbar.titlelayout.uirevisionlayouttrace.visiblelayout.legend.uirevisionselectedpointslayout.selectionrevisioncolorbar.(x|y)config: {editable: true}layout.editrevisionuiduiddatauid当它移动时,它会一直伴随着它。
-
valueformat – 使用与 Python 中的非常相似的 d3 格式化迷你语言设置值格式化规则。有关数字,请参阅: https 😕/github.com/d3/d3-format/tree/v1.4.5#d3-format 。
-
valuesuffix – 添加一个单位以跟随悬停工具提示中的值。如果需要与值分隔,请添加一个空格。
-
visible – 确定此跟踪是否可见。如果“legendonly”,则不绘制迹线,但可以显示为图例项(前提是图例本身可见)。
三、返回值
Sankey
四、实例
桑基图是一种流程图,其中箭头的宽度与流量成正比。
4.1 基本桑基图
桑基图通过定义表示源节点的源、目标节点的目标、设置流量的值和显示节点名称的标签来可视化对流的贡献。
import plotly.graph_objects as go

fig = go.Figure(data=[go.Sankey(
    node = dict(
      pad = 15,
      thickness = 20,
      line = dict(color = "black", width = 0.5),
      label = ["A1", "A2", "B1", "B2", "C1", "C2"],
      color = "blue"
    ),
    link = dict(
      source = [0, 1, 0, 2, 3, 3], # 索引对应于标签, 如 A1, A2, A1, B1, ...
      target = [2, 3, 3, 4, 4, 5],
      value = [8, 4, 2, 8, 4, 2]
  ))])

fig.update_layout(title_text="基本桑基图", font_size=10)
fig.show()

4.2 桑基图的hovertemplate和customdata
链接和节点有自己的悬停模板,可以在其中显示链接或节点特定的属性。要向链接和节点添加更多数据,可以使用 和 的customdata属性,link如下nodes例所示。有关 hovertemplate 和 customdata 的更多信息,请参阅悬停文本教程。
import plotly.graph_objects as go

fig = go.Figure(data=[go.Sankey(
    node = dict(
      pad = 15,
      thickness = 20,
      line = dict(color = "black", width = 0.5),
      label = ["A1", "A2", "B1", "B2", "C1", "C2"],
      customdata = ["Long name A1", "Long name A2", "Long name B1", "Long name B2",
                    "Long name C1", "Long name C2"],
      hovertemplate='Node %{customdata} has total value %{value}<extra></extra>',
      color = "blue"
    ),
    link = dict(
      source = [0, 1, 0, 2, 3, 3], # indices correspond to labels, eg A1, A2, A2, B1, ...
      target = [2, 3, 3, 4, 4, 5],
      value = [8, 4, 2, 8, 4, 2],
      customdata = ["q","r","s","t","u","v"],
      hovertemplate='Link from node %{source.customdata}<br />'+
        'to node%{target.customdata}<br />has value %{value}'+
        '<br />and data %{customdata}<extra></extra>',
  ))])

fig.update_layout(title_text="Basic Sankey Diagram", font_size=10)
fig.show()

4.3 定义节点位置
以下示例设置node.x并将node.y节点放置在指定位置,除非在snap arrangement(默认行为时node.x和node.y未定义时)以避免节点重叠,因此,将设置元素的自动捕捉以定义之间的填充通过nodepad节点。其他可能的安排是:1)垂直2)自由形式3)固定
import plotly.graph_objects as go

fig = go.Figure(go.Sankey(
    arrangement = "snap",
    node = {
        "label": ["A", "B", "C", "D", "E", "F"],
        "x": [0.2, 0.1, 0.5, 0.7, 0.3, 0.5],
        "y": [0.7, 0.5, 0.2, 0.4, 0.2, 0.3],
        'pad':10},  # 10 Pixels
    link = {
        "source": [0, 0, 1, 2, 5, 4, 3, 5],
        "target": [5, 3, 4, 3, 0, 2, 2, 3],
        "value": [1, 2, 1, 1, 1, 1, 1, 2]}))

fig.show()

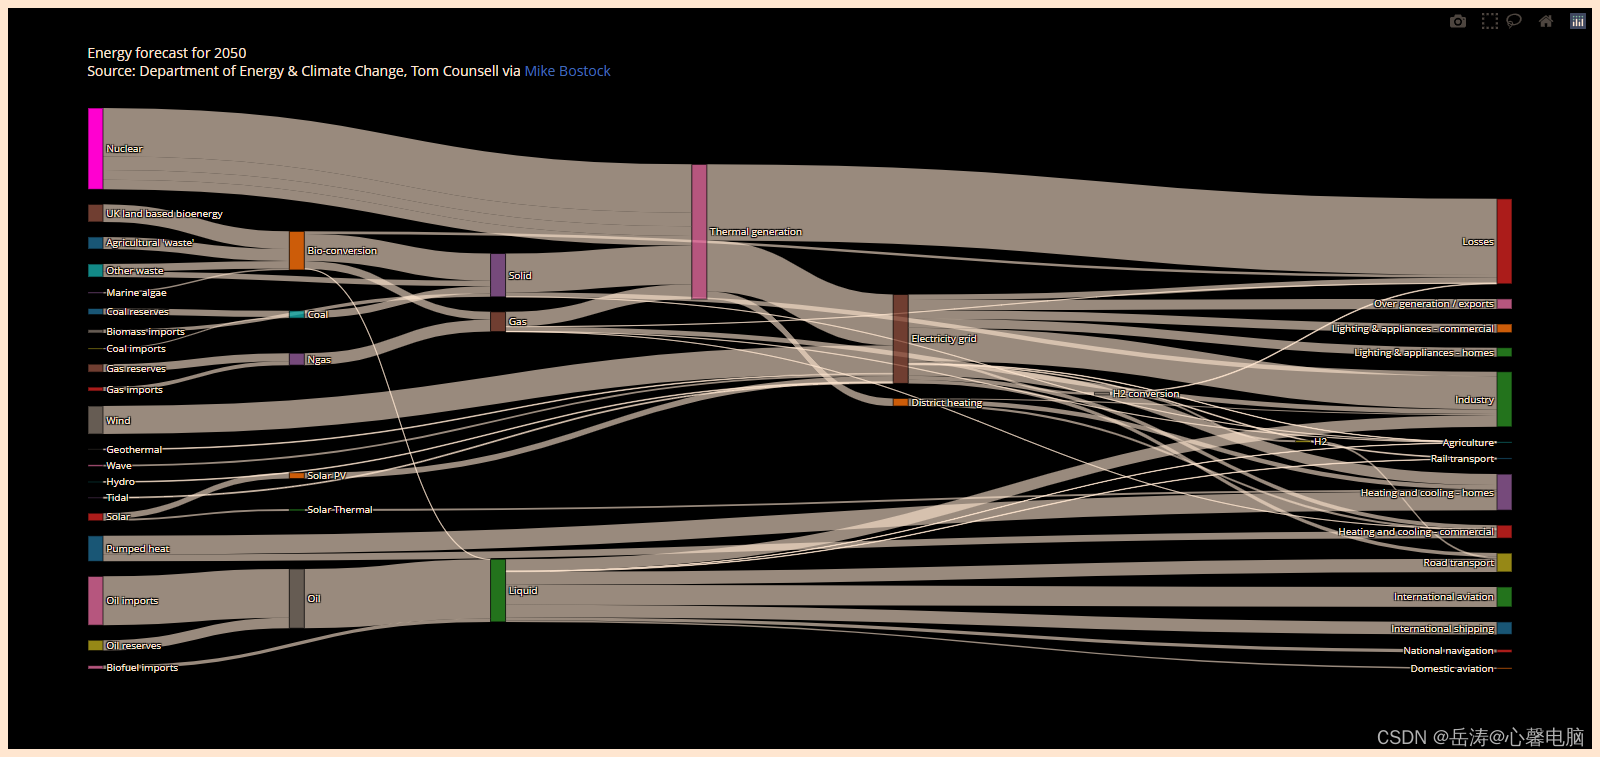
4.4 带有彩色链接的更复杂的桑基图
import plotly.graph_objects as go
import urllib.request
import json

url = 'https://raw.githubusercontent.com/plotly/plotly.js/master/test/image/mocks/sankey_energy.json'
# response = urllib.request.urlopen(url)
# data = json.loads(response.read())
with open('f:/sankey_energy.json', encoding='utf-8') as f:
    data = json.load(f)
print(data)
'''
{'data': [{'type': 'sankey', 'domain': {'x': [0, 1], 'y': [0, 1]}, 'orientation': 'h', 'valueformat': '.0f', 'valuesuffix': 'TWh', 'node': {'pad': 15, 'thickness': 15, 'line': {'color': 'black', 'width': 0.5}, 'label': ["Agricultural 'waste'", 'Bio-conversion', 'Liquid', 'Losses', 'Solid', 'Gas', 'Biofuel imports', 'Biomass imports', 'Coal imports', 'Coal', 'Coal reserves', 'District heating', 'Industry', 'Heating and cooling - commercial', 'Heating and cooling - homes', 'Electricity grid', 'Over generation / exports', 'H2 conversion', 'Road transport', 'Agriculture', 'Rail transport', 'Lighting & appliances - commercial', 'Lighting & appliances - homes', 'Gas imports', 'Ngas', 'Gas reserves', 'Thermal generation', 'Geothermal', 'H2', 'Hydro', 'International shipping', 'Domestic aviation', 'International aviation', 'National navigation', 'Marine algae', 'Nuclear', 'Oil imports', 'Oil', 'Oil reserves', 'Other waste', 'Pumped heat', 'Solar PV', 'Solar Thermal', 'Solar', 'Tidal', 'UK land based bioenergy', 'Wave', 'Wind'], 'color': ['rgba(31, 119, 180, 0.8)', 'rgba(255, 127, 14, 0.8)', 'rgba(44, 160, 44, 0.8)', 'rgba(214, 39, 40, 0.8)', 'rgba(148, 103, 189, 0.8)', 'rgba(140, 86, 75, 0.8)', 'rgba(227, 119, 194, 0.8)', 'rgba(127, 127, 127, 0.8)', 'rgba(188, 189, 34, 0.8)', 'rgba(23, 190, 207, 0.8)', 'rgba(31, 119, 180, 0.8)', 'rgba(255, 127, 14, 0.8)', 'rgba(44, 160, 44, 0.8)', 'rgba(214, 39, 40, 0.8)', 'rgba(148, 103, 189, 0.8)', 'rgba(140, 86, 75, 0.8)', 'rgba(227, 119, 194, 0.8)', 'rgba(127, 127, 127, 0.8)', 'rgba(188, 189, 34, 0.8)', 'rgba(23, 190, 207, 0.8)', 'rgba(31, 119, 180, 0.8)', 'rgba(255, 127, 14, 0.8)', 'rgba(44, 160, 44, 0.8)', 'rgba(214, 39, 40, 0.8)', 'rgba(148, 103, 189, 0.8)', 'rgba(140, 86, 75, 0.8)', 'rgba(227, 119, 194, 0.8)', 'rgba(127, 127, 127, 0.8)', 'rgba(188, 189, 34, 0.8)', 'rgba(23, 190, 207, 0.8)', 'rgba(31, 119, 180, 0.8)', 'rgba(255, 127, 14, 0.8)', 'rgba(44, 160, 44, 0.8)', 'rgba(214, 39, 40, 0.8)', 'rgba(148, 103, 189, 0.8)', 'magenta', 'rgba(227, 119, 194, 0.8)', 'rgba(127, 127, 127, 0.8)', 'rgba(188, 189, 34, 0.8)', 'rgba(23, 190, 207, 0.8)', 'rgba(31, 119, 180, 0.8)', 'rgba(255, 127, 14, 0.8)', 'rgba(44, 160, 44, 0.8)', 'rgba(214, 39, 40, 0.8)', 'rgba(148, 103, 189, 0.8)', 'rgba(140, 86, 75, 0.8)', 'rgba(227, 119, 194, 0.8)', 'rgba(127, 127, 127, 0.8)']}, 'link': {'source': [0, 1, 1, 1, 1, 6, 7, 8, 10, 9, 11, 11, 11, 15, 15, 15, 15, 15, 15, 15, 15, 15, 15, 15, 23, 25, 5, 5, 5, 5, 5, 27, 17, 17, 28, 29, 2, 2, 2, 2, 2, 2, 2, 2, 34, 24, 35, 35, 36, 38, 37, 39, 39, 40, 40, 41, 42, 43, 43, 4, 4, 4, 26, 26, 26, 44, 45, 46, 47, 35, 35], 'target': [1, 2, 3, 4, 5, 2, 4, 9, 9, 4, 12, 13, 14, 16, 14, 17, 12, 18, 19, 13, 3, 20, 21, 22, 24, 24, 13, 3, 26, 19, 12, 15, 28, 3, 18, 15, 12, 30, 18, 31, 32, 19, 33, 20, 1, 5, 26, 26, 37, 37, 2, 4, 1, 14, 13, 15, 14, 42, 41, 19, 26, 12, 15, 3, 11, 15, 1, 15, 15, 26, 26], 'value': [124.729, 0.597, 26.862, 280.322, 81.144, 35, 35, 11.606, 63.965, 75.571, 10.639, 22.505, 46.184, 104.453, 113.726, 27.14, 342.165, 37.797, 4.412, 40.858, 56.691, 7.863, 90.008, 93.494, 40.719, 82.233, 0.129, 1.401, 151.891, 2.096, 48.58, 7.013, 20.897, 6.242, 20.897, 6.995, 121.066, 128.69, 135.835, 14.458, 206.267, 3.64, 33.218, 4.413, 14.375, 122.952, 500, 139.978, 504.287, 107.703, 611.99, 56.587, 77.81, 193.026, 70.672, 59.901, 19.263, 19.263, 59.901, 0.882, 400.12, 46.477, 525.531, 787.129, 79.329, 9.452, 182.01, 19.013, 289.366, 100, 100], 'color': ['rgba(0,0,96,0.2)', 'rgba(0,0,96,0.2)', 'rgba(0,0,96,0.2)', 'rgba(0,0,96,0.2)', 'rgba(0,0,96,0.2)', 'rgba(0,0,96,0.2)', 'rgba(0,0,96,0.2)', 'rgba(0,0,96,0.2)', 'rgba(0,0,96,0.2)', 'rgba(0,0,96,0.2)', 'rgba(0,0,96,0.2)', 'rgba(0,0,96,0.2)', 'rgba(0,0,96,0.2)', 'rgba(0,0,96,0.2)', 'rgba(0,0,96,0.2)', 'rgba(0,0,96,0.2)', 'rgba(0,0,96,0.2)', 'rgba(0,0,96,0.2)', 'rgba(0,0,96,0.2)', 'rgba(0,0,96,0.2)', 'rgba(0,0,96,0.2)', 'rgba(0,0,96,0.2)', 'rgba(0,0,96,0.2)', 'rgba(0,0,96,0.2)', 'rgba(0,0,96,0.2)', 'rgba(0,0,96,0.2)', 'rgba(0,0,96,0.2)', 'rgba(0,0,96,0.2)', 'rgba(0,0,96,0.2)', 'rgba(0,0,96,0.2)', 'rgba(0,0,96,0.2)', 'rgba(0,0,96,0.2)', 'rgba(0,0,96,0.2)', 'rgba(0,0,96,0.2)', 'rgba(0,0,96,0.2)', 'rgba(0,0,96,0.2)', 'rgba(0,0,96,0.2)', 'rgba(0,0,96,0.2)', 'rgba(0,0,96,0.2)', 'rgba(0,0,96,0.2)', 'rgba(0,0,96,0.2)', 'rgba(0,0,96,0.2)', 'rgba(0,0,96,0.2)', 'rgba(0,0,96,0.2)', 'rgba(0,0,96,0.2)', 'rgba(0,0,96,0.2)', 'rgba(33,102,172,0.35)', 'rgba(178,24,43,0.35)', 'rgba(0,0,96,0.2)', 'rgba(0,0,96,0.2)', 'rgba(0,0,96,0.2)', 'rgba(0,0,96,0.2)', 'rgba(0,0,96,0.2)', 'rgba(0,0,96,0.2)', 'rgba(0,0,96,0.2)', 'rgba(0,0,96,0.2)', 'rgba(0,0,96,0.2)', 'rgba(0,0,96,0.2)', 'rgba(0,0,96,0.2)', 'rgba(0,0,96,0.2)', 'rgba(0,0,96,0.2)', 'rgba(0,0,96,0.2)', 'rgba(0,0,96,0.2)', 'rgba(0,0,96,0.2)', 'rgba(0,0,96,0.2)', 'rgba(0,0,96,0.2)', 'rgba(0,0,96,0.2)', 'rgba(0,0,96,0.2)', 'rgba(0,0,96,0.2)', 'lightgreen', 'goldenrod'], 'label': ['stream 1', '', '', '', 'stream 1', '', '', '', '', '', '', '', '', '', '', '', '', '', '', '', '', '', '', '', '', '', '', '', '', '', 'stream 1', '', '', '', '', '', '', '', '', '', '', '', '', '', '', '', 'Old generation plant (made-up)', 'New generation plant (made-up)', '', '', '', '', '', '', '', '', '', '', '', '', '', '', '', '', '', '', '', '', '', '', '']}}], 'layout': {'title': {'text': "Energy forecast for 2050, UK — Department of Energy & Climate Change<br>Imperfect copy of <a href='https://bost.ocks.org/mike/sankey/'>Mike Bostock's example</a><br>with numerous <a href='https://plotly.com/javascript/'>Plotly</a> features"}, 'width': 1118, 'height': 772, 'font': {'size': 10}, 'updatemenus': [{'y': 1, 'buttons': [{'label': 'Light', 'method': 'relayout', 'args': ['paper_bgcolor', 'white']},
{'label': 'Dark', 'method': 'relayout', 'args': ['paper_bgcolor', 'black']}]},
{'y': 0.9, 'buttons': [{'label': 'Thick', 'method': 'restyle', 'args': ['node.thickness', 15]},
{'label': 'Thin', 'method': 'restyle', 'args': ['node.thickness', 8]}]},
{'y': 0.8, 'buttons': [{'label': 'Small gap', 'method': 'restyle', 'args': ['node.pad', 15]},
{'label': 'Large gap', 'method': 'restyle', 'args': ['node.pad', 20]}]},
{'y': 0.7, 'buttons': [{'label': 'Snap', 'method': 'restyle', 'args': ['arrangement', 'snap']},
{'label': 'Perpendicular', 'method': 'restyle', 'args': ['arrangement', 'perpendicular']},
{'label': 'Freeform', 'method': 'restyle', 'args': ['arrangement', 'freeform']},
{'label': 'Fixed', 'method': 'restyle', 'args': ['arrangement', 'fixed']}]},
{'y': 0.6, 'buttons': [{'label': 'Horizontal', 'method': 'restyle', 'args': ['orientation', 'h']},
{'label': 'Vertical', 'method': 'restyle', 'args': ['orientation', 'v']}]}]}}

'''
# 用“source”颜色替代灰色链接颜色
opacity = 0.4
# 将“magenta洋红”更改为“rgba”值以增加不透明度
data['data'][0]['node']['color'] = ['rgba(255,0,255, 0.8)' if color == "magenta" else color for color in data['data'][0]['node']['color']]
data['data'][0]['link']['color'] = [data['data'][0]['node']['color'][src].replace("0.8", str(opacity))
                                    for src in data['data'][0]['link']['source']]

fig = go.Figure(data=[go.Sankey(
    valueformat = ".0f",
    valuesuffix = "TWh",
    # 定义节点
    node = dict(
      pad = 15,
      thickness = 15,
      line = dict(color = "black", width = 0.5),
      label =  data['data'][0]['node']['label'],
      color =  data['data'][0]['node']['color']
    ),
    # 添加链接
    link = dict(
      source =  data['data'][0]['link']['source'],
      target =  data['data'][0]['link']['target'],
      value =  data['data'][0]['link']['value'],
      label =  data['data'][0]['link']['label'],
      color =  data['data'][0]['link']['color']
))])

fig.update_layout(title_text="Energy forecast for 2050<br>Source: Department of Energy & Climate Change, Tom Counsell via <a href='https://bost.ocks.org/mike/sankey/'>Mike Bostock</a>",
                  font_size=10)
fig.show()

4.5 Dash中的桑基图
import urllib.request
import json

import dash
from dash import html, dcc
from dash.dependencies import Input, Output
import plotly.graph_objects as go

url = 'https://raw.githubusercontent.com/plotly/plotly.js/master/test/image/mocks/sankey_energy.json'
# response = urllib.request.urlopen(url)
# data = json.loads(response.read())
with open('f:/sankey_energy.json', encoding='utf-8') as f:
    data = json.load(f)
print(data)
'''
{'data': [{'type': 'sankey', 'domain': {'x': [0, 1], 'y': [0, 1]}, 'orientation': 'h', 'valueformat': '.0f', 'valuesuffix': 'TWh', 'node': {'pad': 15, 'thickness': 15, 'line': {'color': 'black', 'width': 0.5}, 'label': ["Agricultural 'waste'", 'Bio-conversion', 'Liquid', 'Losses', 'Solid', 'Gas', 'Biofuel imports', 'Biomass imports', 'Coal imports', 'Coal', 'Coal reserves', 'District heating', 'Industry', 'Heating and cooling - commercial', 'Heating and cooling - homes', 'Electricity grid', 'Over generation / exports', 'H2 conversion', 'Road transport', 'Agriculture', 'Rail transport', 'Lighting & appliances - commercial', 'Lighting & appliances - homes', 'Gas imports', 'Ngas', 'Gas reserves', 'Thermal generation', 'Geothermal', 'H2', 'Hydro', 'International shipping', 'Domestic aviation', 'International aviation', 'National navigation', 'Marine algae', 'Nuclear', 'Oil imports', 'Oil', 'Oil reserves', 'Other waste', 'Pumped heat', 'Solar PV', 'Solar Thermal', 'Solar', 'Tidal', 'UK land based bioenergy', 'Wave', 'Wind'], 'color': ['rgba(31, 119, 180, 0.8)', 'rgba(255, 127, 14, 0.8)', 'rgba(44, 160, 44, 0.8)', 'rgba(214, 39, 40, 0.8)', 'rgba(148, 103, 189, 0.8)', 'rgba(140, 86, 75, 0.8)', 'rgba(227, 119, 194, 0.8)', 'rgba(127, 127, 127, 0.8)', 'rgba(188, 189, 34, 0.8)', 'rgba(23, 190, 207, 0.8)', 'rgba(31, 119, 180, 0.8)', 'rgba(255, 127, 14, 0.8)', 'rgba(44, 160, 44, 0.8)', 'rgba(214, 39, 40, 0.8)', 'rgba(148, 103, 189, 0.8)', 'rgba(140, 86, 75, 0.8)', 'rgba(227, 119, 194, 0.8)', 'rgba(127, 127, 127, 0.8)', 'rgba(188, 189, 34, 0.8)', 'rgba(23, 190, 207, 0.8)', 'rgba(31, 119, 180, 0.8)', 'rgba(255, 127, 14, 0.8)', 'rgba(44, 160, 44, 0.8)', 'rgba(214, 39, 40, 0.8)', 'rgba(148, 103, 189, 0.8)', 'rgba(140, 86, 75, 0.8)', 'rgba(227, 119, 194, 0.8)', 'rgba(127, 127, 127, 0.8)', 'rgba(188, 189, 34, 0.8)', 'rgba(23, 190, 207, 0.8)', 'rgba(31, 119, 180, 0.8)', 'rgba(255, 127, 14, 0.8)', 'rgba(44, 160, 44, 0.8)', 'rgba(214, 39, 40, 0.8)', 'rgba(148, 103, 189, 0.8)', 'magenta', 'rgba(227, 119, 194, 0.8)', 'rgba(127, 127, 127, 0.8)', 'rgba(188, 189, 34, 0.8)', 'rgba(23, 190, 207, 0.8)', 'rgba(31, 119, 180, 0.8)', 'rgba(255, 127, 14, 0.8)', 'rgba(44, 160, 44, 0.8)', 'rgba(214, 39, 40, 0.8)', 'rgba(148, 103, 189, 0.8)', 'rgba(140, 86, 75, 0.8)', 'rgba(227, 119, 194, 0.8)', 'rgba(127, 127, 127, 0.8)']}, 'link': {'source': [0, 1, 1, 1, 1, 6, 7, 8, 10, 9, 11, 11, 11, 15, 15, 15, 15, 15, 15, 15, 15, 15, 15, 15, 23, 25, 5, 5, 5, 5, 5, 27, 17, 17, 28, 29, 2, 2, 2, 2, 2, 2, 2, 2, 34, 24, 35, 35, 36, 38, 37, 39, 39, 40, 40, 41, 42, 43, 43, 4, 4, 4, 26, 26, 26, 44, 45, 46, 47, 35, 35], 'target': [1, 2, 3, 4, 5, 2, 4, 9, 9, 4, 12, 13, 14, 16, 14, 17, 12, 18, 19, 13, 3, 20, 21, 22, 24, 24, 13, 3, 26, 19, 12, 15, 28, 3, 18, 15, 12, 30, 18, 31, 32, 19, 33, 20, 1, 5, 26, 26, 37, 37, 2, 4, 1, 14, 13, 15, 14, 42, 41, 19, 26, 12, 15, 3, 11, 15, 1, 15, 15, 26, 26], 'value': [124.729, 0.597, 26.862, 280.322, 81.144, 35, 35, 11.606, 63.965, 75.571, 10.639, 22.505, 46.184, 104.453, 113.726, 27.14, 342.165, 37.797, 4.412, 40.858, 56.691, 7.863, 90.008, 93.494, 40.719, 82.233, 0.129, 1.401, 151.891, 2.096, 48.58, 7.013, 20.897, 6.242, 20.897, 6.995, 121.066, 128.69, 135.835, 14.458, 206.267, 3.64, 33.218, 4.413, 14.375, 122.952, 500, 139.978, 504.287, 107.703, 611.99, 56.587, 77.81, 193.026, 70.672, 59.901, 19.263, 19.263, 59.901, 0.882, 400.12, 46.477, 525.531, 787.129, 79.329, 9.452, 182.01, 19.013, 289.366, 100, 100], 'color': ['rgba(0,0,96,0.2)', 'rgba(0,0,96,0.2)', 'rgba(0,0,96,0.2)', 'rgba(0,0,96,0.2)', 'rgba(0,0,96,0.2)', 'rgba(0,0,96,0.2)', 'rgba(0,0,96,0.2)', 'rgba(0,0,96,0.2)', 'rgba(0,0,96,0.2)', 'rgba(0,0,96,0.2)', 'rgba(0,0,96,0.2)', 'rgba(0,0,96,0.2)', 'rgba(0,0,96,0.2)', 'rgba(0,0,96,0.2)', 'rgba(0,0,96,0.2)', 'rgba(0,0,96,0.2)', 'rgba(0,0,96,0.2)', 'rgba(0,0,96,0.2)', 'rgba(0,0,96,0.2)', 'rgba(0,0,96,0.2)', 'rgba(0,0,96,0.2)', 'rgba(0,0,96,0.2)', 'rgba(0,0,96,0.2)', 'rgba(0,0,96,0.2)', 'rgba(0,0,96,0.2)', 'rgba(0,0,96,0.2)', 'rgba(0,0,96,0.2)', 'rgba(0,0,96,0.2)', 'rgba(0,0,96,0.2)', 'rgba(0,0,96,0.2)', 'rgba(0,0,96,0.2)', 'rgba(0,0,96,0.2)', 'rgba(0,0,96,0.2)', 'rgba(0,0,96,0.2)', 'rgba(0,0,96,0.2)', 'rgba(0,0,96,0.2)', 'rgba(0,0,96,0.2)', 'rgba(0,0,96,0.2)', 'rgba(0,0,96,0.2)', 'rgba(0,0,96,0.2)', 'rgba(0,0,96,0.2)', 'rgba(0,0,96,0.2)', 'rgba(0,0,96,0.2)', 'rgba(0,0,96,0.2)', 'rgba(0,0,96,0.2)', 'rgba(0,0,96,0.2)', 'rgba(33,102,172,0.35)', 'rgba(178,24,43,0.35)', 'rgba(0,0,96,0.2)', 'rgba(0,0,96,0.2)', 'rgba(0,0,96,0.2)', 'rgba(0,0,96,0.2)', 'rgba(0,0,96,0.2)', 'rgba(0,0,96,0.2)', 'rgba(0,0,96,0.2)', 'rgba(0,0,96,0.2)', 'rgba(0,0,96,0.2)', 'rgba(0,0,96,0.2)', 'rgba(0,0,96,0.2)', 'rgba(0,0,96,0.2)', 'rgba(0,0,96,0.2)', 'rgba(0,0,96,0.2)', 'rgba(0,0,96,0.2)', 'rgba(0,0,96,0.2)', 'rgba(0,0,96,0.2)', 'rgba(0,0,96,0.2)', 'rgba(0,0,96,0.2)', 'rgba(0,0,96,0.2)', 'rgba(0,0,96,0.2)', 'lightgreen', 'goldenrod'], 'label': ['stream 1', '', '', '', 'stream 1', '', '', '', '', '', '', '', '', '', '', '', '', '', '', '', '', '', '', '', '', '', '', '', '', '', 'stream 1', '', '', '', '', '', '', '', '', '', '', '', '', '', '', '', 'Old generation plant (made-up)', 'New generation plant (made-up)', '', '', '', '', '', '', '', '', '', '', '', '', '', '', '', '', '', '', '', '', '', '', '']}}], 'layout': {'title': {'text': "Energy forecast for 2050, UK — Department of Energy & Climate Change<br>Imperfect copy of <a href='https://bost.ocks.org/mike/sankey/'>Mike Bostock's example</a><br>with numerous <a href='https://plotly.com/javascript/'>Plotly</a> features"}, 'width': 1118, 'height': 772, 'font': {'size': 10}, 'updatemenus': [{'y': 1, 'buttons': [{'label': 'Light', 'method': 'relayout', 'args': ['paper_bgcolor', 'white']}, {'label': 'Dark', 'method': 'relayout', 'args': ['paper_bgcolor', 'black']}]}, {'y': 0.9, 'buttons': [{'label': 'Thick', 'method': 'restyle', 'args': ['node.thickness', 15]}, {'label': 'Thin', 'method': 'restyle', 'args': ['node.thickness', 8]}]}, {'y': 0.8, 'buttons': [{'label': 'Small gap', 'method': 'restyle', 'args': ['node.pad', 15]}, {'label': 'Large gap', 'method': 'restyle', 'args': ['node.pad', 20]}]}, {'y': 0.7, 'buttons': [{'label': 'Snap', 'method': 'restyle', 'args': ['arrangement', 'snap']}, {'label': 'Perpendicular', 'method': 'restyle', 'args': ['arrangement', 'perpendicular']}, {'label': 'Freeform', 'method': 'restyle', 'args': ['arrangement', 'freeform']}, {'label': 'Fixed', 'method': 'restyle', 'args': ['arrangement', 'fixed']}]}, {'y': 0.6, 'buttons': [{'label': 'Horizontal', 'method': 'restyle', 'args': ['orientation', 'h']}, {'label': 'Vertical', 'method': 'restyle', 'args': ['orientation', 'v']}]}]}}

'''

app = dash.Dash(__name__)

app.layout = html.Div([
    dcc.Graph(id="graph"),
    html.P("Opacity"),
    dcc.Slider(id='opacity', min=0, max=1,
               value=0.5, step=0.1)
])

@app.callback(
    Output("graph", "figure"),
    [Input("opacity", "value")])
def display_sankey(opacity):
    opacity = str(opacity)

    # override gray link colors with 'source' colors
    node = data['data'][0]['node']
    link = data['data'][0]['link']

    # Change opacity
    node['color'] = [
        'rgba(255,0,255,{})'.format(opacity)
        if c == "magenta" else c.replace('0.8', opacity)
        for c in node['color']]

    link['color'] = [
        node['color'][src] for src in link['source']]

    fig = go.Figure(go.Sankey(link=link, node=node))
    fig.update_layout(font_size=10)

    return fig

app.run_server(debug=True)

4.6 风格桑基图
此示例还使用悬停模式来启用多个工具提示。
import plotly.graph_objects as go
import urllib, json

url = 'https://raw.githubusercontent.com/plotly/plotly.js/master/test/image/mocks/sankey_energy.json'
# response = urllib.request.urlopen(url)
# data = json.loads(response.read())
with open('f:/sankey_energy.json', encoding='utf-8') as f:
    data = json.load(f)

fig = go.Figure(data=[go.Sankey(
    valueformat = ".0f",
    valuesuffix = "TWh",
    node = dict(
      pad = 15,
      thickness = 15,
      line = dict(color = "black", width = 0.5),
      label =  data['data'][0]['node']['label'],
      color =  data['data'][0]['node']['color']
    ),
    link = dict(
      source =  data['data'][0]['link']['source'],
      target =  data['data'][0]['link']['target'],
      value =  data['data'][0]['link']['value'],
      label =  data['data'][0]['link']['label']
  ))])

fig.update_layout(
    hovermode = 'x',
    title="Energy forecast for 2050<br>Source: Department of Energy & Climate Change, Tom Counsell via <a href='https://bost.ocks.org/mike/sankey/'>Mike Bostock</a>",
    font=dict(size = 10, color = 'white'),
    plot_bgcolor='black',
    paper_bgcolor='black'
)

fig.show()


![[python][GUI]pyside6](https://img-blog.csdnimg.cn/32af99be58cd407f9346a54709e366aa.png)

![[python] PyMouse、PyKeyboard用python操作鼠标和键盘](https://img-blog.csdnimg.cn/img_convert/7596c1e3a2b1beb74761a00d22e272a3.png)