HQChart使用教程97-K线X轴滚动条
- 效果图
- 创建步骤
- 1. 创建滚动条div
- 2. 初始化滚动条实例
- 3. 配置滚动条属性
- 4. 创建滚动条
- 5. K线图和滚动条绑定
- 6. 滚动条显示位置
- 完整示例
- HQChart代码地址
效果图
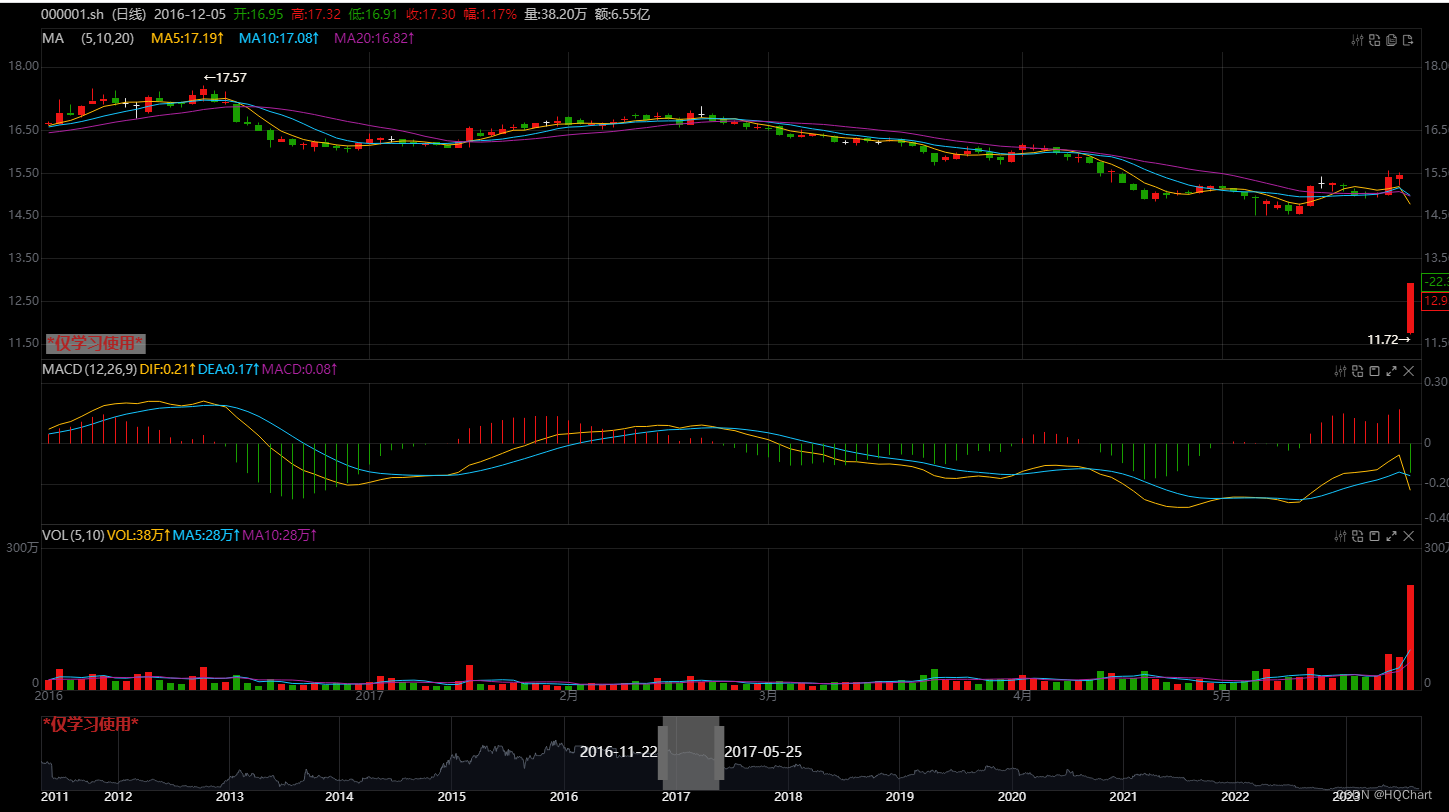
示例地址:https://jones2000.github.io/HQChart/webhqchart.demo/samples/kline_scrrollbar.html
创建步骤
1. 创建滚动条div
滚动条是一个独立的画布, 所有需要新建一个新的div
<body>
    <div id="kline"></div>
    <div id="kscrollbar"></div>   <!-- K线滚动条div -->
...........................
2. 初始化滚动条实例
this.Scrollbar=JSScrollBarChart.Init(document.getElementById('kscrollbar'))
3. 配置滚动条属性
//一下是滚动条option里包含的属性
this.ScrollbarOption=
{
    Border: //边框
    {
        Left:50,         //左边间距
        Right:50,       //右边间距
        Bottom:25,      //底部间距
        Top:1,         //顶部间距

        AutoLeft:true,
        AutoRight:true

    },

    OnCreatedCallback:null, //滚动条创建完成以后回调
    DelayDragFrequency:50,  //拖动延时处理毫秒
}
4. 创建滚动条
通过setoption来创建滚动条
this.Create=function()
{
....
	this.Scrollbar.SetOption(this.ScrollbarOption);
......
}
5. K线图和滚动条绑定
在创建完K线图和滚动条以后需要互相绑定,这样两个图形才能互相联动.
通过OnCreatedCallback创建完成回调函数来完成绑定
 this.Create=function()  //创建图形
{
    this.ScrollbarOption.OnCreatedCallback=(chart)=> { this.OnCreateScrollBar(chart); }
    this.Scrollbar.SetOption(this.ScrollbarOption);

   ......
    this.Option.OnCreatedCallback=(chart)=> { this.OnCreateHQChart(chart); }
    this.Chart.SetOption(this.Option);  //设置K线配置
}

 this.OnCreateHQChart=function(chart)
 {
      chart.ScrollBar=this.Scrollbar;
  }

  this.OnCreateScrollBar=function(chart)
  {
      chart.HQChart=this.Chart;
  }
6. 滚动条显示位置
this.Create=function()  //创建图形
{
   ......
   var self=this;
   $(window).resize(function() { self.OnSize( ); });    //绑定窗口大小变化事件
   .......
}


this.OnSize=function(option)  //自适应大小调整
{
     var height= $(window).height()-150;
     var width = $(window).width();

     this.DivKLine.style.top='0px';
     this.DivKLine.style.left='0px';
     this.DivKLine.style.width=width+'px';
     this.DivKLine.style.height=height+'px';
     this.Chart.OnSize(option);

     this.DivScrollBar.style.width=width+'px';
     this.DivScrollBar.style.height='100px';	//高度100的滚动条
     this.Scrollbar.OnSize(option);
 }
完整示例
<!DOCTYPE html PUBLIC "-//W3C//DTD XHTML 1.0 Transitional//EN" "http://www.w3.org/TR/xhtml1/DTD/xhtml1-transitional.dtd">
<html xmlns="http://www.w3.org/1999/xhtml">
<head>
<meta name="viewport" content="width=device-width, initial-scale=1.0, minimum-scale=1.0, maximum-scale=1.0, user-scalable=no" />
<meta http-equiv="Content-Type" content="text/html; charset=utf-8" />

<title>K线滚动条</title>
    <!-- 加载资源 -->
    <link rel="stylesheet" href="../jscommon/umychart.resource/css/tools.css" />
    <link rel="stylesheet" href="../jscommon/umychart.resource/font/iconfont.css" />
</head>
<body>
    <div id="kline"></div>
    <div id="kscrollbar"></div>

    <div>
        <span id='button_1' class="btn-style">切换股票</span>
        <span id='button_3' class="btn-style">窗口个数</span>
        <span id='button_4' class="btn-style">叠加指标</span>
        <span id='button_5' class="btn-style">切换指标</span>
        <span id='button_6' class="btn-style">切换自定义指标</span>
        <span id='button_7' class="btn-style">RSI</span>
        <span id='button_8' class="btn-style">移动指标[下]</span>
        <span id='button_9' class="btn-style" >移动指标[上]</span>
        <span id='button_10' class="btn-style">移动指标[新窗口]</span>
        <span id='button_11' class="btn-style">多语言</span>
    </div>

    <script src="../jscommon/umychart.resource/js/jquery.min.js"></script>
    <script src='../jscommon/umychart.console.js'></script>     <!-- 日志输出 -->
    <script src="../jscommon/umychart.network.js"></script>     <!-- 网络请求分装 -->
    <script src="../jscommon/umychart.js"></script>             <!-- K线图形 -->
    <script src="../jscommon/umychart.complier.js"></script>    <!-- 麦语言解析执行器 -->
    <script src="../jscommon/umychart.index.data.js"></script>  <!-- 基础指标库 -->
    <script src="../jscommon/umychart.style.js"></script>       <!-- 白色风格和黑色风格配置信息 -->
    <script src="../jscommon/umychart.scrollbar.js"></script>   <!-- 滚动条 -->

    <script src="../jscommon/umychart.NetworkFilterTest.js"></script>

    <script>
        MARKET_SUFFIX_NAME.GetMarketStatus = function (symbol) { return 2; }

        //简单的把K线控件封装下
        function KLineChart(divKLine, divScrollBar)
        {
            this.DivKLine=divKLine;
            this.Chart=JSChart.Init(divKLine);   //把K线图绑定到一个Div上

            this.DivScrollBar=divScrollBar;
            this.Scrollbar=JSScrollBarChart.Init(divScrollBar)

            //K线配置信息
            this.Option= {
                Type:'历史K线图',   //创建图形类型
                //Type:'历史K线图横屏',

                //EnableBorderDrag:false,

                Windows: //窗口指标
                [
                    {Index:"MA" , OverlayIndexType:{ Position:1, LineSpace:3 }, Overlay:true , Export:true, IndexParamSpace:15, IndexTitleSpace:15},
                    //{Index:"OX", Args:[ { Name:'Reversal', Value:3 } ] },
                    {Index:"MACD",OverlayIndexType:{ Position:1, LineSpace:3 }},
                    {Index:"VOL", OverlayIndexType:{ Position:1, LineSpace:3 }},

                ],


                OverlayIndex:
                [
                   // { Index:'两融余额', Windows:1 ,Args:[ { Name:'N', Value:5} ] , ShowRightText:false},
                   // {Index:'MA', Windows:0 , IsShareY:true, ShowRightText:true },
                    //{Index:'RSI', Windows:0, ShowRightText:true },
                    //{ Index:'BOLL', Windows:0, ShowRightText:true,IsShareY:true, ShowToolbar:true },
                    //{Windows:0, IndexName:"指标ID", Name:"自定义指标", Script:"DRAWTEXT(CLOSE<OPEN,H,14),VALIGN2,ALIGN1,YMOVE(-10), XMOVE(5);", Identify:"guid_66990",ShowRightText:true,IsShareY:true }
                    //{Index:'MA5', Windows:1 ,ShowRightText:true}
                    //{Index:"VOL_OVERLAY", Windows:0 },
                ],  //叠加指标


                //OverlayIndexFrameWidth:1,

                //DragDownload: { Day:{ Enable:true } , Minute:{ Enable:true }},

                EnableYDrag:
                {
                    Right:true,
                    Left:true,
                },

                Symbol:"000001.sh",
                IsAutoUpdate:false,       //是自动更新数据
                AutoUpdateFrequency:10000,   //数据更新频率

                SplashTitle:'加载数据中......',

                IsShowRightMenu:true,          //右键菜单
                //CorssCursorTouchEnd:true,
                //IsClickShowCorssCursor:true,
                //IsCorssOnlyDrawKLine:true,

                CtrlMoveStep:10,

                EnableVerifyRecvData:true,

                CorssCursorInfo: { Right:2, DateFormatType:3, HPenType:1, VPenType:1 ,VLineType:0,RightButton:{ Enable:true }, IsShowCorss:true, PriceFormatType:0, DataFormatType:0 },
                EnableZoomIndexWindow:true,

                KLine:  //K线设置
                {
                    DragMode:1,                 //拖拽模式 0=禁止拖拽 1=数据拖拽 2=区间选择
                    Right:0,                    //复权 0 不复权 1 前复权 2 后复权
                    Period:0,                   //周期 0 日线 1 周线 2 月线 3 年线
                    MaxRequestDataCount:2000,   //数据个数
                    MaxRequestMinuteDayCount:5, //分钟数据获取几天数据  默认取5天数据
                    PageSize:30,               //一屏显示多少数据
                    //Info:["互动易","大宗交易",'龙虎榜',"调研","业绩预告","公告"],       //信息地雷
                    //Info:["公告"],
                    IsShowTooltip:true,                 //是否显示K线提示信息
                    DrawType:0,      //K线类型 0=实心K线柱子 1=收盘价线 2=美国线 3=空心K线柱子 4=收盘价面积图
                    //FirstShowDate:20161201,
                    KLineDoubleClick:false, //禁止双击弹框
                    RightSpaceCount:5,
                    ZoomType:0,

                    //DataWidth:5
                    ShowKLine:true,
                },

                StepPixel:0,

                IsDrawPictureXY:true,

                SelectedChart:{ EnableSelected: true, EnableMoveOn:true },
                EnableIndexChartDrag:true,

                KLineTitle: //标题设置
                {
                    IsShowName:true,       //不显示股票名称
                    IsShowSettingInfo:true //不显示周期/复权
                },

                EnableYDrag:
                {
                    Right:true,
                    Left:true,
                },

                Border: //边框
                {
                    Left:50,         //左边间距
                    Right:90,       //右边间距
                    Bottom:25,      //底部间距
                    Top:25,         //顶部间距

                    AutoLeft:{ Blank:10, MinWidth:30 },
                    AutoRight:{ Blank:5, MinWidth:40 },
                },

                Frame:  //子框架设置
                [
                    {
                        SplitCount:6,StringFormat:0, IsShowLeftText:true,

                        Custom:
                        [
                            {
                                Type:0,
                                Position:'right',LineType:1 //CountDown:true
                                //PositionEx:1,
                            },

                            {
                                Type:2,
                                Position:'right',LineType:-1 //CountDown:true
                                //PositionEx:1,
                            },

                            {
                                Type:3,
                                Position:'right',LineType:-1, //CountDown:true
                                //PositionEx:1,
                            },

                            {
                                Type:1,
                                Position:'right',LineType:1,
                                Data:[{ Value:7.22, Color:"rgb(50,100,100)", TextColor:"rgb(100,0,0)", Text:[{Text:"第1行"}, {Text:"第2行"}]}]
                            },
                        ]
                    },

                    { SplitCount:5, IsShowLeftText:false, IsShowXLine:true,
                        Custom:
                        [
                            {
                                Type:2,
                                Position:'right',LineType:-1 //CountDown:true
                                //PositionEx:1,
                            }
                        ]
                    },

                    {
                        Custom:
                        [
                            {
                                Type:2,
                                Position:'right',LineType:-1 //CountDown:true
                                //PositionEx:1,
                            }
                        ]
                    }
                ],

                ExtendChart:    //扩展图形
                [
                    //{Name:'KLineTooltip' },  //手机端tooltip
                    //{Name:"FrameSplitPaint", LineColor:"rgb(200,0,0)" }
                ],


                Overlay:
                [
                    //{Symbol:'399300.sz', DrawType:1, Color:'rgb(0,0,255)'},
                    //{ Symbol:'600999.sh' }
                ],
            };

            this.ScrollbarOption=
            {
                Border: //边框
                {
                    Left:50,         //左边间距
                    Right:50,       //右边间距
                    Bottom:25,      //底部间距
                    Top:1,         //顶部间距

                    AutoLeft:true,
                    AutoRight:true

                },

                DelayDragFrequency:50,
            }

            this.Create=function()  //创建图形
            {
                var self=this;
                //$(window).resize(function() { self.OnSize( {Type:1} ); });    //绑定窗口大小变化事件
                $(window).resize(function() { self.OnSize( ); });    //绑定窗口大小变化事件

                var blackStyle=HQChartStyle.GetStyleConfig(STYLE_TYPE_ID.BLACK_ID); //读取黑色风格配置
                //blackStyle.DRAWICON={ MinSize:20 , MaxSize:60};
                blackStyle.DrawPicture.PointType=1;


                JSChart.SetStyle(blackStyle);
                this.DivKLine.style.backgroundColor=blackStyle.BGColor; //设置最外面的div背景
                this.DivScrollBar.style.backgroundColor=blackStyle.BGColor; //设置最外面的div背景

                //JSChart.GetResource().FrameLogo.Text=null;
                JSChart.GetResource().ToolbarButtonStyle=1;

                this.OnSize();  //让K线全屏

                this.ScrollbarOption.OnCreatedCallback=(chart)=> { this.OnCreateScrollBar(chart); }
                this.Scrollbar.SetOption(this.ScrollbarOption);

                this.Option.NetworkFilter=(data, callback)=>{ this.NetworkFilter(data, callback); }
                this.Option.OnCreatedCallback=(chart)=> { this.OnCreateHQChart(chart); }
                this.Chart.SetOption(this.Option);  //设置K线配置
            }

            this.NetworkFilter=function(data, callback)
            {
                console.log('[NetworkFilter] data', data);

                HQData.NetworkFilter(data, callback);
            }

            this.OnSize=function(option)  //自适应大小调整
            {
                var height= $(window).height()-150;
                var width = $(window).width();
                //width=50000;
                this.DivKLine.style.top='0px';
                this.DivKLine.style.left='0px';
                this.DivKLine.style.width=width+'px';
                this.DivKLine.style.height=height+'px';
                this.Chart.OnSize(option);

                this.DivScrollBar.style.width=width+'px';
                this.DivScrollBar.style.height='100px';
                this.Scrollbar.OnSize(option);
            }

            this.ChangeSymbol=function(symbol)
            {
                this.Chart.ChangeSymbol(symbol);
            }

            this.OnCreateHQChart=function(chart)
            {
                chart.ScrollBar=this.Scrollbar;
            }

            this.OnCreateScrollBar=function(chart)
            {
                chart.HQChart=this.Chart;
            }
        }

        $(function ()
        {
            var klineControl=new KLineChart(document.getElementById('kline'),document.getElementById('kscrollbar'));
            klineControl.Create();

            $("#button_1").click(function() { klineControl.ChangeSymbol("000001.sz"); } );
        })

    </script>
</body>
</html>


<style>

#kline
{
    width: 900px;
    height:400px;
    position: relative;
    /*margin-top: 100px;*/
}

.btn-style
{
    padding: 3px 8px;
    border: 1px solid #ececec;
    border-radius: 5px;
    background-color: #f5f5f5;
    cursor: pointer;
}


</style>
HQChart代码地址
地址:github.com/jones2000/HQChart
