今日首先介绍前端技术Apache ECharts,说明后端需要准备的数据,然后讲解具体统计功能的实现,包括营业额统计、用户统计、订单统计、销量排名。
一、ECharts
是什么
ECharts是一款基于 Javascript 的数据可视化图表库。我们用它来展示图表数据。
入门案例
步骤
1). 引入echarts.js 文件
2). 为 ECharts 准备一个设置宽高的 DOM
3). 初始化echarts实例
4). 指定图表的配置项和数据
5). 使用指定的配置项和数据显示图表
代码
js文件在黑马对应项目自取。
测试用的html代码:
<!DOCTYPE html>
<html>
  <head>
    <meta charset="utf-8" />
    <title>ECharts</title>
    <!-- 引入刚刚下载的 ECharts 文件 -->
    <script src="echarts.js"></script>
  </head>
  <body>
    <!-- 为 ECharts 准备一个定义了宽高的 DOM -->
    <div id="main" style="width: 600px;height:400px;"></div>
    <script type="text/javascript">
      // 基于准备好的dom,初始化echarts实例
      var myChart = echarts.init(document.getElementById('main'));

      // 指定图表的配置项和数据
      var option = {
        title: {
          text: '班级出勤人数'
        },
        tooltip: {},
        legend: {

          data: ['人数']
        },
        xAxis: {
          type: 'category',
          data: ['星期1', '星期2', '星期3', '星期4', '星期5']
        },
        yAxis: {
          type: 'value'
        },
        series: [
          {
            name: '人数',
            type: 'line',
            data: [160, 71, 66, 73, 68],
            smooth: true

          }
        ]
      };

      // 使用刚指定的配置项和数据显示图表。
      myChart.setOption(option);
    </script>
  </body>
</html>
结果页面如下:
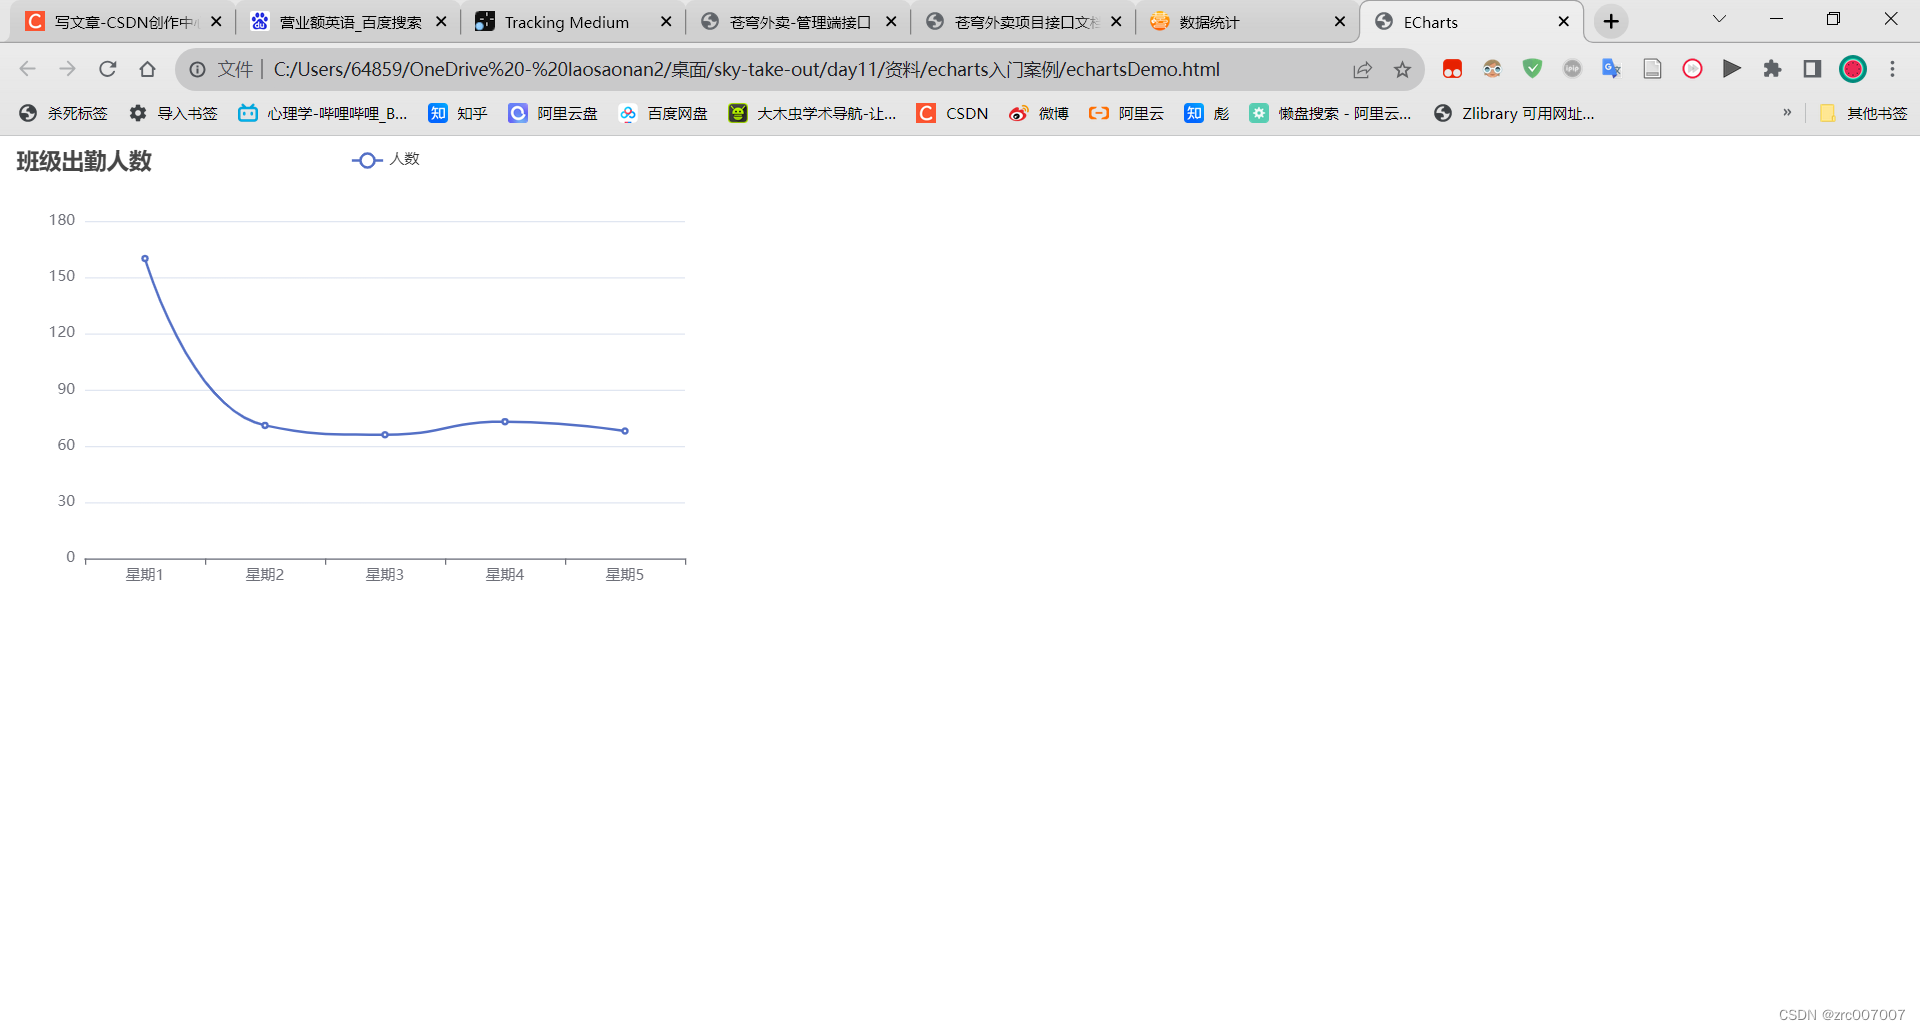
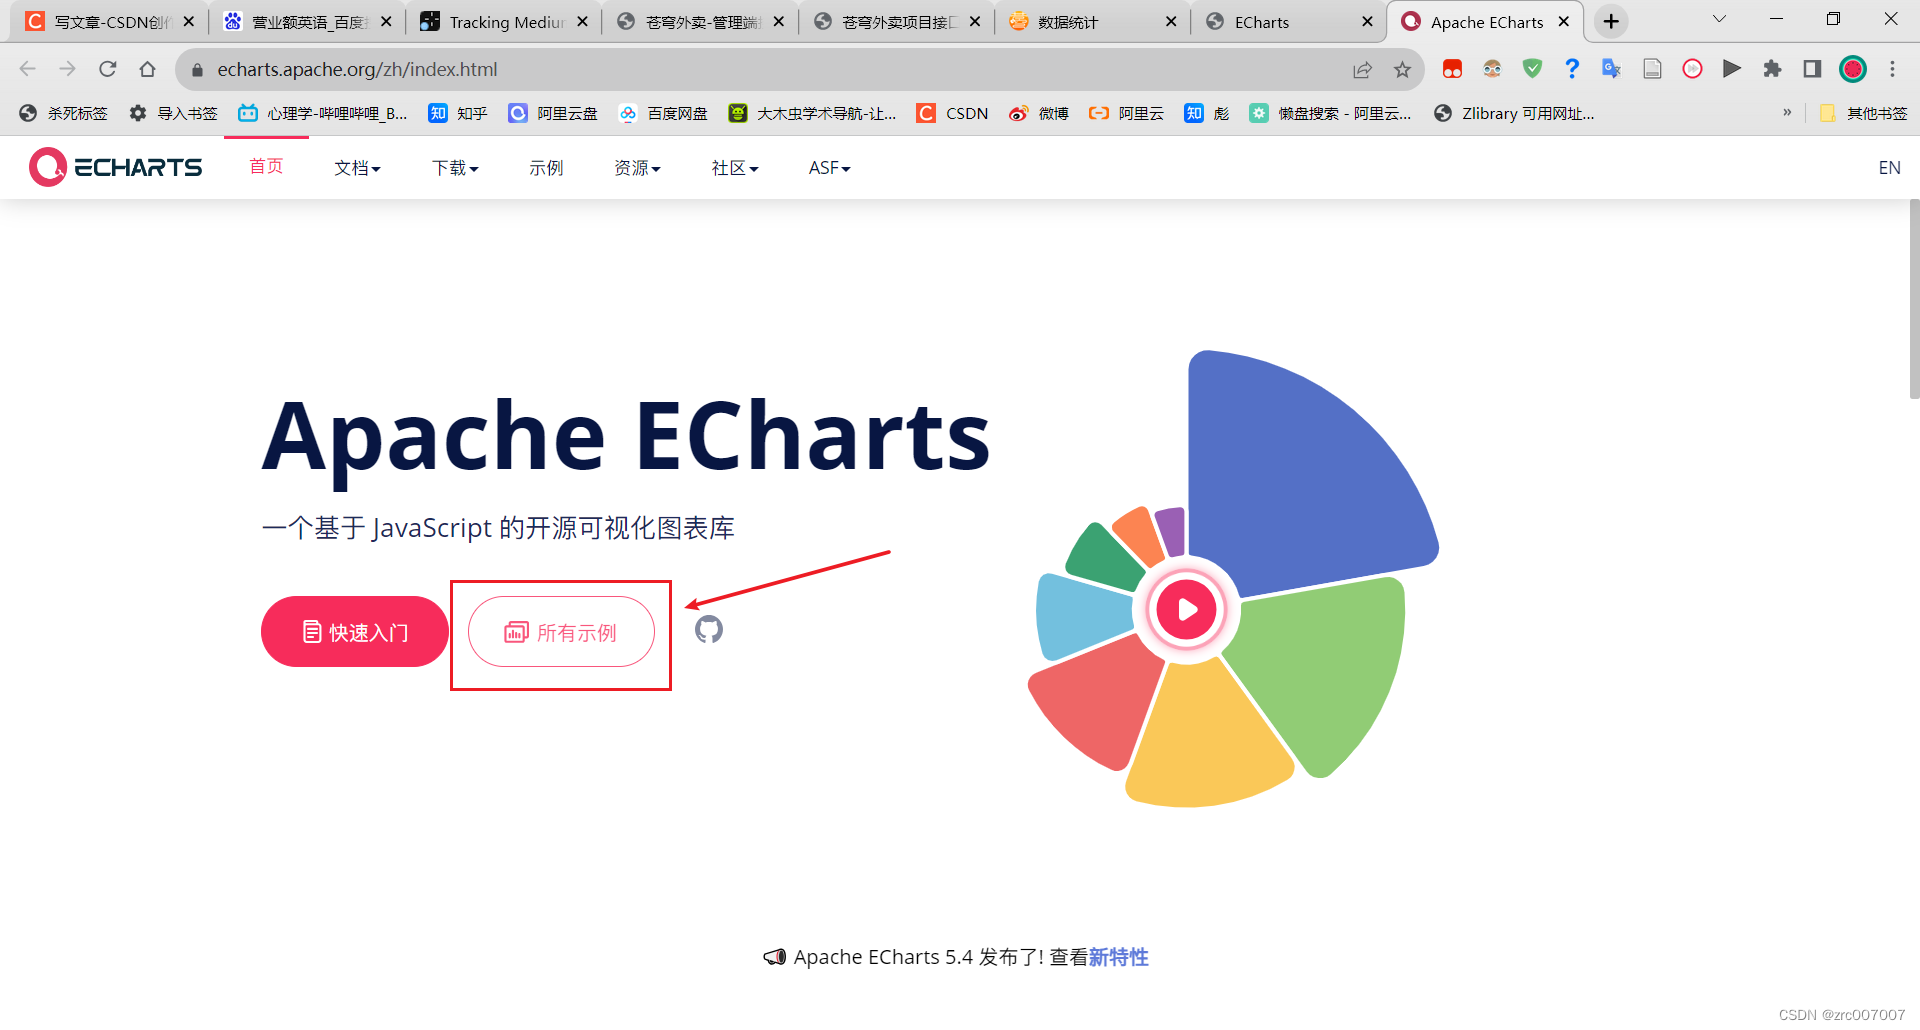
然后我们打开ECharts官网Apache ECharts 选择一个图案来试着改一下。
首先进入官网,点击所有示例。
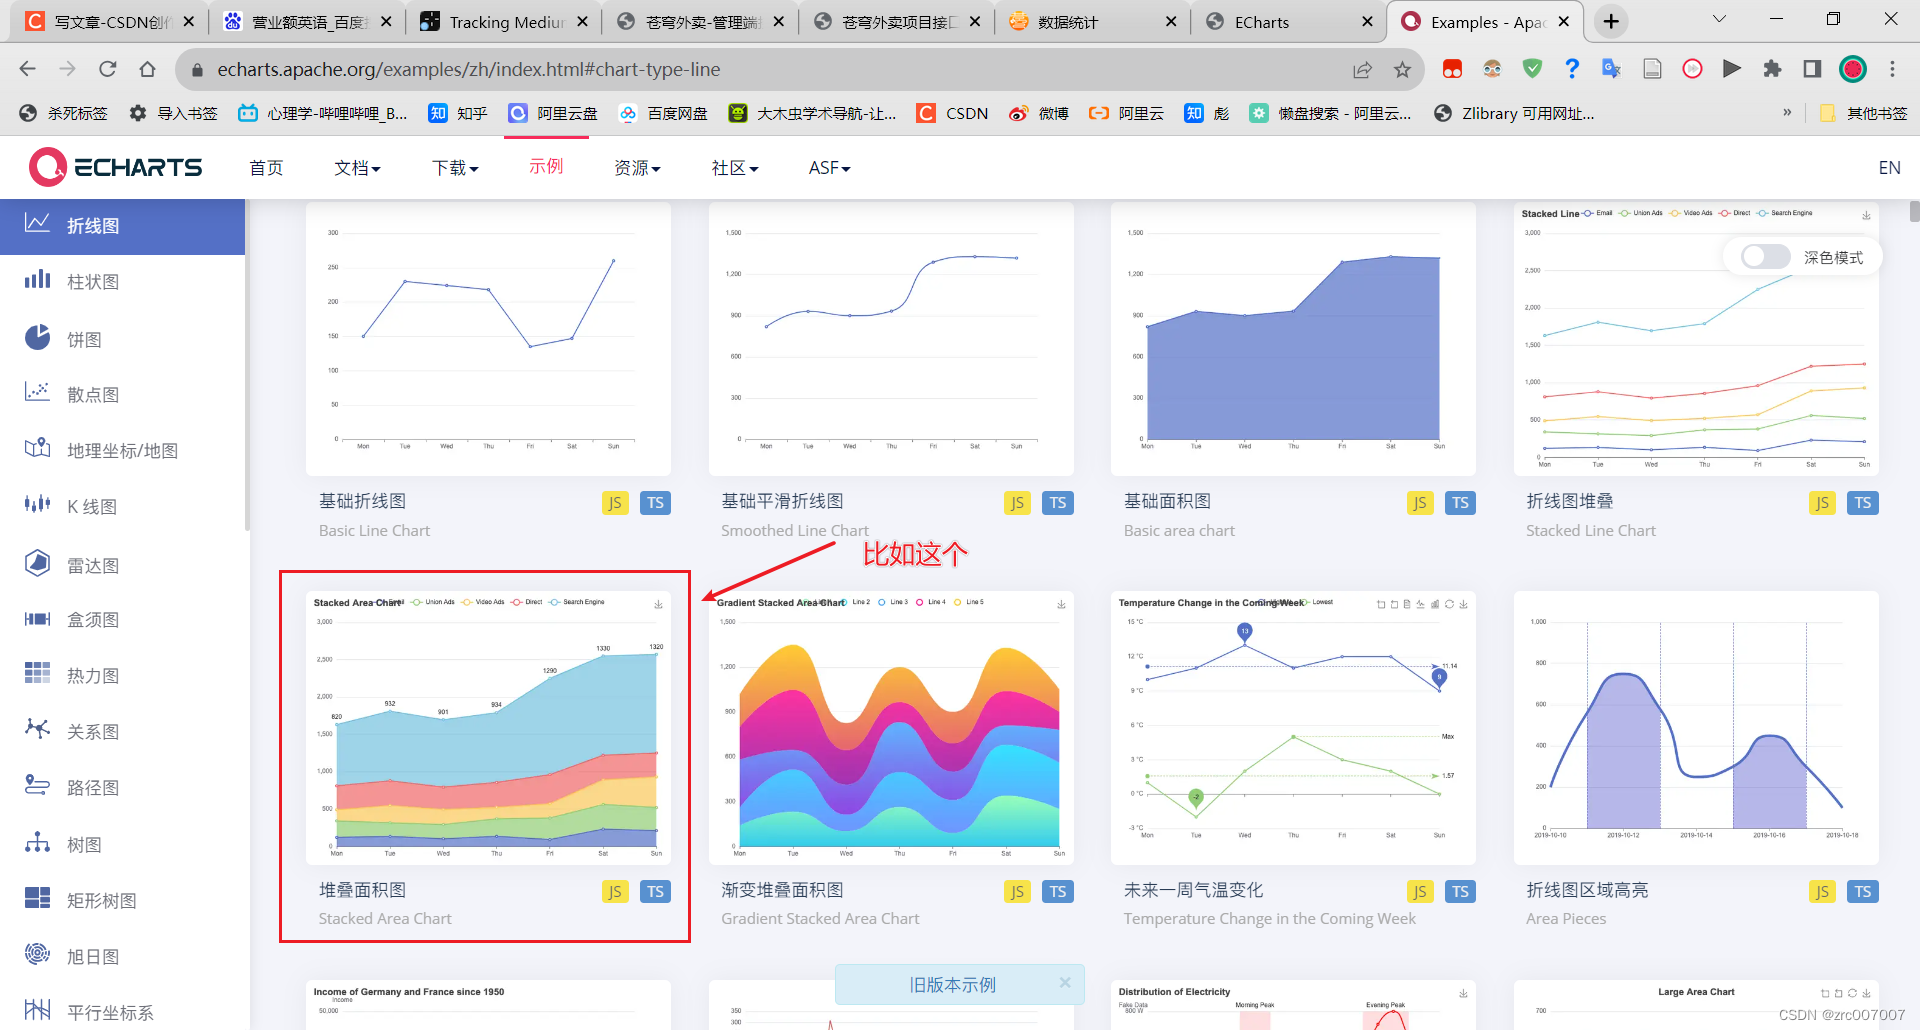
然后点击一个自己喜欢的样式:
复制左边的代码到原代码的option位置:
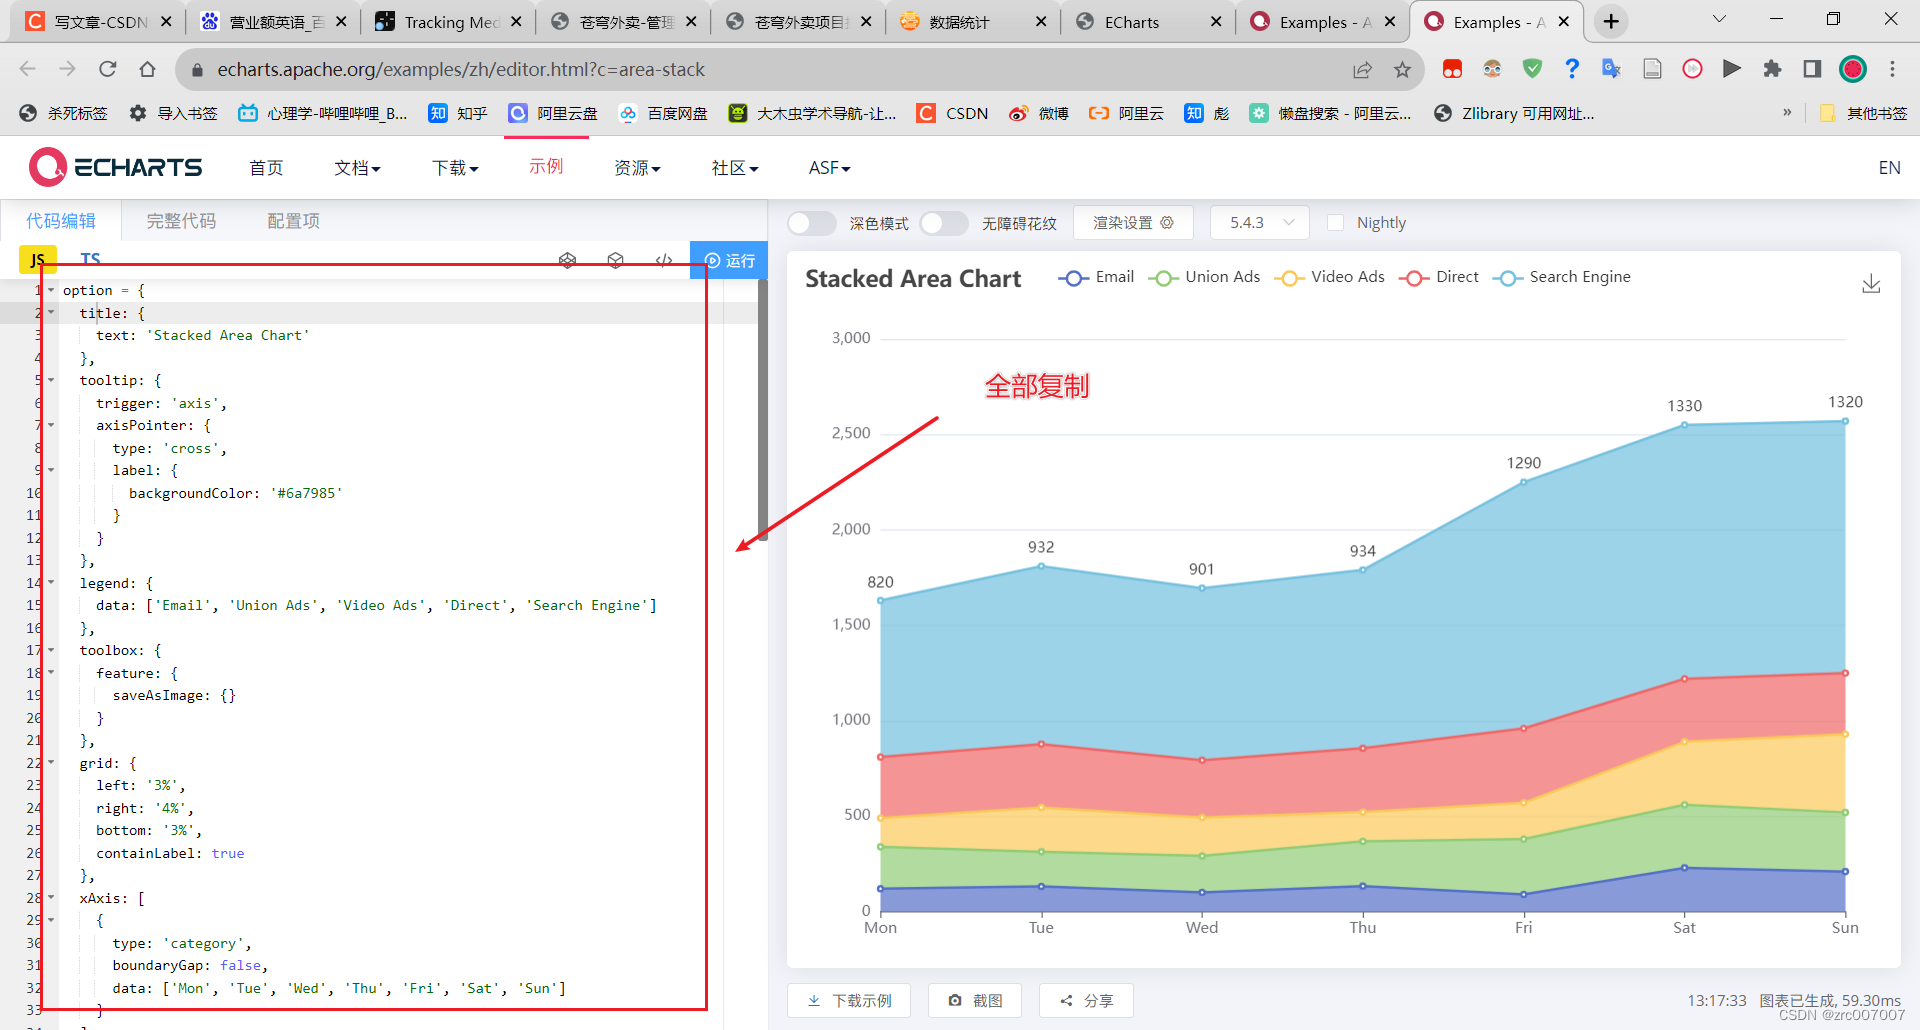
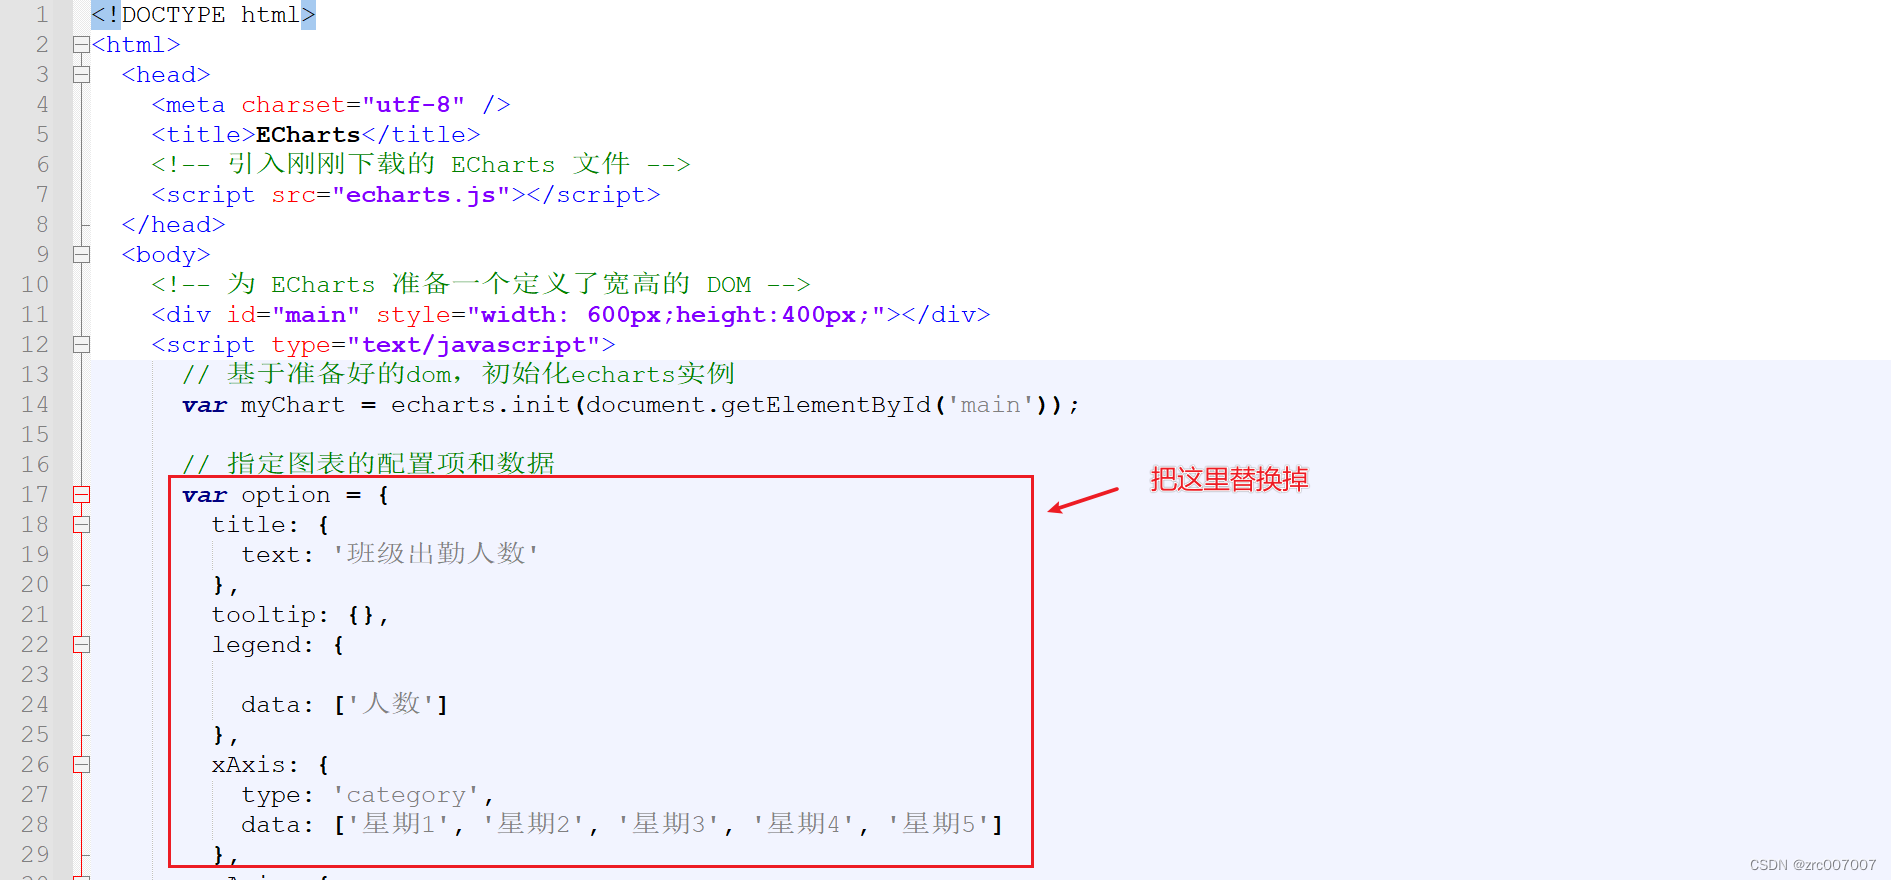
复制后代码如下:
<!DOCTYPE html>
<html>
  <head>
    <meta charset="utf-8" />
    <title>ECharts</title>
    <!-- 引入刚刚下载的 ECharts 文件 -->
    <script src="echarts.js"></script>
  </head>
  <body>
    <!-- 为 ECharts 准备一个定义了宽高的 DOM -->
    <div id="main" style="width: 600px;height:400px;"></div>
    <script type="text/javascript">
      // 基于准备好的dom,初始化echarts实例
      var myChart = echarts.init(document.getElementById('main'));

      // 指定图表的配置项和数据
      var option = {
  title: {
    text: 'Stacked Area Chart'
  },
  tooltip: {
    trigger: 'axis',
    axisPointer: {
      type: 'cross',
      label: {
        backgroundColor: '#6a7985'
      }
    }
  },
  legend: {
    data: ['Email', 'Union Ads', 'Video Ads', 'Direct', 'Search Engine']
  },
  toolbox: {
    feature: {
      saveAsImage: {}
    }
  },
  grid: {
    left: '3%',
    right: '4%',
    bottom: '3%',
    containLabel: true
  },
  xAxis: [
    {
      type: 'category',
      boundaryGap: false,
      data: ['Mon', 'Tue', 'Wed', 'Thu', 'Fri', 'Sat', 'Sun']
    }
  ],
  yAxis: [
    {
      type: 'value'
    }
  ],
  series: [
    {
      name: 'Email',
      type: 'line',
      stack: 'Total',
      areaStyle: {},
      emphasis: {
        focus: 'series'
      },
      data: [120, 132, 101, 134, 90, 230, 210]
    },
    {
      name: 'Union Ads',
      type: 'line',
      stack: 'Total',
      areaStyle: {},
      emphasis: {
        focus: 'series'
      },
      data: [220, 182, 191, 234, 290, 330, 310]
    },
    {
      name: 'Video Ads',
      type: 'line',
      stack: 'Total',
      areaStyle: {},
      emphasis: {
        focus: 'series'
      },
      data: [150, 232, 201, 154, 190, 330, 410]
    },
    {
      name: 'Direct',
      type: 'line',
      stack: 'Total',
      areaStyle: {},
      emphasis: {
        focus: 'series'
      },
      data: [320, 332, 301, 334, 390, 330, 320]
    },
    {
      name: 'Search Engine',
      type: 'line',
      stack: 'Total',
      label: {
        show: true,
        position: 'top'
      },
      areaStyle: {},
      emphasis: {
        focus: 'series'
      },
      data: [820, 932, 901, 934, 1290, 1330, 1320]
    }
  ]
};

      // 使用刚指定的配置项和数据显示图表。
      myChart.setOption(option);
    </script>
  </body>
</html>
页面展示结果如下:

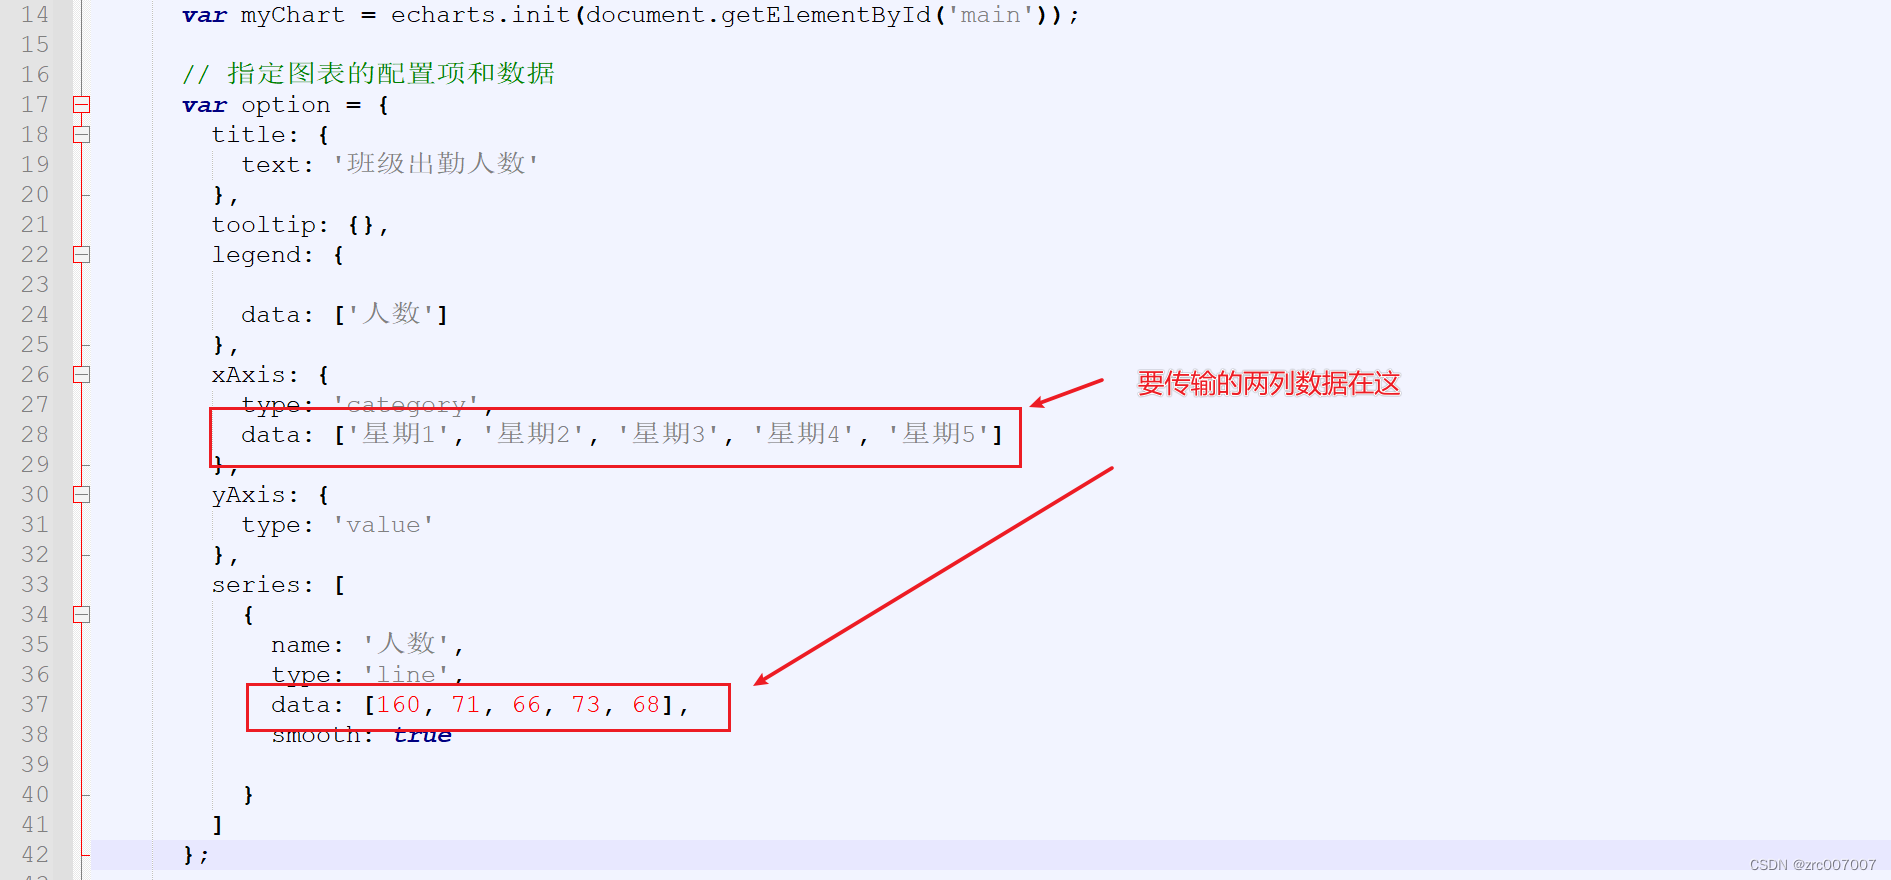
总结
传输的两列数据,分别是下标和数据。在如下位置:
二、营业额统计
查看接口文档

分析
控制层
控制层只要接收数据传给业务层,返回VO(已经有设计好的TurnoverReportVO了)就可以。重点在业务层和持久层。
业务层
具体要处理得到两类,或者说两列数据,包括:
- 日期列表
- 营业额列表
所以步骤便是:
- 获取日期列表
- 获取日期对应的营业额的列表
- 封装返回
持久层
那么持久层需要的操作就在第2步,即:
- 根据日期查找当日营业额
之后几个案例都是大差不差的层次结构,除了数据的种类要求不同。
具体代码
控制层
@RestController
@Slf4j
@Api(tags = "统计相关")
@RequestMapping("/admin/report")
public class ReportController {

    @Autowired
    private ReportService reportService;

    @GetMapping("/turnoverStatistics")
    public Result turnoverStatistics(@DateTimeFormat(pattern = "yyyy-MM-dd") LocalDate begin,
                                     @DateTimeFormat(pattern = "yyyy-MM-dd") LocalDate end) {
        TurnoverReportVO turnoverReportVO = reportService.turnoverStatistics(begin, end);
        return Result.success(turnoverReportVO);
    }
}
业务层
@Service
public class ReportServiceImpl implements ReportService {

    @Autowired
    private OrdersMapper ordersMapper;

    @Override
    public TurnoverReportVO turnoverStatistics(LocalDate begin, LocalDate end) {
        // 1. 获取日期列表
        List<LocalDate> list = getDateList(begin, end);
        // 2. 查询每日营业额
        List<Double> result = new ArrayList<>();
        Double turnover;
        LocalDateTime dayBegin;
        LocalDateTime dayEnd;
        if (list != null && list.size() > 0) {
            dayBegin = LocalDateTime.of(list.get(0), LocalTime.MIN);  // 知识点2和3
            dayEnd = LocalDateTime.of(list.get(0), LocalTime.MAX);  // 知识点2和3
        } else {
            return new TurnoverReportVO();
        }
        for (LocalDate localDate : list) {
            Map<String, Object> map = new HashMap<>();
            map.put("status", Orders.COMPLETED);
            map.put("begin", dayBegin);
            map.put("end", dayEnd);
            turnover = ordersMapper.sumByMap(map);  // 知识点4
            result.add(turnover == null ? 0 : turnover);

            dayBegin = dayBegin.plusDays(1);
            dayEnd = dayEnd.plusDays(1);
        }
        // 3. 返回
        TurnoverReportVO turnoverReportVO = new TurnoverReportVO();
        turnoverReportVO.setDateList(StringUtils.join(list, ","));
        turnoverReportVO.setTurnoverList(StringUtils.join(result, ","));
        return turnoverReportVO;
    }

    private List<LocalDate> getDateList(LocalDate begin, LocalDate end) {
        List<LocalDate> list = new ArrayList<>();
        while (begin.compareTo(end) <= 0) {  // 知识点1
            list.add(begin);
            begin = begin.plusDays(1);
        }
        return list;
    }
}
4个知识点
这里体现了4个知识点:
- 日期之间用compareTo比较
- LocalDate和LocalTime组合成LocalDateTime,用LocalDateTime的of方法
- LocalTime.MIN与LocalTime.MAX
- 用Map封装数据交给mapper查找。
持久层
直接上xml文件了:
elect id="sumByMap" resultType="java.lang.Double">
    select sum(amount)
    from orders
    <where>
        <if test="status!=null and status!=''">
            status = #{status}
        </if>
        <if test="begin!=null and end!=null">
            and order_time between #{begin} and #{end}
        </if>
    </where>
</select>
三、用户统计
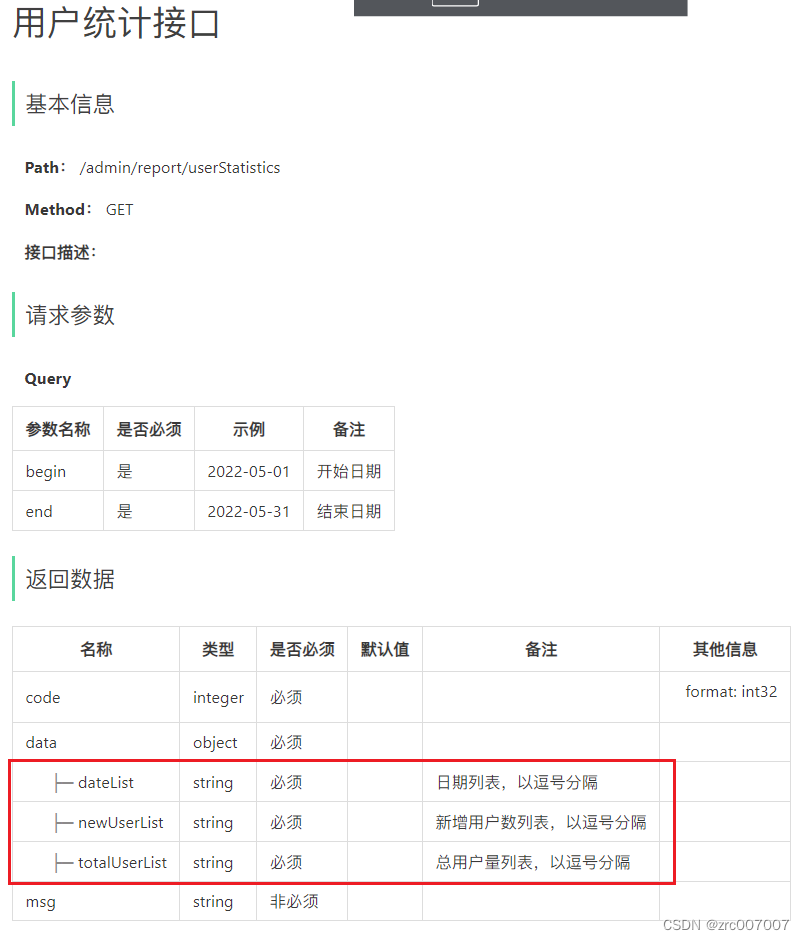
接口文档
分析所需数据
由于三层的架构都大差不差,所以直接介绍所需数据的不同。
- 日期列表
- 新增用户数列表
- 总用户数列表
具体代码
控制层
@GetMapping("/userStatistics")
public Result userStatistics(@DateTimeFormat(pattern = "yyyy-MM-dd") LocalDate begin,
                                 @DateTimeFormat(pattern = "yyyy-MM-dd") LocalDate end) {
    UserReportVO userReportVO = reportService.userStatistics(begin, end);
    return Result.success(userReportVO);
}
业务层
@Override
public UserReportVO userStatistics(LocalDate begin, LocalDate end) {
    // 1. 获取日期列表
    List<LocalDate> dateList = getDateList(begin, end);
    // 2. 获取用户数量列表
    List<Integer> newUserList = new ArrayList<>();
    List<Integer> totalUserList = new ArrayList<>();

    LocalDateTime dayBegin;
    LocalDateTime dayEnd;

    if (dateList != null && dateList.size() > 0) {
        dayBegin = LocalDateTime.of(dateList.get(0), LocalTime.MIN);
        dayEnd = LocalDateTime.of(dateList.get(0), LocalTime.MAX);
    } else {
        return new UserReportVO();
    }
    Integer totalUser;
    Integer newUser;
    for (LocalDate localDate : dateList) {
        Map<String, Object> map = new HashMap<>();
        map.put("end", dayEnd);
        totalUser = userMapper.countByMap(map);
        totalUserList.add(totalUser == null ? 0 : totalUser);
        map.put("begin", dayBegin);
        newUser = userMapper.countByMap(map);
        newUserList.add(newUser == null ? 0 : newUser);

        dayBegin = dayBegin.plusDays(1);
        dayEnd = dayEnd.plusDays(1);
    }
    // 3. 返回
    UserReportVO userReportVO = new UserReportVO();
    userReportVO.setDateList(StringUtils.join(dateList, ","));
    userReportVO.setNewUserList(StringUtils.join(newUserList, ","));
    userReportVO.setTotalUserList(StringUtils.join(totalUserList, ","));
    return userReportVO;
}
3个注意的点
第一点,获取日期列表可以抽取出来,供营业额统计、用户统计共同调用。
小tips,抽取函数的快捷键是 ctrl + alt + m 哦。
第二点,持久层的两次查找,可以巧妙的用一个函数来完成的。用动态sql的if判断,分为有begin时间的判断和没有begin时间的判断进行处理。具体看下面持久层代码。
第三点,两个统计都要判断持久层查到的结果是不是null,是的话要归为0哦。
持久层
<select id="countByMap" resultType="java.lang.Integer">
select count(*) from user
<where>
<if test="end!=null">
and create_time <= #{end}
</if>
<if test="begin!=null">
and create_time >= #{begin}
</if>
</where>
</select>四、订单统计
接口文档
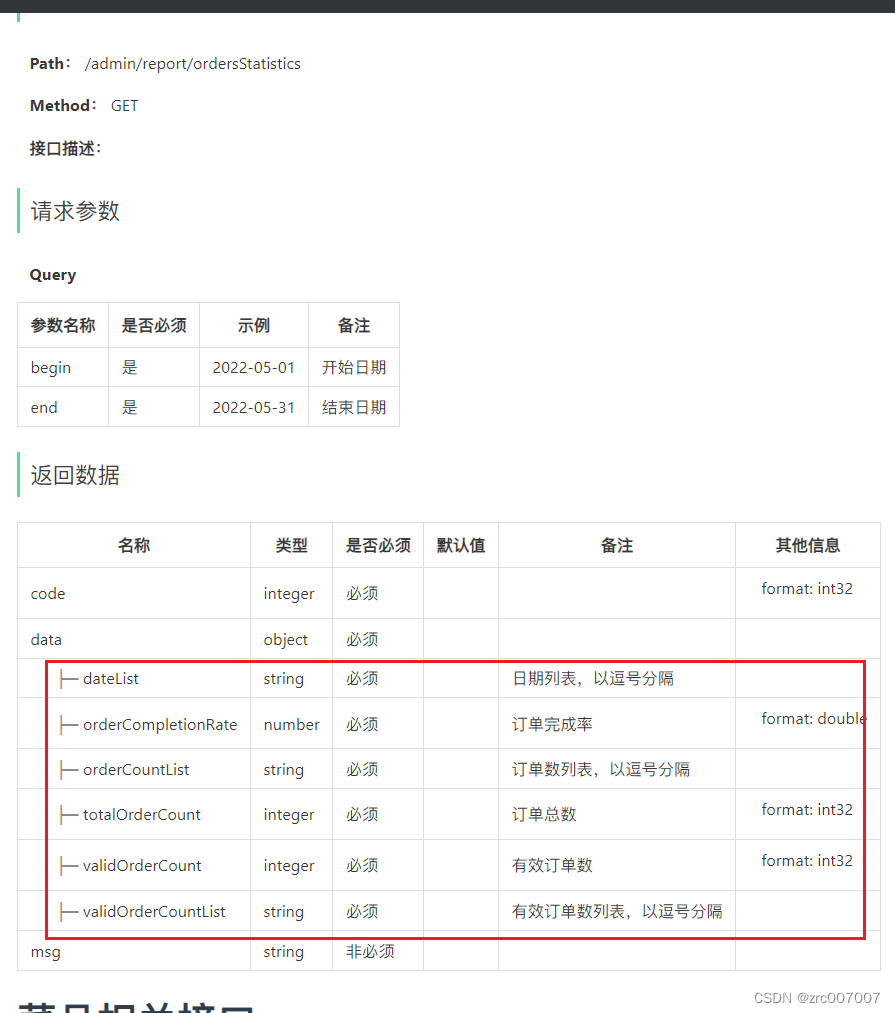
所需数据
- 日期列表
- 所有订单每日总数列表
- 所有订单总数
- 有效订单每日总数列表
- 有效订单总数
- 订单完成率
具体代码
控制层
@GetMapping("/ordersStatistics")
public Result ordersStatistics(@DateTimeFormat(pattern = "yyyy-MM-dd") LocalDate begin,
                               @DateTimeFormat(pattern = "yyyy-MM-dd") LocalDate end) {
    OrderReportVO orderReportVO = reportService.ordersStatistics(begin, end);
    return Result.success(orderReportVO);
}
业务层
@Override
public OrderReportVO ordersStatistics(LocalDate begin, LocalDate end) {
    OrderReportVO orderReportVO = new OrderReportVO();
    // 1. 日期列表
    List<LocalDate> dateList = getDateList(begin, end);
    if (dateList == null) {
        return orderReportVO;
    }
    // 2. 订单数列表
    List<Integer> totalOrderList = new ArrayList<>();
    // 3. 有效订单数列表
    List<Integer> validOrderList = new ArrayList<>();
    // 4. 订单总数
    Integer totalOrderCount = 0;
    // 5. 有效订单总数
    Integer validOrderCount = 0;
    for (LocalDate localDate : dateList) {
        Map map = new HashMap();
        map.put("begin", LocalDateTime.of(localDate, LocalTime.MIN));
        map.put("end", LocalDateTime.of(localDate, LocalTime.MAX));
        Integer total = ordersMapper.countByMap(map);
        total = total == null ? 0 : total;
        map.put("status", Orders.COMPLETED);
        Integer valid = ordersMapper.countByMap(map);
        valid = valid == null ? 0 : valid;
        totalOrderList.add(total);
        validOrderList.add(valid);
        totalOrderCount += total;
        validOrderCount += valid;
    }
    // 6. 订单完成率
    Double completionR = 0.0;
    if (totalOrderCount != null) {
        completionR = validOrderCount * 1.0 / totalOrderCount;
    }

    orderReportVO.setDateList(StringUtils.join(dateList, ","));
    orderReportVO.setOrderCountList(StringUtils.join(totalOrderList, ","));
    orderReportVO.setValidOrderCountList(StringUtils.join(validOrderList, ","));
    orderReportVO.setTotalOrderCount(totalOrderCount);
    orderReportVO.setValidOrderCount(validOrderCount);
    orderReportVO.setOrderCompletionRate(completionR);

    return orderReportVO;
}
1个注意的巩固知识点
还是用动态sql来巧妙的满足一个函数查询两种不同的数据,即status的if判断是否查询。
持久层
<select id="countByMap" resultType="java.lang.Integer">
select count(id) from orders
<where>
<if test="status != null">
and status = #{status}
</if>
<if test="begin != null">
and order_time >= #{begin}
</if>
<if test="end != null">
and order_time <= #{end}
</if>
</where>
</select>没啥好说的,算一个巩固练习。
五、销量排名top10
接口文档
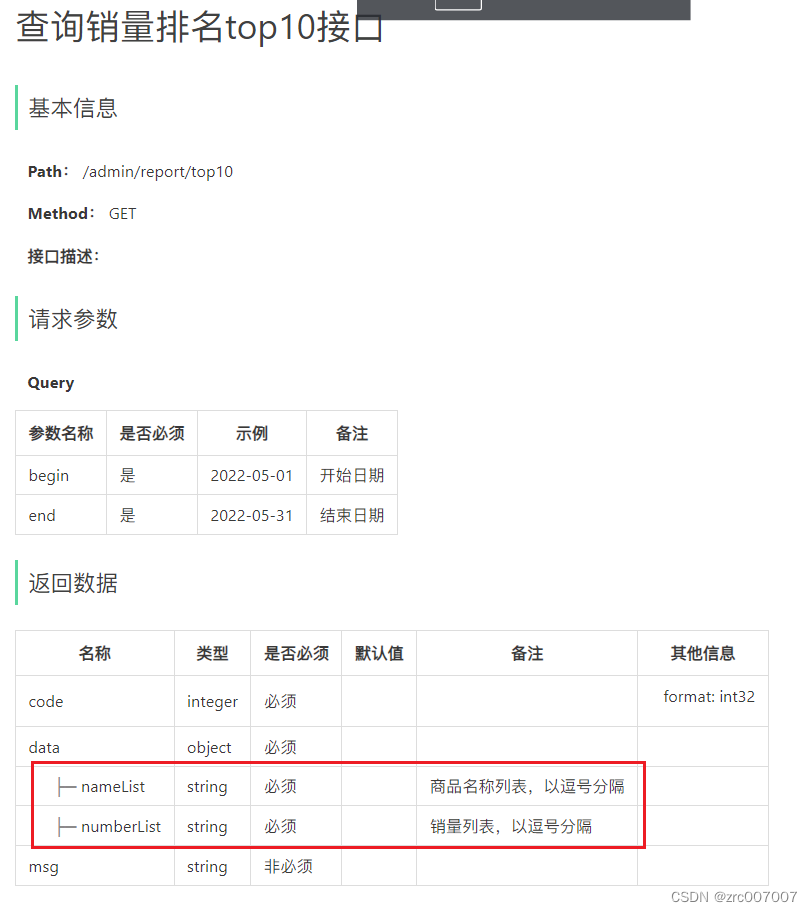
所需数据
- 商品名列表
- 销量列表
具体代码
控制层
@GetMapping("/top10")
public Result top10(@DateTimeFormat(pattern = "yyyy-MM-dd") LocalDate begin,
                    @DateTimeFormat(pattern = "yyyy-MM-dd") LocalDate end) {
    SalesTop10ReportVO salesTop10ReportVO = reportService.top10(begin, end);
    return Result.success(salesTop10ReportVO);
}
业务层
@Override
public SalesTop10ReportVO top10(LocalDate begin, LocalDate end) {
    List<GoodsSalesDTO> goodsSalesDTOS = ordersMapper.countSaleTop10(LocalDateTime.of(begin, LocalTime.MIN), LocalDateTime.of(end, LocalTime.MAX));
    if (goodsSalesDTOS == null) {
        return new SalesTop10ReportVO();
    }

    List<String> nameList = new ArrayList<>();
    List<Integer> numberList = new ArrayList<>();
    for (GoodsSalesDTO goodsSalesDTO : goodsSalesDTOS) {
        nameList.add(goodsSalesDTO.getName());
        numberList.add(goodsSalesDTO.getNumber());
    }  // 思考:这里可不可以简写?


    SalesTop10ReportVO salesTop10ReportVO = new SalesTop10ReportVO();
    salesTop10ReportVO.setNameList(StringUtils.join(nameList, ","));
    salesTop10ReportVO.setNumberList(StringUtils.join(numberList, ","));
    return salesTop10ReportVO;
}
2个注意的点
第一个,下面持久层的多表查询。
第二个,查询到DTO后,对象数据到两列数据的转换。
- 法一,普通方法,老老实实用两个List添加。
- 法二,流方法。值得练习,公司中可能会见到、用到很多,资深程序员必备。
练习:用流的写法完成查询数据到两个列表数据的转换
尝试用流的写法完成。
答案如下:
@Override
public SalesTop10ReportVO top10(LocalDate begin, LocalDate end) {
    List<GoodsSalesDTO> goodsSalesDTOS = ordersMapper.countSaleTop10(LocalDateTime.of(begin, LocalTime.MIN), LocalDateTime.of(end, LocalTime.MAX));
    if (goodsSalesDTOS == null) {
        return new SalesTop10ReportVO();
    }

//        List<String> nameList = new ArrayList<>();
//        List<Integer> numberList = new ArrayList<>();
//        for (GoodsSalesDTO goodsSalesDTO : goodsSalesDTOS) {
//            nameList.add(goodsSalesDTO.getName());
//            numberList.add(goodsSalesDTO.getNumber());
//        }
    // ==========注意这里的写法==========
    List<String> nameList = goodsSalesDTOS.stream().map(GoodsSalesDTO::getName).collect(Collectors.toList());
    List<Integer> numberList = goodsSalesDTOS.stream().map(GoodsSalesDTO::getNumber).collect(Collectors.toList());
    // ==========注意上面的写法==========

    SalesTop10ReportVO salesTop10ReportVO = new SalesTop10ReportVO();
    salesTop10ReportVO.setNameList(StringUtils.join(nameList, ","));
    salesTop10ReportVO.setNumberList(StringUtils.join(numberList, ","));
    return salesTop10ReportVO;
}
持久层
<select id="countSaleTop10" resultType="com.sky.dto.GoodsSalesDTO">
select t2.name, sum(t2.number) as number
from orders as t1
inner join order_detail as t2
on t1.id = t2.order_id
where t1.status = 5
and t1.order_time >= #{begin}
and t1.order_time <= #{end}
group by t2.name
order by number desc limit 0, 10;
</select>复习
1.ECharts最少需要准备几列数据?
2.LocalDateTime的比较,以及比较接口讲解的复习
3.日期时间的拼接、时间在一天的最大、最小值
4.Map封装数据进行查找的代码手法
5.统计中,持久层查询为null的归0化处理;
6.查找增量与总量时的简写mapper查询。
