说明:数据集 ex2data1.txt是吴恩达机器学习的作业的数据集。
# -*-coding:utf-8-*-
import matplotlib.pyplot as plt
import numpy as np
import pandas as pd

class Logitstic_Regression:
    def __init__(self, learning_rate=0.01, num_iterations=75000, threshold=0.5):
        self.learning_rate = learning_rate
        self.num_iterations = num_iterations
        self.threshold = threshold
        self.weights = None
        self.bias = None

    def fit(self,X,y):
        #初始化参数
        num_samples,num_features=X.shape
        self.weights=np.zeros((num_features,1))
        self.bias=0

        #梯度下降
        for i in range(self.num_iterations):
            #计算梯度
            linear_model=X @ self.weights+self.bias
            y_pred=self._sigmoid(linear_model)
            loss=(y_pred)-y
            dw=(1/num_samples) * (X.T @ (loss))
            db=(1/num_samples) * np.sum(loss)

            #updata W and b
            self.weights -= self.learning_rate*dw
            self.bias  -=  self.learning_rate*db


    def predict(self,X):
        #X必须是二维的,尺寸(m*2)
        linear_model=X @ self.weights +self.bias
        y_pred=self._sigmoid(linear_model)
        y_pred_class=[1 if i>self.thredshold else 0 for i in y_pred]
        return np.array(y_pred_class)

    def _sigmoid(self,x):
        return 1/(1+np.exp(-x))

    def draw(self,X, y):
        fig, ax = plt.subplots(figsize=(12, 8))
        ax.scatter(X[np.where(y == 1), 0], X[np.where(y == 1), 1], color="blue", s=30, marker="o")
        ax.scatter(X[np.where(y == 0), 0], X[np.where(y == 0), 1], color="green", s=30, marker="x")


        drawx2= ( 0-self.bias-X[:,0] * self.weights[0,0] ) / self.weights[1,0]
        ax.plot(X[:, 0], drawx2 , color="black")
        plt.show()
def loadData():
    df=pd.read_csv("ex2data1.txt",sep=",",header=None)

    data=np.array(df.values)
    # print(type(data))
    # print(data)
    #X是二维的,(m,2),y是二维的(m,1)
    X=data[:,0:2]
    y=data[:,2:3]
    # print(X)
    # print(y)
    return X,y

if __name__=="__main__":
    X,y=loadData()

    model=Logitstic_Regression()
    model.fit(X,y)

    print(model.weights)
    print(model.bias)

    model.draw(X,y)
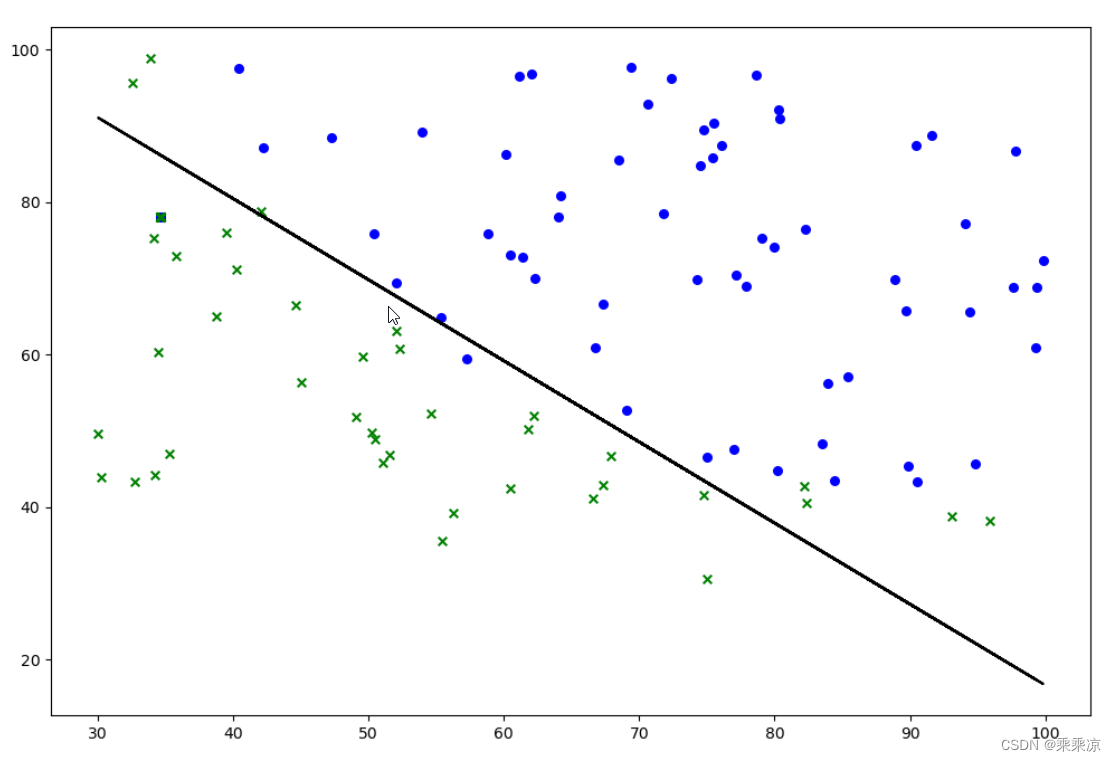
运行结果:




![【线段树】P6492 [COCI2010-2011#6] STEP](https://img-blog.csdnimg.cn/91489698409c4a719676d670f53a8d05.png)
