import matplotlib.pyplot as plt
import numpy as np


def reckonCost(X,y,theta):
    m=y.shape[0]
    inner=np.power( ( (X@theta)-y.T ) , 2)
    return np.sum(inner) / (2*m)

# 定义梯度下降函数
def gradient_descent(X, y, theta, alpha, num_iters):
    # m = len(y)  # 样本数量
    m=y.shape[0]
    cost = np.zeros(num_iters)
    for i in range(num_iters):
        h = np.dot(X, theta)  # 计算预测值
        loss = h - y.T  # 计算误差
        # gradient = np.dot(X.T, loss) / m  # 计算梯度
        gradient =( X.T@loss ) / m
        theta = theta - alpha * gradient  # 更新参数
        # cost[i]=reckonCost(X,y,theta)
    return theta


# 定义线性回归函数
def linear_regression(x, y):
    theta = np.zeros((2, 1))  # 初始化参数矩阵

    alpha = 0.01  # 学习率
    num_iters = 2000  # 迭代次数
    # print(x.T)
    # print(np.ones((len(y), 1)))
    # print(theta)np.ones((len(y), 1)
    m=y.shape[1]
    ones=np.ones((m,1))
    #X的维度:m*2
    X = np.hstack( (ones, x.T) )  # 将x矩阵和全1矩阵按行拼接
    print(X)
    theta=gradient_descent(X, y, theta, alpha, num_iters)
    return theta


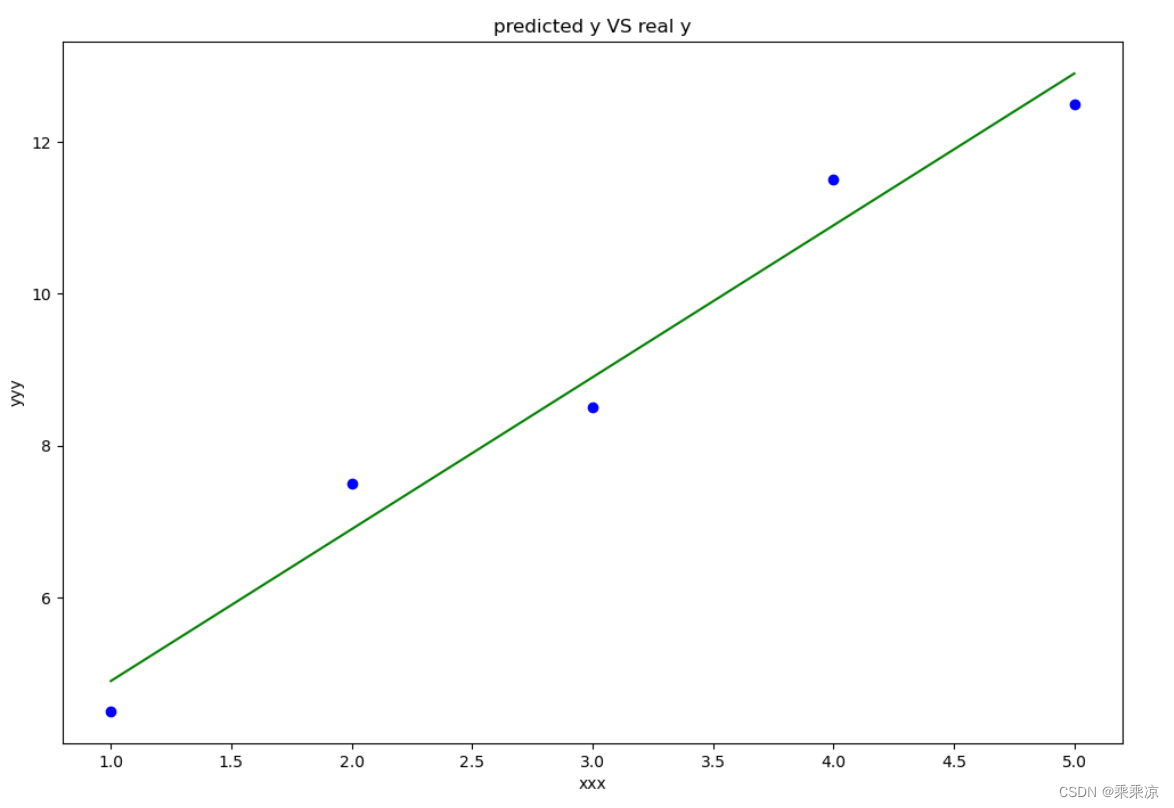
def draw1(x,y,theta):
    # fig, ax = plt.subplots(1,2)
    fig,ax=plt.subplots(figsize=(12,8))

    f=theta[1]*x+theta[0]
    print("f",f)
    ax.plot(x[0,:],f[0,:],label="predictoin",color="green")
    # ax.scatter(x[0,:],y[0,:],label="Traiining Data")
    ax.set_xlabel("xxx")
    ax.set_ylabel("yyy")
    ax.set_title("predicted y VS real y")

    ax.scatter(x[0,:], y[0,:],color="blue")

    # ax.plot(len(cost),cost,color="red")

    plt.show()

def draw2(cost):
    fig, ax = plt.subplots(figsize=(12, 8))
    ax.plot(len(cost),cost,color="red")
    plt.show()


if __name__=="__main__":

    # 这里的x和y都是1*m的二维矩阵
    x = np.array([[1, 2, 3, 4, 5]])  # 自变量
    # y = np.array([[2, 4, 5, 4, 5]])  # 因变量
    y=np.array([[4.5,7.5,8.5,11.5,12.5]])
    theta = linear_regression(x, y)  # 计算回归系数
    print("回归系数theta:", theta)
    # print("cost",cost)
    # print(len(cost))

    draw1(x,y,theta)
    # draw3(x,y,theta,cost)
运行结果:
