Titanic Disaster Kaggle,里的经典入门题目,因为在学决策树所以找了一个实例学习了一下,完全萌新零基础,所以基本每一句都做了注释。
原文链接:Titanic: Simple Decision Tree model score(Top 3%) | Kaggle
目录
1. Preprocessing and EDA #预处理和探索性数据分析
1.1. Missing Values #缺失值
1.3. Fare column #票价列
1.4. Embarked column #登船地
1.5. Cabin column #船舱列
2. Feature Extraction #特征工程
2.1. SibSp and Parch column #兄弟姐妹和父母孩子
2.2. Ticket column #船票
2.3. Name Column #姓名
2.4. Woman or Child column #女人和孩子
2.4 Family Survived Rate column #家庭生存率
3. Modeling #训练模型
4. Conclutions #结论
5. References #参考文献
Titanic Disaster
Improve your score to 82.78% (Top 3%)
In this work I have used some basic techniques to process of the easy way Titanic dataset.
1. Preprocessing and EDA #预处理和探索性数据分析
Here, I reviewed the variables, impute missing values, found patterns and watched relationship between columns.
#第一部分的工作是查看变量,修补缺失值,通过观察数据之间的关系,进行特征工程。
1.1. Missing Values #缺失值
Reading the dataset and merging Train and Test to get better results.
#读取数据集并合并训练和测试以获得更好的结果
# Libraries used
import numpy as np
#运行速度非常快的数学库,主要用于数组计算
import pandas as pd
#分析结构化数据的工具集,基础是 Numpy
import seaborn as sns
#可视化库 是对matplotlib进行二次封装
import matplotlib.pyplot as plt
#可视化库
#机器学习库
from sklearn.preprocessing import LabelEncoder, OneHotEncoder
from sklearn.tree import DecisionTreeClassifier
from sklearn.preprocessing import StandardScaler
from numpy.random import seed
seed(11111)
#随机种子 可以让每次的随机数都相同 保证程序可以复现# Reading
#读取训练集和测试集
train = pd.read_csv("../input/titanic/train.csv")
test = pd.read_csv("../input/titanic/test.csv")
# Putting on index to each dataset before split it
#指定PassengerId列将被设置为索引
train = train.set_index("PassengerId")
test = test.set_index("PassengerId")
# dataframe
#纵向合并两个DataFrame对象 axis=0纵向 sort=False列的顺序维持原样, 不进行重新排序。
df = pd.concat([train, test], axis=0, sort=False)
#输出df
df| Survived | Pclass | Name | Sex | Age | SibSp | Parch | Ticket | Fare | Cabin | Embarked | |
|---|---|---|---|---|---|---|---|---|---|---|---|
| PassengerId | |||||||||||
| 1 | 0.0 | 3 | Braund, Mr. Owen Harris | male | 22.0 | 1 | 0 | A/5 21171 | 7.2500 | NaN | S |
| 2 | 1.0 | 1 | Cumings, Mrs. John Bradley (Florence Briggs Th... | female | 38.0 | 1 | 0 | PC 17599 | 71.2833 | C85 | C |
| 3 | 1.0 | 3 | Heikkinen, Miss. Laina | female | 26.0 | 0 | 0 | STON/O2. 3101282 | 7.9250 | NaN | S |
| 4 | 1.0 | 1 | Futrelle, Mrs. Jacques Heath (Lily May Peel) | female | 35.0 | 1 | 0 | 113803 | 53.1000 | C123 | S |
| 5 | 0.0 | 3 | Allen, Mr. William Henry | male | 35.0 | 0 | 0 | 373450 | 8.0500 | NaN | S |
| ... | ... | ... | ... | ... | ... | ... | ... | ... | ... | ... | ... |
| 1305 | NaN | 3 | Spector, Mr. Woolf | male | NaN | 0 | 0 | A.5. 3236 | 8.0500 | NaN | S |
| 1306 | NaN | 1 | Oliva y Ocana, Dona. Fermina | female | 39.0 | 0 | 0 | PC 17758 | 108.9000 | C105 | C |
| 1307 | NaN | 3 | Saether, Mr. Simon Sivertsen | male | 38.5 | 0 | 0 | SOTON/O.Q. 3101262 | 7.2500 | NaN | S |
| 1308 | NaN | 3 | Ware, Mr. Frederick | male | NaN | 0 | 0 | 359309 | 8.0500 | NaN | S |
| 1309 | NaN | 3 | Peter, Master. Michael J | male | NaN | 1 | 1 | 2668 | 22.3583 | NaN | C |
1309 rows × 11 columns
#1309行 11列
As you can see Name, Sex, Ticket, Cabin, and Embarked column are objects, before processing each column we should know if there are NAs or missing values.
#姓名、性别、船票、客舱和登船地列都是对象,在预处理之前先查看一下数据的总体信息 判断是否有缺失数据
df.info()
#.info()函数用于获取 DataFrame 的简要摘要
<class 'pandas.core.frame.DataFrame'> Int64Index: 1309 entries, 1 to 1309 Data columns (total 11 columns): # Column Non-Null Count Dtype --- ------ -------------- ----- 0 Survived 891 non-null float64 1 Pclass 1309 non-null int64 2 Name 1309 non-null object 3 Sex 1309 non-null object 4 Age 1046 non-null float64 5 SibSp 1309 non-null int64 6 Parch 1309 non-null int64 7 Ticket 1309 non-null object 8 Fare 1308 non-null float64 9 Cabin 295 non-null object 10 Embarked 1307 non-null object dtypes: float64(3), int64(3), object(5) memory usage: 122.7+ KB
There are three columns with missing values (Age, Fare and Cabin) and Survived column has NaNs because the Test dataset doesn't have that information.
#有三列缺少值(年龄、票价和舱位),“幸存”列具有 NaN,因为测试数据集没有该信息。
df.isna().sum()
#.isna()检测缺失值 .sum()加和 也就是显示每一列的缺失值数量
Survived 418 Pclass 0 Name 0 Sex 0 Age 263 SibSp 0 Parch 0 Ticket 0 Fare 1 Cabin 1014 Embarked 2 dtype: int64
To visualize better the columns we will transform the Sex and Embarked columns to numeric. Sex column only has two categories Female and Male, Embarked column has tree labels S, C and Q.
#为了更好地可视化列,我们将“性别”和“登船”列转换为数字。性别列只有两个类别“女性”=0和“男性”=1,“登船”列具有树形标签 S=0、C =1和 Q=2。
# Sex
change = {'female':0,'male':1}
df.Sex = df.Sex.map(change)
#.map() 可以用自己定义的或者是其他包提供的函数用在Pandas对象上实现批量修改
# Embarked
change = {'S':0,'C':1,'Q':2}
df.Embarked = df.Embarked.map(change)The following figure show us numeric columns vs Survived column to know the behavior. In the last fig (3,3) you can see that we are working with unbalanced dataset.
#下图向我们展示了数字列与幸存列以了解行为。在最后一个图 (3,3) 中,您可以看到我们正在处理不平衡的数据集。
columns = ['Pclass', 'Sex','Embarked','SibSp', 'Parch','Survived']
plt.figure(figsize=(16, 14))
#figsize 设置图形的大小 长16,宽14
sns.set(font_scale= 1.2)
#font_scale 以基准倍数放大1.2倍
sns.set_style('ticks')
#set_style设置主题 有5个默认主题
for i, feature in enumerate(columns):
plt.subplot(3, 3, i+1)
#subplot(子图行数,图像列数,每行第几个图)
sns.countplot(data=df, x=feature, hue='Sex', palette='BrBG')
#countplot 使用条形显示每个分箱器中的观察计数 hue: 在x或y标签划分的同时,再以hue标签划分统计个数 palette:使用不同的调色板
sns.despine()
#despine()函数移除坐标轴
1.2. Age column
The easy way to impute the missing values is with mean or median on base its correlation with other columns. Below you can see the correlation beetwen variables, Pclass has a good correlation with Age, but I also added Sex column to impute missing values.
#估算缺失值的简单方法是根据其与其他列的相关性使用平均值或中位数。下面你可以看到变量相关性,Pclass 与 Age 有很好的相关性,但我也添加了 列来插补缺失值。
corr_df = df.corr()
#df.corr() 相关性分析

fig, axs = plt.subplots(figsize=(8, 6))

sns.heatmap(corr_df).set_title("Correlation Map",fontdict= { 'fontsize': 20, 'fontweight':'bold'});
#设置图像的信息 标题 字号等信息
df.groupby(['Pclass','Sex','Survived'])['Age'].median()
#根据某个(多个)字段划分为不同的群体 根据阶级,性别,生存率分组,只查看年龄的中位数
Pclass Sex Survived
1 0 0.0 25.0
1.0 35.0
1 0.0 45.5
1.0 36.0
2 0 0.0 32.5
1.0 28.0
1 0.0 30.5
1.0 3.0
3 0 0.0 22.0
1.0 19.0
1 0.0 25.0
1.0 25.0
Name: Age, dtype: float64
#Filling the missing values with mean of Pclass and Sex.
df["Age"].fillna(df.groupby(['Pclass','Sex'])['Age'].transform("mean"), inplace=True)
#把年龄的缺失值 按阶级和性别分组后的年龄均值填充
fig, axs = plt.subplots(figsize=(10, 5))
sns.histplot(data=df, x='Age').set_title("Age distribution",fontdict= { 'fontsize': 20, 'fontweight':'bold'});
sns.despine()
Let's binning the columns to process it the best way.
#数据分箱是最好的处理方法。
auxage = pd.cut(df['Age'], 4)
fig, axs = plt.subplots(figsize=(15, 5))
sns.countplot(x=auxage, hue='Survived', data=df).set_title("Age Bins",fontdict= { 'fontsize': 20, 'fontweight':'bold'});
sns.despine()
# converting to categorical
#转换分类
df['Age'] = LabelEncoder().fit_transform(auxage)
# LabelEncoder()对数据进行编码 fit_transform就是将序列重新排列后再进行标准化
pd.crosstab(df['Age'], df['Survived'])
#构建交叉表| Survived | 0.0 | 1.0 |
|---|---|---|
| Age | ||
| 0 | 97 | 82 |
| 1 | 341 | 200 |
| 2 | 94 | 55 |
| 3 | 17 | 5 |
1.3. Fare column #票价列
Fare has only one missing value and I imputed with the median or moda
#票价只有一个缺失值,用中位数或模数估算
df["Fare"].fillna(df.groupby(['Pclass', 'Sex'])['Fare'].transform("median"), inplace=True)auxfare = pd.cut(df['Fare'],5)
fig, axs = plt.subplots(figsize=(15, 5))
sns.countplot(x=auxfare, hue='Survived', data=df).set_title("Fare Bins",fontdict= { 'fontsize': 20, 'fontweight':'bold'});
sns.despine()
df['Fare'] = LabelEncoder().fit_transform(auxfare) pd.crosstab(df['Fare'], df['Survived'])| Survived | 0.0 | 1.0 |
|---|---|---|
| Fare | ||
| 0 | 535 | 303 |
| 1 | 8 | 25 |
| 2 | 6 | 11 |
| 3 | 0 | 3 |
1.4. Embarked column #登船地
Has two missing values.
#有两个缺失值。
print("mean of embarked",df.Embarked.median())
df.Embarked.fillna(df.Embarked.median(), inplace = True)mean of embarked 0.0
1.5. Cabin column #船舱列
This column has many missing values and thats the reason I dropped it.
#此列有许多缺失值,这就是我删除它的原因。缺失率达到了将近80% ,如果参数缺失率达到70以上就可以考虑 删除了。
print("Percentage of missing values in the Cabin column :" ,round(df.Cabin.isna().sum()/ len(df.Cabin)*100,2))Percentage of missing values in the Cabin column : 77.46
df.drop(['Cabin'], axis = 1, inplace = True)
#.drop 从行或列中删除指定的标签 inplace是否返回副本 默认为False返回副本
2. Feature Extraction #特征工程
In this part I have used the Name column to extract the Title of each person.
#在这一部分中,我使用“姓名”列来提取每个人的头衔。外国人姓名前会加头衔 把头衔提取出来 可以判断年龄 职业 社会阶层等信息
df['Title'] = df.Name.str.extract('([A-Za-z]+)\.', expand = False)
#.str.extract 提取的正则表达式df.Title.value_counts()Mr 757 Miss 260 Mrs 197 Master 61 Rev 8 Dr 8 Col 4 Major 2 Ms 2 Mlle 2 Don 1 Dona 1 Jonkheer 1 Lady 1 Capt 1 Sir 1 Mme 1 Countess 1 Name: Title, dtype: int64
The four titles most ocurring are Mr, Miss, Mrs and Master.
#最常出现的四个头衔是先生、小姐、夫人和师父。
least_occuring = ['Rev','Dr','Major', 'Col', 'Capt','Jonkheer','Countess']
df.Title = df.Title.replace(['Ms', 'Mlle','Mme','Lady'], 'Miss')
df.Title = df.Title.replace(['Countess','Dona'], 'Mrs')
df.Title = df.Title.replace(['Don','Sir'], 'Mr')
df.Title = df.Title.replace(least_occuring,'Rare')
df.Title.unique()
#unique()方法返回的是去重之后的不同值array(['Mr', 'Mrs', 'Miss', 'Master', 'Rare'], dtype=object)
pd.crosstab(df['Title'], df['Survived'])| Survived | 0.0 | 1.0 |
|---|---|---|
| Title | ||
| Master | 17 | 23 |
| Miss | 55 | 132 |
| Mr | 437 | 82 |
| Mrs | 26 | 100 |
| Rare | 14 | 5 |
df['Title'] = LabelEncoder().fit_transform(df['Title']) 2.1. SibSp and Parch column #兄弟姐妹和父母孩子
#特征工程 新建了一个特征 家庭规模=兄弟姐妹+父母孩子+自己
# I got the total number of each family adding SibSp and Parch. (1) is the same passenger.
df['FamilySize'] = df['SibSp'] + df['Parch']+1
df.drop(['SibSp','Parch'], axis = 1, inplace = True)
fig, axs = plt.subplots(figsize=(15, 5))
sns.countplot(x='FamilySize', hue='Survived', data=df).set_title("Raw Column",fontdict= { 'fontsize': 20, 'fontweight':'bold'});
sns.despine()
# Binning FamilySize column
df.loc[ df['FamilySize'] == 1, 'FamilySize'] = 0                            # Alone
df.loc[(df['FamilySize'] > 1) & (df['FamilySize'] <= 4), 'FamilySize'] = 1  # Small Family
df.loc[(df['FamilySize'] > 4) & (df['FamilySize'] <= 6), 'FamilySize'] = 2  # Medium Family
df.loc[df['FamilySize']  > 6, 'FamilySize'] = 3                             # Large Family
#根据家庭人数划分了范围 单人,小家庭,中等家庭,大家庭
fig, axs = plt.subplots(figsize=(15, 5))
sns.countplot(x='FamilySize', hue='Survived', data=df).set_title("Variable Bined",fontdict= { 'fontsize': 20, 'fontweight':'bold'});
sns.despine()
2.2. Ticket column #船票
With the following lambda function I got the ticket's number and I changed the LINE ticket to zero.
#使用以下 lambda 函数,我得到了票证的编号,并将 LINE 工单更改为零。
df['Ticket'] = df.Ticket.str.split().apply(lambda x : 0 if x[:][-1] == 'LINE' else x[:][-1])df.Ticket = df.Ticket.values.astype('int64')
#.astype 变量转换为int642.3. Name Column #姓名
To get a better model,I got the Last Name of each passenger.
#为了得到更好的模型,我得到了每个乘客的姓氏。
df['LastName'] = last= df.Name.str.extract('^(.+?),', expand = False)2.4. Woman or Child column #女人和孩子
Here, I created a new column to know if the passenger is woman a child, I selected the Title parameter because most of children less than 16 years have the master title.
#在这里,我创建了一个新列来了解乘客是否是儿童女性,我选择了 Title 参数,因为大多数 16 岁以下的儿童都有主标题。
df['WomChi'] = ((df.Title == 0) | (df.Sex == 0))2.4 Family Survived Rate column #家庭生存率
In this part I created three new columns FTotalCount, FSurviviedCount and FSurvivalRate, the F is of Family. FTotalCount uses a lambda function to count of the WomChi column on base of LastName, PClass and Ticked detect families and then subtract the same passanger with a boolean process the passenger is woman or child. FSurvivedCount also uses a lambda function to sum WomChi column and then with mask function filters if the passenger is woman o child subtract the state of survival, and the last FSurvivalRate only divide FSurvivedCount and FTotalCount.
#在这一部分中,我创建了三个新列 FTotalCount、FSurviedCount 和 FSurvivalRate,F 是 Family。FTotalCount 使用 lambda 函数对 LastName、PClass 和 Ticked 检测家庭基础上的 WomChi 列进行计数,然后用布尔过程减去乘客是女性或儿童的相同乘客。FSurvivedCount还使用lambda函数对WomChi列求和,然后用掩码函数过滤器,如果乘客是女人或孩子,则减去生存状态,最后一个FSurvivalRate仅除以FSurvivedCount和FTotalCount。
family = df.groupby([df.LastName, df.Pclass, df.Ticket]).Survived
df['FTotalCount'] = family.transform(lambda s: s[df.WomChi].fillna(0).count())
df['FTotalCount'] = df.mask(df.WomChi, (df.FTotalCount - 1), axis=0)
#df.mask 符合指定条件 进行替换 如果是WomChi,,则df.FTotalCount - 1
df['FSurvivedCount'] = family.transform(lambda s: s[df.WomChi].fillna(0).sum())
df['FSurvivedCount'] = df.mask(df.WomChi, df.FSurvivedCount - df.Survived.fillna(0), axis=0)
df['FSurvivalRate'] = (df.FSurvivedCount / df.FTotalCount.replace(0, np.nan))df.isna().sum()
#统计每列的缺失值数量Survived 418 Pclass 0 Name 0 Sex 0 Age 0 Ticket 0 Fare 0 Embarked 0 Title 0 FamilySize 0 LastName 0 WomChi 0 FTotalCount 245 FSurvivedCount 245 FSurvivalRate 1014 dtype: int64
# filling the missing values
#把缺失值全部补0 填充
df.FSurvivalRate.fillna(0, inplace = True)
df.FTotalCount.fillna(0, inplace = True)
df.FSurvivedCount.fillna(0, inplace = True)
# You can review the result Family Survival Rate with these Families Heikkinen, Braund, Rice, Andersson,
# Fortune, Asplund, Spector,Ryerson, Allison, Carter, Vander, Planke
#展示一下这些家庭的存活率
df[df['LastName'] == "Dean"]| Survived | Pclass | Name | Sex | Age | Ticket | Fare | Embarked | Title | FamilySize | LastName | WomChi | FTotalCount | FSurvivedCount | FSurvivalRate | |
|---|---|---|---|---|---|---|---|---|---|---|---|---|---|---|---|
| PassengerId | |||||||||||||||
| 94 | 0.0 | 3 | Dean, Mr. Bertram Frank | 1 | 1 | 2315 | 0 | 0.0 | 2 | 1 | Dean | False | 0.0 | 0.0 | 0.0 |
| 789 | 1.0 | 3 | Dean, Master. Bertram Vere | 1 | 0 | 2315 | 0 | 0.0 | 0 | 1 | Dean | True | 2.0 | 0.0 | 0.0 |
| 924 | NaN | 3 | Dean, Mrs. Bertram (Eva Georgetta Light) | 0 | 1 | 2315 | 0 | 0.0 | 3 | 1 | Dean | True | 2.0 | 1.0 | 0.5 |
| 1246 | NaN | 3 | Dean, Miss. Elizabeth Gladys Millvina"" | 0 | 0 | 2315 | 0 | 0.0 | 1 | 1 | Dean | True | 2.0 | 1.0 | 0.5 |
3. Modeling #训练模型
#第三部分 开始初始化 调用模型 进行训练
df = pd.get_dummies(df, columns=['Sex','Fare','Pclass'])
#对数据进行one-hot编码
df.drop(['Name','LastName','WomChi','FTotalCount','FSurvivedCount','Embarked','Title'], axis = 1, inplace = True)df.columns
#查看columns属性表示Index(['Survived', 'Age', 'Ticket', 'FamilySize', 'FSurvivalRate',
'PassengerId', 'Sex_0', 'Sex_1', 'Fare_0', 'Fare_1', 'Fare_2', 'Fare_3',
'Pclass_1', 'Pclass_2', 'Pclass_3'],
dtype='object')
# I splitted df to train and test
train, test = df.loc[train.index], df.loc[test.index]
#df.loc[] 根据DataFrame的行标和列标进行数据的筛选
X_train = train.drop(['PassengerId','Survived'], axis = 1)
Y_train = train["Survived"]
train_names = X_train.columns
X_test = test.drop(['PassengerId','Survived'], axis = 1)corr_train = X_train.corr()
fig, axs = plt.subplots(figsize=(10, 8))
sns.heatmap(corr_train).set_title("Correlation Map",fontdict= { 'fontsize': 20, 'fontweight':'bold'});
plt.show()
# Scaler
#标准化
X_train = StandardScaler().fit_transform(X_train)
X_test = StandardScaler().fit_transform(X_test)
#决策树训练
decision_tree = DecisionTreeClassifier()
decision_tree.fit(X_train, Y_train)
Y_predDT = decision_tree.predict(X_test)
print("Accuracy of the model: ",round(decision_tree.score(X_train, Y_train) * 100, 2))Accuracy of the model: 99.89
#精确度达到了 99.98% 竟然?
importances = pd.DataFrame(decision_tree.feature_importances_, index = train_names)
importances.sort_values(by = 0, inplace=True, ascending = False)
importances = importances.iloc[0:6,:]
plt.figure(figsize=(8, 5))
sns.barplot(x=0, y=importances.index, data=importances,palette="deep").set_title("Feature Importances",
fontdict= { 'fontsize': 20,
'fontweight':'bold'});
sns.despine()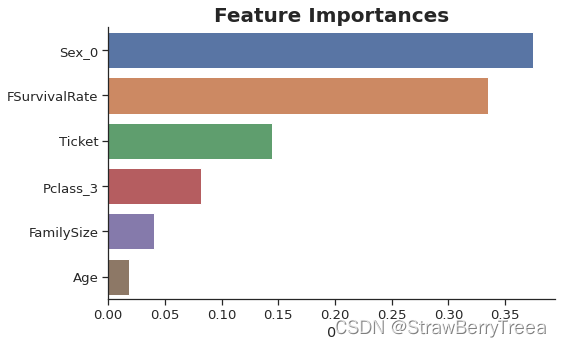
submit = pd.DataFrame({"PassengerId":test.PassengerId, 'Survived':Y_predDT.astype(int).ravel()})
submit.to_csv("submissionJavier_Vallejos.csv",index = False)
#保存数据
4. Conclutions #结论
This report is part of a bootcamp of Data Science, and as you can see I achieved to be on the Top 3%. In the fist part I did an analysis to visualize each column and impute their missing values. After that I applied feature engineering to extract the title, last name of the Name column and Family Size is the adding of SibSp and Parch plus one that means the same passenger. Age and Fare columns have been Binning to get better results. To get Family Survival Rate is base on two rules:
#这份报告是数据科学训练营的一部分,正如你所看到的,我达到了前3%的成绩。在第一部分中,我进行了分析以可视化每列并估算其缺失值。之后,我应用特征工程来提取标题,姓名列的姓氏和家庭大小是添加 SibSp 和 Parch 加上一个表示同一乘客。年龄和票价列已分箱以获得更好的结果。获得家庭存活率基于两个规则:
- All males die except boys in families where all females and boys live.
- All females live except those in families where all females and boys die.
#
- 在所有女性和男孩居住的家庭中,除男孩外,所有男性都死亡。
- 所有女性都生活,但所有女性和男孩都死亡的家庭除外。
With rules above you can get an score near to 81% but if you add the ticket number and other changes that I did you can improve it to 82.78% on Kaggle leaderboard.
#使用上述规则,您可以获得接近 81% 的分数,但如果您添加票号和我所做的其他更改,您可以在 Kaggle 排行榜上将其提高到 82.78%。
To the model part I used only Desicion tree because is the easy way to getting this score.
#对于模型部分,我只使用了 Desicion 树,因为这是获得此分数的简单方法。
Finally, if you want to increase your score, then I suggest you read this work. and like Chris Deotte said in his post this is the fist step to improve your score.
#最后,如果你想提高你的分数,那么我建议你阅读这部作品。就像克里斯·迪奥特(Chris Deotte)在他的帖子中所说的那样,这是提高分数的第一步。
5. References #参考文献
- Advanced Feature Engineering Tutorial
- Top 5% Titanic: Machine Learning from Disaster
- Titanic - Top score : one line of the prediction
- Titanic survival prediction from Name and Sex
- Titanic Dive Through: Feature scaling and outliers
- Titanic (Top 20%) with ensemble VotingClassifier
- Titanic Survival Rate
