v-charts简介: 是基于 Vue2.0 和 Echarts 封装的图标组件,只需要统一提供一种对前后端都友好的数据格式设置简单的配置项,就可以生成常见的图表。
v-charts官方文档:v-charts
echarts官方文档:Documentation - Apache ECharts
安装
npm i v-charts echarts -S
在main.js中引用
//全部引入
import VCharts from 'v-charts'
//按需引入v-charts(项目中一般是按需引用,v-charts中每个图表组件,都已单独打包到lib文件夹下面了)
import VeLine from 'v-charts/lib/line.common'
import VePie from 'v-charts/lib/pie.common'
页面使用
<template>
<div id="mian">
<div class="con_from">
<div class="lineP">
<div class="item itemTime">
<i>筛选日期</i>
<el-date-picker
v-model="query.startDate"
value-format="yyyy-MM-dd"
type="date"
placeholder="选择日期"
>
</el-date-picker>
<span style="padding:0px 10px;">-</span>
<el-date-picker
v-model="query.endDate"
value-format="yyyy-MM-dd"
type="date"
placeholder="选择日期"
>
</el-date-picker>
</div>
<div class="itembtn">
<el-button class="searchBt" @click="onSearch">查询</el-button>
</div>
</div>
</div>
<div class="header">
<span :id="active == 0 ? 'fzcolor' : ''" @click="checkActive(0)"
>交易金额</span
>
<span :id="active == 1 ? 'fzcolor' : ''" @click="checkActive(1)"
>交易笔数</span
>
<span :id="active == 3 ? 'fzcolor' : ''" @click="checkActive(3)"
>退款金额</span
>
<span :id="active == 2 ? 'fzcolor' : ''" @click="checkActive(2)"
>退款笔数</span
>
<span :id="active == 4 ? 'fzcolor' : ''" @click="checkActive(4)"
>成功率</span
>
<div
:class="{ right: true, active: timeActive == 0 ? true : false }"
@click="checkTimeActive(0)"
>
近30天
</div>
<div
:class="{ right: true, active: timeActive == 1 ? true : false }"
@click="checkTimeActive(1)"
>
近7天
</div>
<!-- <div :class="{right:true, active:timeActive == 2?true:false}" @click="checkTimeActive(2)">今天</div> -->
<div
:class="{ right: true, active: timeActive == 3 ? true : false }"
@click="checkTimeActive(3)"
>
昨天
</div>
</div>
<div class="exharts" >
<ve-line
ref="chartline"
width="100%"
:data="chartData"
:extend="chartExtend"
:settings="active == 4 ? chartSettings : {}"
:legend-visible="false"
></ve-line>
</div>
</div>
</template>
<script>
import { transactionSituation } from "@/api/data/clearing.js";
import { formatDate } from "@/utils/common.js";
import { mapState, mapMutations } from "vuex";
export default {
data() {
let that = this;
return {
active: 0,
timeActive: 3,
chartData: {
columns: ["date", "user"],
rows: [],
},
chartExtend: {
tooltip: {
backgroundColor: "#48B8B6",
formatter(res) {
let data = res[0].value;
function money(value) {
if (!value) return "0.00";
var intPart = Number(value) - (Number(value) % 1); //获取整数部分(这里是windy93的方法)
var intPartFormat = intPart
.toString()
.replace(/(\d)(?=(?:\d{3})+$)/g, "$1,"); //将整数部分逢三一断
var floatPart = ".00"; //预定义小数部分
var value2Array = value.toString().split(".");
//=2表示数据有小数位
if (value2Array.length == 2) {
floatPart = value2Array[1].toString(); //拿到小数部分
if (floatPart.length == 1) {
//补0,实际上用不着
return intPartFormat + "." + floatPart + "0";
} else {
return intPartFormat + "." + floatPart;
}
} else {
return intPartFormat + floatPart;
}
}
return `${data[0]} ${
that.active == 0 || that.active == 3
? money(data[1]) + "元"
: that.active == 1 || that.active == 2
? data[1] + "笔"
: data[1] * 100 + "%"
}`;
},
},
series: {
smooth: false,
},
},
chartSettings: {
yAxisType: ["percent"],
},
MerchantsDropList: [], //商户下拉表
query: {
startDate: formatDate(+new Date() - 24 * 60 * 60 * 1000, "yyyy-MM-dd"),
endDate: formatDate(+new Date() - 24 * 60 * 60 * 1000, "yyyy-MM-dd"),
mchId:"",
},
mainList: [],
};
},
// 监听头部收起,缩放时,页面宽度的变化
// computed: {
// isCollapse(){return this.$store.state.isActiveHead;}
// },
// watch:{
// isCollapse(newValue, oldValue){
// this.$nextTick(() => {
// this.$refs.chartline.echarts.resize()
// })
// }
// },
created() {
this.getLists();
this.$enter(this.$route.path, this.onSearch);
},
activated() {
this.getLists();
},
methods: {
getLists() {
if (!this.query.startDate || !this.query.endDate) {
this.$message.error("统计日期时间段必选");
return;
}
transactionSituation(this.query)
.then((res) => {
if (res) {
this.mainList = res.resultData;
this.checkActive(this.active);
}
})
.catch((res) => {
console.log(res);
});
},
checkActive(active) {
this.chartData.rows = [];
this.active = active;
let key = "";
if (active == 0) {
key = "tradeAmount";
} else if (active == 1) {
key = "tradeNum";
} else if (active == 2) {
key = "refundNum";
} else if (active == 3) {
key = "refundAmount";
} else if (active == 4) {
key = "successRate";
}
this.mainList.forEach((item) => {
this.chartData.rows.push({
date: item.totalDate,
user:
active == 0 || active == 3 || active == 4
? item[key] / 100
: item[key],
});
});
// 这种方式的监听,在切换 tab 栏时,图表会动态变化
// this.$nextTick(() => {
// this.$refs.chartline.echarts.resize()
// })
},
checkTimeActive(timeActive) {
this.timeActive = timeActive;
switch (timeActive) {
case 0:
this.query.startDate = formatDate(
+new Date() - 30 * 24 * 60 * 60 * 1000,
"yyyy-MM-dd"
);
this.query.endDate = formatDate(
+new Date() - 24 * 60 * 60 * 1000,
"yyyy-MM-dd"
);
break;
case 1:
this.query.startDate = formatDate(
+new Date() - 7 * 24 * 60 * 60 * 1000,
"yyyy-MM-dd"
);
this.query.endDate = formatDate(
+new Date() - 24 * 60 * 60 * 1000,
"yyyy-MM-dd"
);
break;
case 2:
this.query.startDate = formatDate(+new Date(), "yyyy-MM-dd");
this.query.endDate = formatDate(+new Date(), "yyyy-MM-dd");
break;
case 3:
this.query.startDate = formatDate(
+new Date() - 24 * 60 * 60 * 1000,
"yyyy-MM-dd"
);
this.query.endDate = formatDate(
+new Date() - 24 * 60 * 60 * 1000,
"yyyy-MM-dd"
);
break;
}
this.getLists();
},
onSearch() {
this.getLists();
},
},
};
</script>
<style scoped>
.con_from p>i {
padding-right: 12px;
font-size: 14px;
font-family: Microsoft YaHei;
font-weight: 400;
}
.con_from p:last-child{
padding-bottom:0px;
}
.con_from p {
padding-bottom: 20px;
height: 40px;
}
.con_from .el-input__icon{
line-height: 40px !important;
}
.con_from .lineP{
display: flex;
flex-flow: wrap;
margin: 20px 0px 0px;
width: 100%;
}
.con_from .lineP:first-child{
margin: 0px;
}
.con_from .lineP .item {
display: flex;
align-content: center;
height: 40px;
line-height: 40px;
width: 27%;
margin-left: 9.5%;
font-size: 14px;
}
.con_from .lineP .item:first-child{
margin-left: 0%;
}
.con_from .lineP .itembtn {
display: flex;
margin-left: auto;
width: 30%;
align-items: center;
justify-content: flex-end;
}
.con_from .lineP .item > i {
width: 60px;
text-align: right;
margin-right: 10px;
}
.con_from .lineP .item .el-input , .con_from .lineP .item .el-select {
width: calc(100% - 60px - 10px);
}
.con_from .lineP .item .el-select .el-input{
width: 100%;
}
.con_from .lineP .itemTime{
width: 49.723%;
}
.con_from .lineP .itemTime .el-input{
width: calc((100% - 60px - 24.67px - 10px) / 2);
}
.header span {
display: inline-block;
height: 100%;
width: 100px;
text-align: center;
font-size: 14px;
font-family: Microsoft YaHei;
font-weight: 400;
}
.header {
line-height: 40px;
width: 100%;
height: 40px;
border-bottom: 1px solid rgba(220, 224, 230, 1);
position: relative;
top: 0;
margin-top:50px;
}
.header .right {
float: right;
width: 74px;
height: 40px;
color: #333333;
font-size: 12px;
text-align: center;
line-height: 40px;
}
.header .right.active {
color: #48b8b6;
box-sizing: border-box;
}
.header span {
cursor: pointer;
}
.header div {
cursor: pointer;
}
</style>
页面效果图
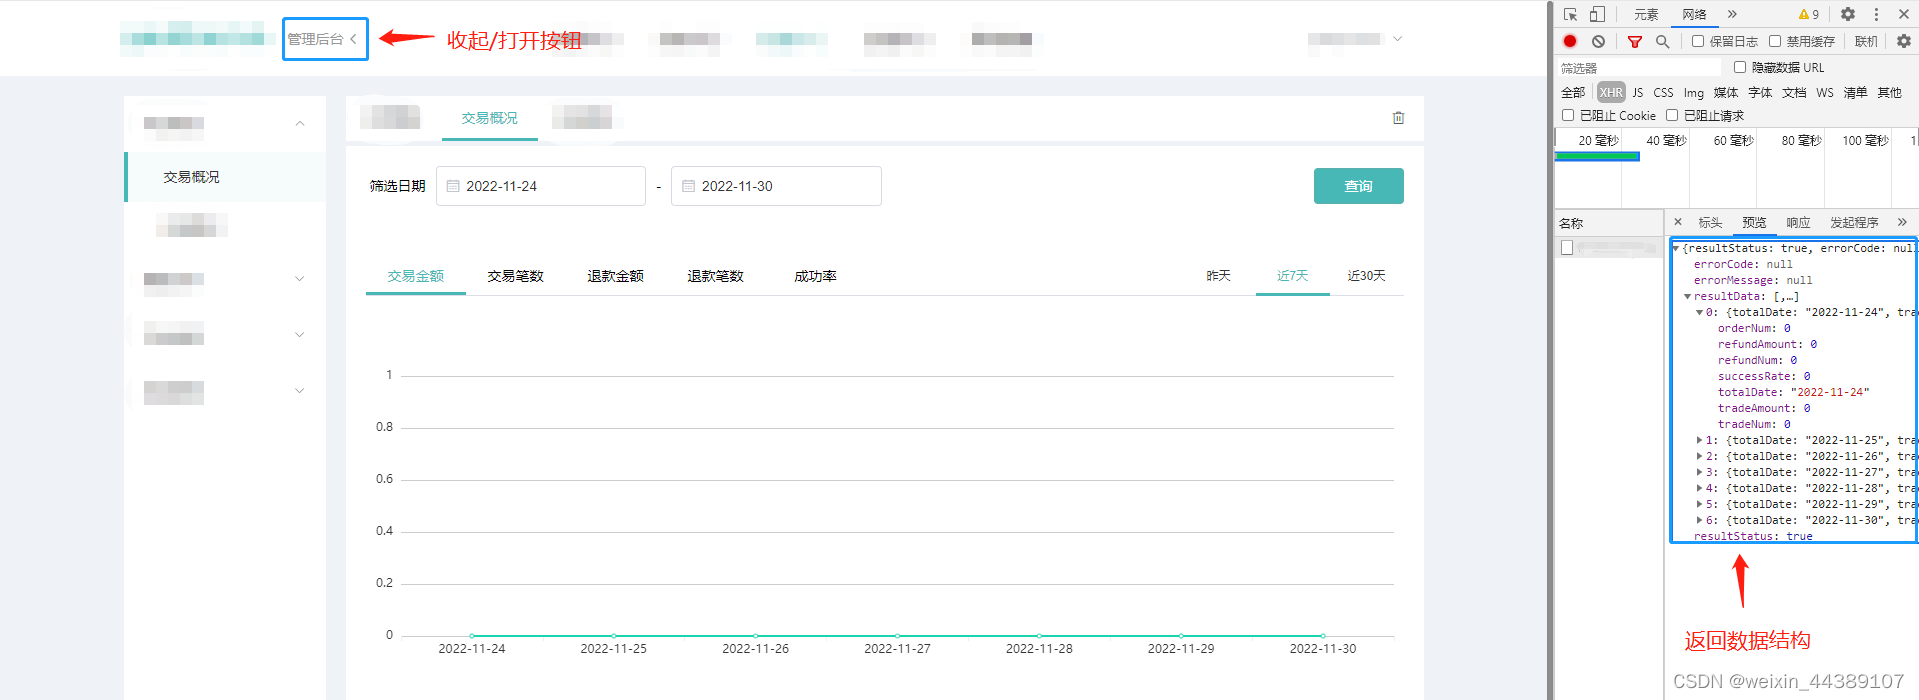
在点击头部收起/打开的箭头时,会导致折线图的宽,不随着屏幕的改变而改变。echarts图,不能重绘,页面效果如下:
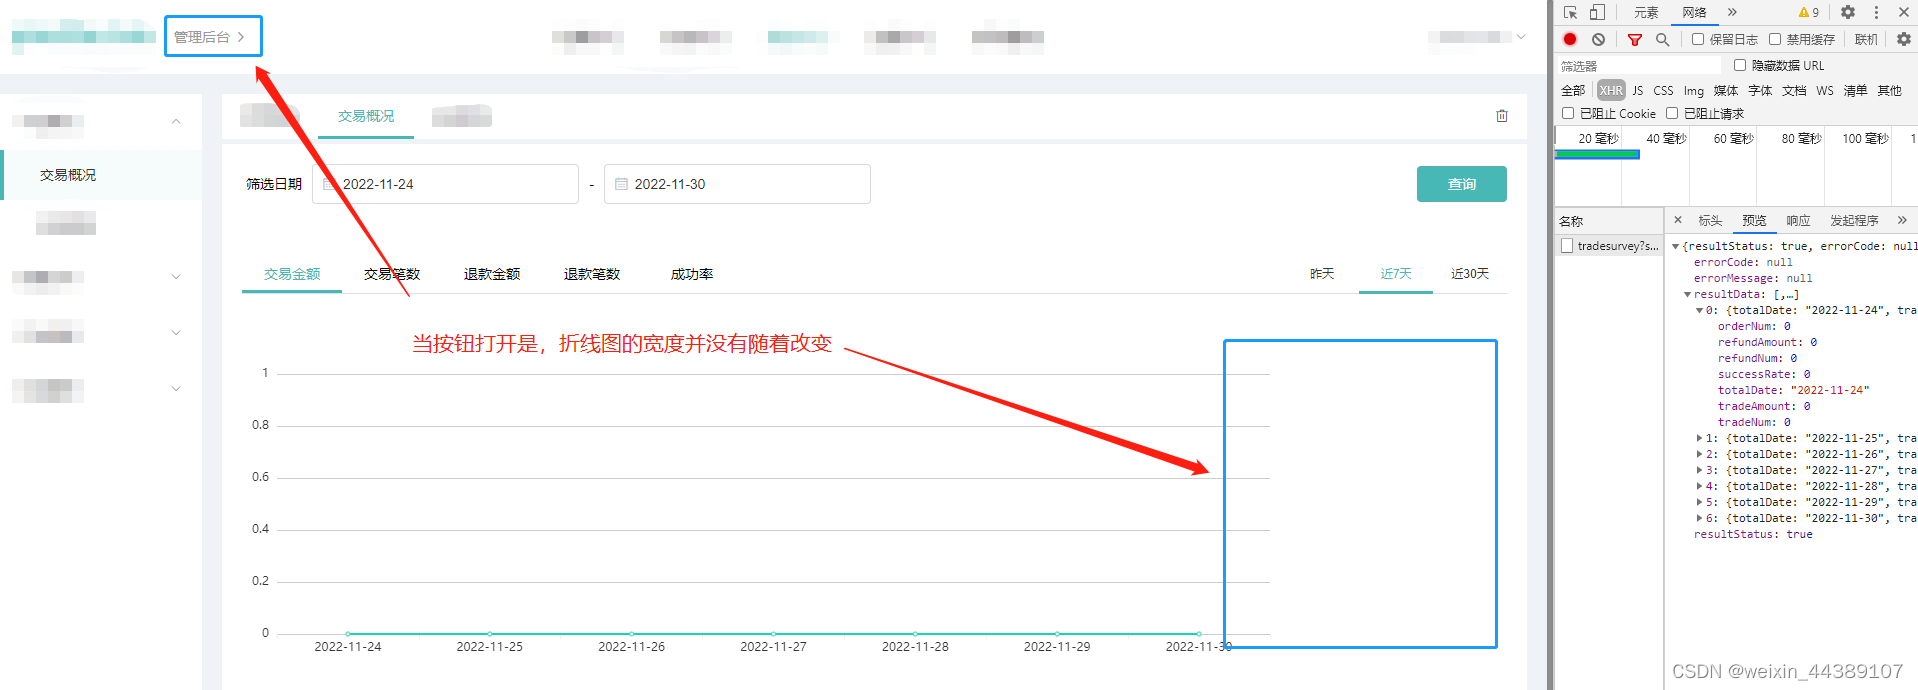
解决方案
一开始的思路,是监听DOM变化,于是在网上搜索了一些方法,但是由于本系统并不会大量地改变DOM,没有必要监听DOM宽高的变化。系统中只有折叠和展开两个状态,所以只需要简单的用一个flag表示,监听其true/false就可以了。我通过在store中创建变量isCollapse来管理折叠与展开。
import Vue from 'vue'
import Vuex from 'vuex'
import createPersistedstate from 'vuex-persistedstate'
Vue.use(Vuex)
export default new Vuex.Store({
state: {
token:"",//存储token
isCollapse: false,// echact监听重绘变量
},
getters:{
getToken(state){
return state.token;
}
},
mutations: {
// 修改token,并将token存入localStorage
setToken(state,token) {
state.token = token;
localStorage.setItem("token",token);
},
// echact监听重绘变量
commitCollapse(state, bool) {
state.isCollapse = bool;
},
},
actions: {},
modules: {},
plugins: [
new createPersistedstate({
token: localStorage.getItem("token"),
}),
],
})
最后在页面中,监听isCollapse值的变化,调用echarts的resize这个API,就可以了,上面写到的页面代码中加粗的注释代码就是监听isCollapse值的变化的代码,打开注释就好啦。
搜索文档:v-charts的简单使用_风如也的博客-CSDN博客_v-charts


![[附源码]Python计算机毕业设计SSM垃圾分类网站的设计与实现(程序+LW)](https://img-blog.csdnimg.cn/0d4d12b939db48d29dba467fa1ed06d2.png)

![[附源码]计算机毕业设计springboot社区人员信息管理系统设计与实现](https://img-blog.csdnimg.cn/f9909156db0546e3ad0273ebe803ec8c.png)



![[附源码]Python计算机毕业设计SSM篮球馆预约小程序(程序+LW)](https://img-blog.csdnimg.cn/f8165008ea584f12b665a0e549489df9.png)
![Error: [mobx-miniprogram] no store specified (小程序全局数据共享bug)](https://img-blog.csdnimg.cn/a6c080dfd68b47339d9d86ae64b156ea.png)

![[附源码]计算机毕业设计springboot区域医疗服务监管可视化系统](https://img-blog.csdnimg.cn/d6b3e33168b145d5aba8041a6bd4fd03.png)