1 官网找到类似实例, 适当分析,并且引入到HTML页面中
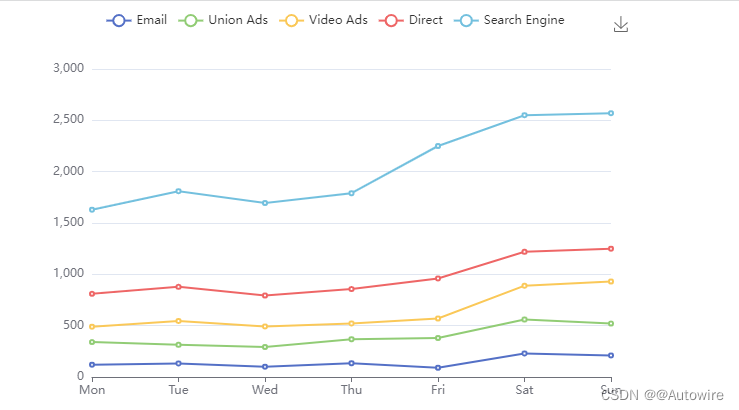
<!DOCTYPE html>
<html>
<head>
    <meta charset="utf-8"/>
    <title>ECharts</title>
    <!-- 引入刚刚下载的 ECharts 文件 -->
    <script src="echarts.js"></script>
</head>
<style>
</style>
<body>
<!-- 为 ECharts 准备一个定义了宽高的 DOM -->
<div id="main" style="width: 600px;height:400px;margin: 0 auto;"></div>
<script type="text/javascript">
    var myColor = ["#1089E7", "#F57474", "#56D0E3", "#F8B448", "#8B78F6"];
    // 1. 实例化对象
    var myChart = echarts.init(document.getElementById("main"));
    // 2. 指定配置和数据
    option = {
        tooltip: {
            trigger: 'axis'
        },
        legend: {
            data: ['Email', 'Union Ads', 'Video Ads', 'Direct', 'Search Engine']
        },
        grid: {
            left: '3%',
            right: '4%',
            bottom: '3%',
            containLabel: true
        },
        toolbox: {
            feature: {
                saveAsImage: {}
            }
        },
        xAxis: {
            type: 'category',
            boundaryGap: false,
            data: ['Mon', 'Tue', 'Wed', 'Thu', 'Fri', 'Sat', 'Sun']
        },
        yAxis: {
            type: 'value'
        },
        series: [
            {
                name: 'Email',
                type: 'line',
                stack: 'Total',
                data: [120, 132, 101, 134, 90, 230, 210]
            },
            {
                name: 'Union Ads',
                type: 'line',
                stack: 'Total',
                data: [220, 182, 191, 234, 290, 330, 310]
            }
        ]
    };
    // 使用刚指定的配置项和数据显示图表。
    myChart.setOption(option);
</script>
</body>
</html>
2 根据需求定制图表
2.1 修改折线图大小,显示边框设置颜色,显示刻度标签
        grid: {
            top: '20%',
            left: '3%',
            right: '4%',
            bottom: '3%',
            show: true,// 显示边框
            borderColor: '#012f4a',// 边框颜色
            containLabel: true // 包含刻度文字在内
        }
2.2 修改图例组件中的文字颜色 #4c9bfd, 距离右侧 right 为 10%
 // 图例组件
    legend: {
      textStyle: {
        color: '#4c9bfd' // 图例文字颜色
      },
      right: '10%' // 距离右边10%
    },
2.3 x轴相关配置
- 刻度去除
- x轴刻度标签字体颜色:#4c9bfd
- 剔除x坐标轴线颜色(将来使用Y轴分割线)
- 轴两端是不需要内间距 boundaryGap
    xAxis: {
      type: 'category',
      data: ["周一", "周二"],
	  axisTick: {
         show: false // 去除刻度线
       },
       axisLabel: {
         color: '#4c9bfd' // 文本颜色
       },
       axisLine: {
         show: false // 去除轴线
       },
       boundaryGap: false  // 去除轴内间距
    },
2.4 y轴的定制
- 刻度去除
- 字体颜色:#4c9bfd
- 分割线颜色:#012f4a
    yAxis: {
      type: 'value',
      axisTick: {
        show: false  // 去除刻度
      },
      axisLabel: {
        color: '#4c9bfd' // 文字颜色
      },
      splitLine: {
        lineStyle: {
          color: '#012f4a' // 分割线颜色
        }
      }
    },
2.5 两条线形图定制
- 颜色分别:#00f2f1 #ed3f35
- 把折线修饰为圆滑 series 数据中添加 smooth 为 true
    color: ['#00f2f1', '#ed3f35'],
	series: [{
      name:'新增粉丝',
      data: [820, 932, 901, 934, 1290, 1330, 1320],
      type: 'line',
      // 折线修饰为圆滑
      smooth: true,
      },
      {
      name:'新增游客',
      data: [100, 331, 200, 123, 233, 543, 400],
      type: 'line',
      smooth: true,
    }]
2.6 数据配置
// x轴的文字
xAxis: {
  type: 'category',
  data: ['1月', '2月', '3月', '4月', '5月', '6月', '7月', '8月', '9月', '10月', '11月', '12月'],
// 图标数据
    series: [{
      name:'新增粉丝',
      data:  [24, 40, 101, 134, 90, 230, 210, 230, 120, 230, 210, 120],
      type: 'line',
      smooth: true
    },{
      name:'新增游客',
      data: [40, 64, 191, 324, 290, 330, 310, 213, 180, 200, 180, 79],
      type: 'line',
      smooth: true
      }
    }]
2.7 新增需求 点击 2020年 2021年 数据发生变化
以下是后台送过来数据(ajax请求过来的)
 var yearData = [
      {
        year: '2020',  // 年份
        data: [  // 两个数组是因为有两条线
             [24, 40, 101, 134, 90, 230, 210, 230, 120, 230, 210, 120],
             [40, 64, 191, 324, 290, 330, 310, 213, 180, 200, 180, 79]
          ]
      },
      {
        year: '2021',  // 年份
        data: [  // 两个数组是因为有两条线
             [123, 175, 112, 197, 121, 67, 98, 21, 43, 64, 76, 38],
     		[143, 131, 165, 123, 178, 21, 82, 64, 43, 60, 19, 34]
          ]
      }
     ];
tab栏切换事件
- 点击2020按钮 需要把 series 第一个对象里面的data 换成 2020年对象里面data[0]
- 点击2020按钮 需要把 series 第二个对象里面的data 换成 2020年对象里面data[1]
- 2021 按钮同样道理
    // 5.点击切换效果
    $(".line h2").on("click", "a", function () {
        var obj = yearData[$(this).index()];
        option.series[0].data = obj.data[0];
        option.series[1].data = obj.data[1];
        // 需要重新渲染
        myChart.setOption(option);
    });
// 折线图1模块制作
(function() {
  var yearData = [
    {
      year: "2020", // 年份
      data: [
        // 两个数组是因为有两条线
        [24, 40, 101, 134, 90, 230, 210, 230, 120, 230, 210, 120],
        [40, 64, 191, 324, 290, 330, 310, 213, 180, 200, 180, 79]
      ]
    },
    {
      year: "2021", // 年份
      data: [
        // 两个数组是因为有两条线
        [123, 175, 112, 197, 121, 67, 98, 21, 43, 64, 76, 38],
        [143, 131, 165, 123, 178, 21, 82, 64, 43, 60, 19, 34]
      ]
    }
  ];
  // 1. 实例化对象
  var myChart = echarts.init(document.querySelector(".line .chart"));
  // 2.指定配置
  var option = {
    // 通过这个color修改两条线的颜色
    color: ["#00f2f1", "#ed3f35"],
    tooltip: {
      trigger: "axis"
    },
    legend: {
      // 如果series 对象有name 值,则 legend可以不用写data
      // 修改图例组件 文字颜色
      textStyle: {
        color: "#4c9bfd"
      },
      // 这个10% 必须加引号
      right: "10%"
    },
    grid: {
      top: "20%",
      left: "3%",
      right: "4%",
      bottom: "3%",
      show: true, // 显示边框
      borderColor: "#012f4a", // 边框颜色
      containLabel: true // 包含刻度文字在内
    },

    xAxis: {
      type: "category",
      boundaryGap: false,
      data: [
        "1月",
        "2月",
        "3月",
        "4月",
        "5月",
        "6月",
        "7月",
        "8月",
        "9月",
        "10月",
        "11月",
        "12月"
      ],
      axisTick: {
        show: false // 去除刻度线
      },
      axisLabel: {
        color: "#4c9bfd" // 文本颜色
      },
      axisLine: {
        show: false // 去除轴线
      }
    },
    yAxis: {
      type: "value",
      axisTick: {
        show: false // 去除刻度线
      },
      axisLabel: {
        color: "#4c9bfd" // 文本颜色
      },
      axisLine: {
        show: false // 去除轴线
      },
      splitLine: {
        lineStyle: {
          color: "#012f4a" // 分割线颜色
        }
      }
    },
    series: [
      {
        name: "新增粉丝",
        type: "line",
        // true 可以让我们的折线显示带有弧度
        smooth: true,
        data: yearData[0].data[0]
      },
      {
        name: "新增游客",
        type: "line",
        smooth: true,
        data: yearData[0].data[1]
      }
    ]
  };

  // 3. 把配置给实例对象
  myChart.setOption(option);
  // 4. 让图表跟随屏幕自动的去适应
  window.addEventListener("resize", function() {
    myChart.resize();
  });

  // 5.点击切换效果
  $(".line h2").on("click", "a", function() {
    var obj = yearData[$(this).index()];
    option.series[0].data = obj.data[0];
    option.series[1].data = obj.data[1];
    // 需要重新渲染
    myChart.setOption(option);
  });
})();
3 折线图 - 播放量模块制作
3.1 官网找到类似实例, 适当分析,并且引入到HTML页面中
<!DOCTYPE html>
<html>
<head>
    <meta charset="utf-8"/>
    <title>ECharts</title>
    <!-- 引入刚刚下载的 ECharts 文件 -->
    <script src="echarts.js"></script>
</head>
<style>
</style>
<body>
<!-- 为 ECharts 准备一个定义了宽高的 DOM -->
<div id="main" style="width: 600px;height:400px;margin: 0 auto;"></div>
<script type="text/javascript">
    // 1. 实例化对象
    var myChart = echarts.init(document.getElementById("main"));
    // 2. 指定配置和数据
    option = {
        tooltip: {
            trigger: 'axis',
        },
        legend: {
        },
        toolbox: {
            feature: {
            }
        },
        grid: {
            left: '3%',
            right: '4%',
            bottom: '3%',
            containLabel: true
        },
        xAxis: [
            {
                type: 'category',
                boundaryGap: false,
                data: ['Mon', 'Tue', 'Wed', 'Thu', 'Fri', 'Sat', 'Sun']
            }
        ],
        yAxis: [
            {
                type: 'value'
            }
        ],
        series: [
            {
                name: 'Email',
                type: 'line',
                stack: 'Total',
                areaStyle: {},
                emphasis: {
                    focus: 'series'
                },
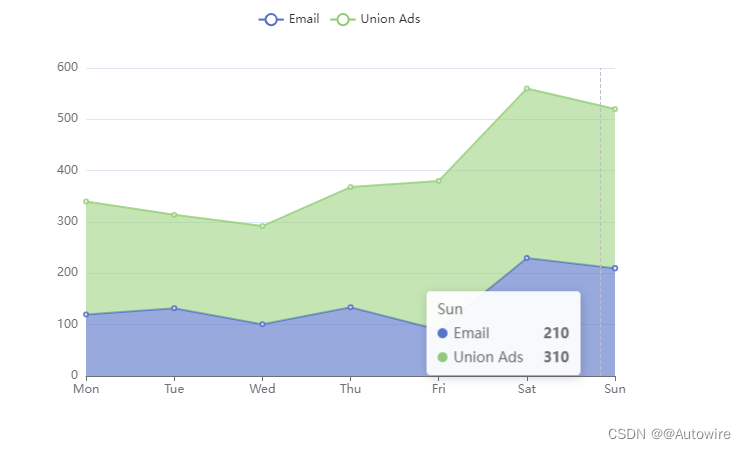
                data: [120, 132, 101, 134, 90, 230, 210]
            },
            {
                name: 'Union Ads',
                type: 'line',
                stack: 'Total',
                areaStyle: {},
                emphasis: {
                    focus: 'series'
                },
                data: [220, 182, 191, 234, 290, 330, 310]
            },

        ]
    };
    // 使用刚指定的配置项和数据显示图表。
    myChart.setOption(option);
</script>
</body>
</html>
3.2 根据需求定制图表
3.2.1 更换图例组件文字颜色 rgba(255,255,255,.5) 文字大小为12
        legend: {
            top: "0%",
            textStyle: {
                color: "red",
                fontSize: "12"
            }
        },
3.2.2 修改图表大小
grid: {
      left: "10",
      top: "30",
      right: "10",
      bottom: "10",
      containLabel: true
    },
3.2.3 修改x轴相关配置
- 修改文本颜色为rgba(255,255,255,.6) 文字大小为 12
- x轴线的颜色为 rgba(255,255,255,.2)
        xAxis: [
            {
                type: 'category',
                boundaryGap: false,
                data: ['Mon', 'Tue', 'Wed', 'Thu', 'Fri', 'Sat', 'Sun'],
                // 文本颜色为rgba(255,255,255,.6)  文字大小为 12
                axisLabel: {
                    textStyle: {
                        color: "red",
                        fontSize: 12
                    }
                },
                // x轴线的颜色为   rgba(255,255,255,.2)
                axisLine: {
                    lineStyle: {
                        color: "red"
                    }
                },
            },
        ],
3.2.4 修改y轴的相关配置
        yAxis: [
            {
                type: 'value',
                axisTick: {show: false},
                axisLine: {
                    lineStyle: {
                        color: "green"
                    }
                },
                axisLabel: {
                    textStyle: {
                        color: "green",
                        fontSize: 12
                    }
                },
                // 修改分割线的颜色
                splitLine: {
                    lineStyle: {
                        color: "green"
                    }
                }

            }
        ],
3.2.5 修改两个线模块配置(注意在series 里面定制)
- 线是圆滑
- 单独修改线的样式
- 填充区域
- 设置拐点 小圆点 拐点大小 设置拐点颜色以及边框
- 开始不显示拐点, 鼠标经过显示
       //第一条 线是圆滑
       smooth: true,
        // 单独修改线的样式
        lineStyle: {
            color: "#0184d5",
            width: 2
        },
         // 填充区域
        areaStyle: {
              // 渐变色,只需要复制即可
            color: new echarts.graphic.LinearGradient(
              0,
              0,
              0,
              1,
              [
                {
                  offset: 0,
                  color: "rgba(1, 132, 213, 0.4)"   // 渐变色的起始颜色
                },
                {
                  offset: 0.8,
                  color: "rgba(1, 132, 213, 0.1)"   // 渐变线的结束颜色
                }
              ],
              false
            ),
            shadowColor: "rgba(0, 0, 0, 0.1)"
        },
        // 设置拐点 小圆点
        symbol: "circle",
        // 拐点大小
        symbolSize: 8,
        // 设置拐点颜色以及边框
       itemStyle: {
            color: "#0184d5",
            borderColor: "rgba(221, 220, 107, .1)",
            borderWidth: 12
        },
        // 开始不显示拐点, 鼠标经过显示
        showSymbol: false,
