python画图
- 1.使用matplotlib画图
- 2.使用pyecharts画图
- 2.x pyecharts的三种图片渲染工具
- 2.x.1 snapshot_selenium
- 2.x.2 snapshot_phantomjs
- 2.x.3 snapshot_pyppeteer
1.使用matplotlib画图
2.使用pyecharts画图
pyecharts是一款将python与echarts结合的强大的数据可视化工具,官网有学习手册,pyecharts 用于 web 绘图,有较多的绘图种类,且代码量比较少。而Echarts 是百度开源的一个可视化 JavaScript 库。
Globe 地图 MapGlobe
import pyecharts.options as opts
from pyecharts.charts import MapGlobe
from pyecharts.faker import POPULATION

data = [x for _, x in POPULATION[1:]]
low, high = min(data), max(data)

c = (
    MapGlobe()
    .add_schema()
    .add(
        maptype="world",
        series_name="World Population",
        data_pair=POPULATION[1:],
        is_map_symbol_show=False,
        label_opts=opts.LabelOpts(is_show=False),
    )
    .set_global_opts(
        visualmap_opts=opts.VisualMapOpts(
            min_=low,
            max_=high,
            range_text=["max", "min"],
            is_calculable=True,
            range_color=["lightskyblue", "yellow", "orangered"],
        )
    )
    .render("D:\python\paints\map_globe_base.html")
)
图像
2.x pyecharts的三种图片渲染工具
pyecharts 可以将图片保存为多种格式,但需要插件,否则只能保存为 html 格式。
2.x.1 snapshot_selenium
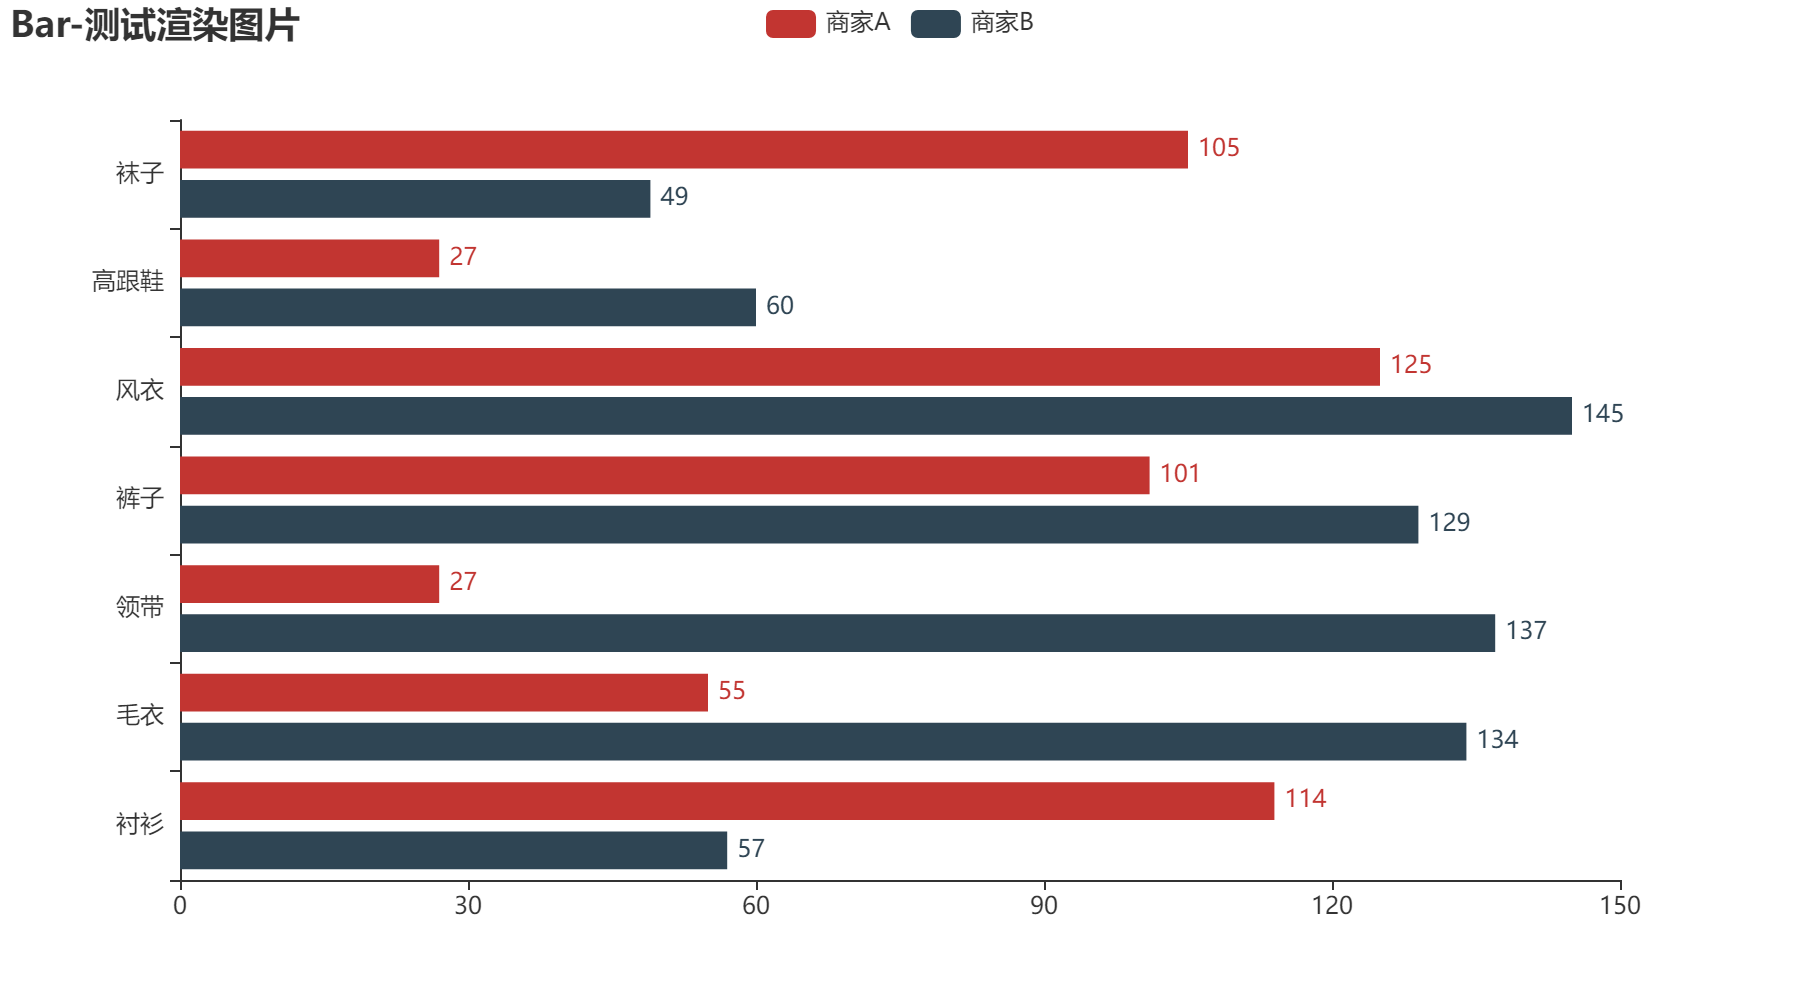
安装:pip install snapshot-selenium
from pyecharts import options as opts
from pyecharts.charts import Bar
from pyecharts.render import make_snapshot

from snapshot_selenium import snapshot

def bar_chart() -> Bar:
    c = (
        Bar()
        .add_xaxis(["衬衫", "毛衣", "领带", "裤子", "风衣", "高跟鞋", "袜子"])
        .add_yaxis("商家A", [114, 55, 27, 101, 125, 27, 105])
        .add_yaxis("商家B", [57, 134, 137, 129, 145, 60, 49])
        .reversal_axis()
        .set_series_opts(label_opts=opts.LabelOpts(position="right"))
        .set_global_opts(title_opts=opts.TitleOpts(title="Bar-测试渲染图片"))
    )
    return c

make_snapshot(snapshot, bar_chart().render(), "bar0.png")
2.x.2 snapshot_phantomjs
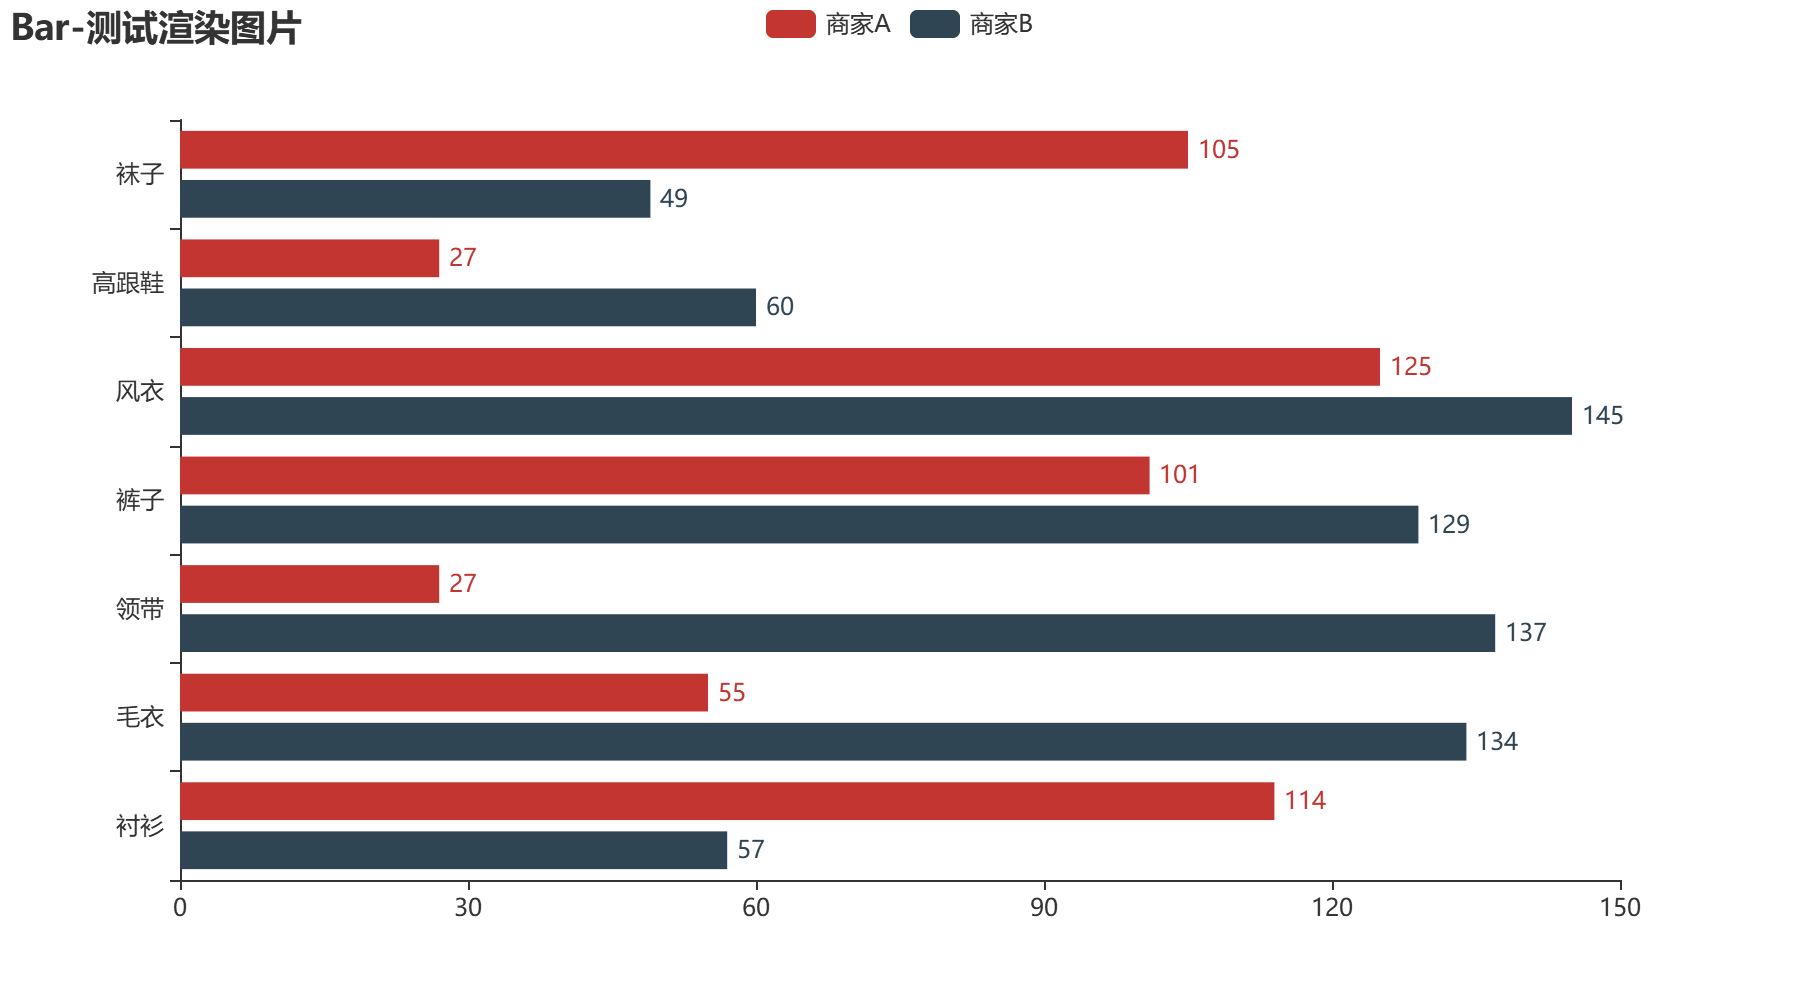
安装:pip install snapshot-phantomjs
我在安装时出现了一点儿小问题,大概率没这个问题所以这部分可以跳过,于是就先安装了nodejs(node -v 和npm -v都有版本信息时说明安装成功),然后安装了phantomjs(npm install -g phantomjs-prebuilt或者官网下载phantomjs.exe文件放到对应环境的scripts文件夹下再加入到环境变量path中)和pyecharts-snapshot(pip install pyecharts-snapshot )。
# 使用方式
from pyecharts import options as opts
from pyecharts.charts import Bar
from pyecharts.render import make_snapshot

from snapshot_phantomjs import snapshot

def bar_chart() -> Bar:
    c = (
        Bar()
        .add_xaxis(["衬衫", "毛衣", "领带", "裤子", "风衣", "高跟鞋", "袜子"])
        .add_yaxis("商家A", [114, 55, 27, 101, 125, 27, 105])
        .add_yaxis("商家B", [57, 134, 137, 129, 145, 60, 49])
        .reversal_axis()
        .set_series_opts(label_opts=opts.LabelOpts(position="right"))
        .set_global_opts(title_opts=opts.TitleOpts(title="Bar-测试渲染图片"))
    )
    return c

make_snapshot(snapshot, bar_chart().render(), "bar0.png")
2.x.3 snapshot_pyppeteer
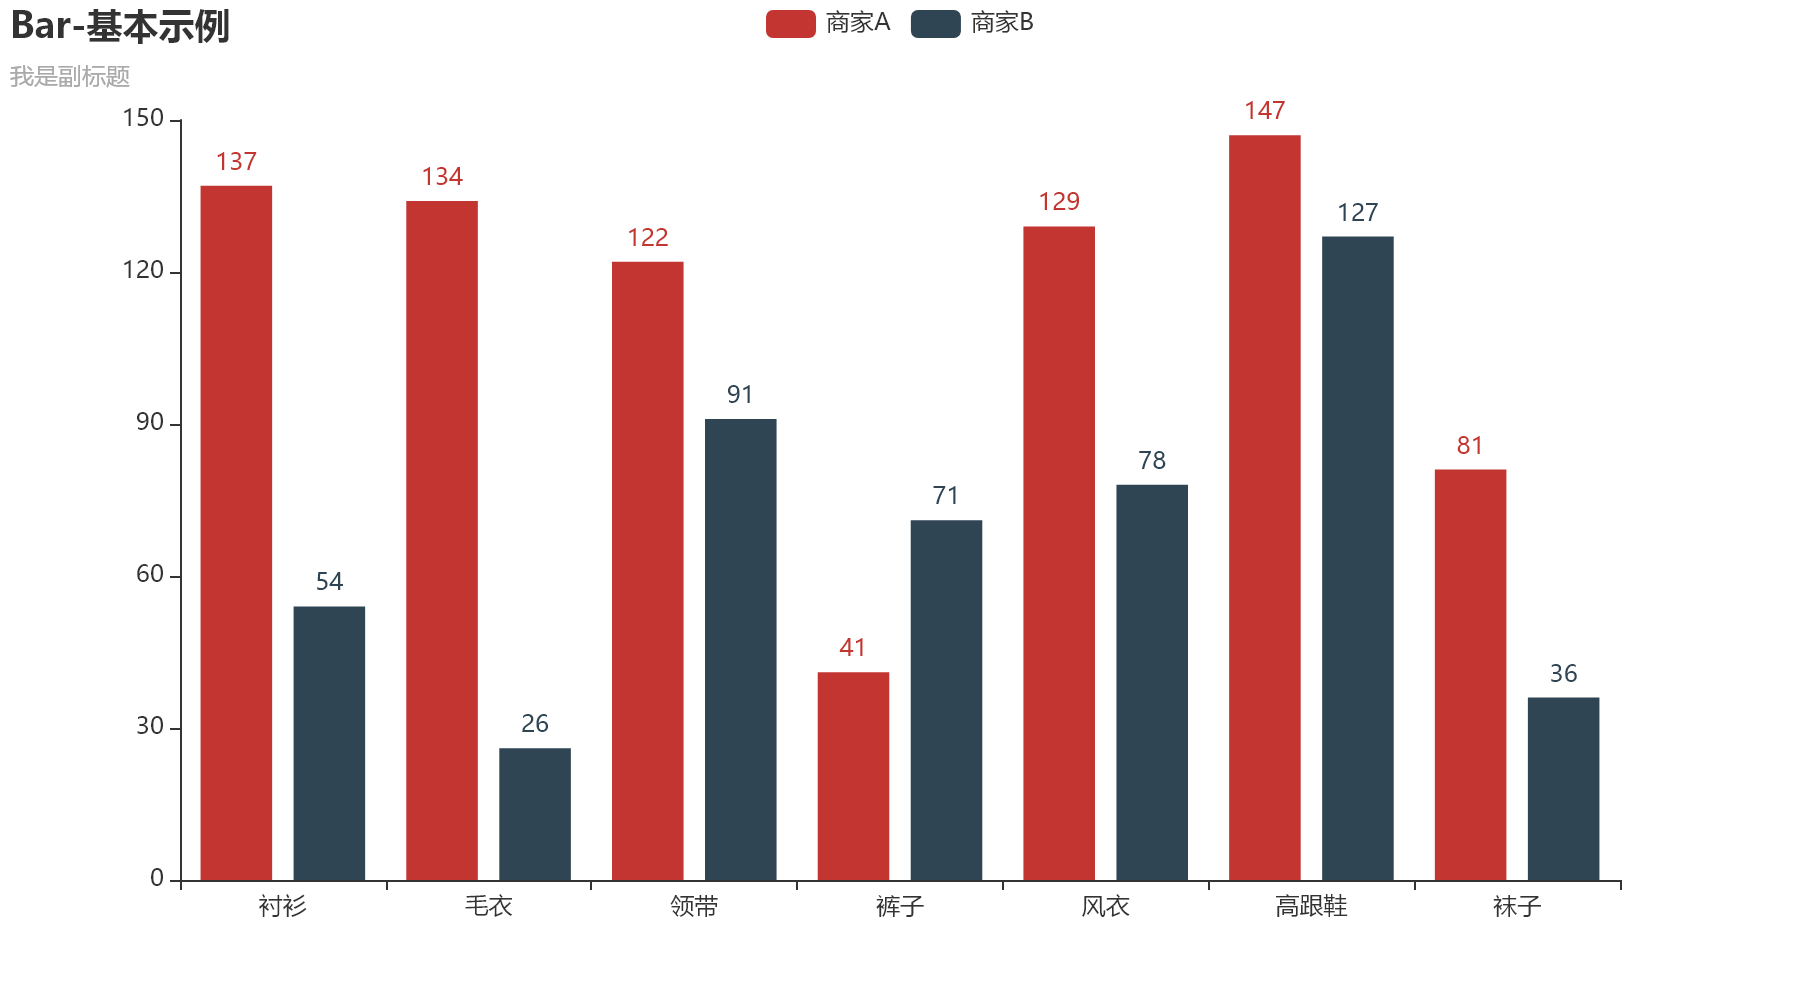
下载:pip install snapshot-pyppeteer
pyppeteer-install
# 使用方式
from snapshot_pyppeteer import snapshot

from pyecharts.charts import Bar
from pyecharts.faker import Faker
from pyecharts import options as opts
from pyecharts.render import make_snapshot


def bar_base() -> Bar:
    c = (
        Bar()
        .add_xaxis(Faker.choose())
        .add_yaxis("商家A", Faker.values())
        .add_yaxis("商家B", Faker.values())
        .set_global_opts(title_opts=opts.TitleOpts(title="Bar-基本示例", subtitle="我是副标题"))
    )
    make_snapshot(snapshot, c.render(), "bar.png")


if __name__ == '__main__':
    bar_base()
标记文本



![[附源码]Python计算机毕业设计电影院订票系统](https://img-blog.csdnimg.cn/9edf7d8267d945eaa63501a696ea3e4e.png)

