这周闲来无事,看到一篇前不久刚发表的文章,是做密集人群密度估计的,这块我之前虽然也做过,但是主要是基于检测的方式实现的,这里提出来的方法还是比较有意思的,就拿来实践一下。
论文在这里,感兴趣可以看下。


可以看到还是很有意思的。
这里使用的是jhu_crowd_v2.0数据集,如下:

以train为例如下所示:

images目录如下所示:

gt目录如下所示:

实例标注数据如下:
166 228 22 27 1 0
414 218 11 15 1 0
541 232 14 14 1 0
353 213 11 15 1 0
629 222 14 14 1 0
497 243 39 43 1 0
468 222 11 15 1 0
448 227 11 15 1 0
737 220 39 43 1 0
188 228 33 30 1 0
72 198 22 27 1 0
371 214 11 15 1 0
362 242 24 32 1 0
606 260 39 43 1 0
74 228 22 27 1 0
597 226 14 14 1 0
576 213 14 14 1 0
数据集详情如下:
This file contains information about the JHU-CROWD++ (v2.0) dataset.

-----------------------------------------------------------------------------------------------------
INTRODUCTION
-----------------------------------------------------------------------------------------------------

JHU-CROWD++ is a comprehensive dataset with 4,372 images and 1.51 million annotations. In comparison
to existing datasets, the proposed dataset is collected under a variety of diverse scenarios and
environmental conditions. In addition, the dataset provides comparatively richer set of annotations
like dots, approximate bounding boxes, blur levels, etc.

-----------------------------------------------------------------------------------------------------
DIRECTORY INFO
-----------------------------------------------------------------------------------------------------
1. The dataset directory contains 3 sub-directories: train, val and test.

2. Each of these contain 2 sub-directories (images, gt) and a file "image_labels.txt".

3. The "images" directory contains images and the "gt" directory contains ground-truth files
   corresponding to the images in the images directory.

4. The number of samples in train, val and test split are 2272, 500, 1600 respectively.

-----------------------------------------------------------------------------------------------------
GROUND-TRUTH ANNOTATIONS: "HEAD-LEVEL"
-----------------------------------------------------------------------------------------------------
1. Each ground-truth file in the "gt" directory contains "space" separated values with each row
   inidacting x,y,w,h,o,b

2. x,y indicate the head location.

3. w,h indicate approximate width and height of the head.

4. o indicates occlusion-level and it can take 3 possible values: 1,2,3.
   o=1 indicates "visible"
   o=2 indicates "partial-occlusion"
   o=3 indicates "full-occlusion"

5. b indicates blur-level and it can take 2 possible values: 0,1.
   b=0 indicates no-blur
   b=1 indicates blur

-----------------------------------------------------------------------------------------------------
GROUND-TRUTH ANNOTATIONS: "IMAGE-LEVEL"
-----------------------------------------------------------------------------------------------------
1. Each split in the dataset contains a file "image_labels.txt". This file contains image-level labels.

2. The values in the file are comma separated and each row indicates:
    "filename, total-count, scene-type, weather-condition, distractor"

3. total-count indicates the total number of people in the image

4. scene-type is an image-level label describing the scene

5. weather-condition indicates the weather-degradation in the image and can take 4 values: 0,1,2,3
   weather-condition=0 indicates "no weather degradation"
   weather-condition=1 indicates "fog/haze"
   weather-condition=2 indicates "rain"
   weather-condition=3 indicates "snow"

6. distractor indicates if the image is a distractor. It can take 2 values: 0,1
   distractor=0 indicates "not a distractor"
   distractor=1 indicates "distractor"

-----------------------------------------------------------------------------------------------------
CITATION
-----------------------------------------------------------------------------------------------------

If you find this dataset useful, please consider citing the following work:

@inproceedings{sindagi2019pushing,
title={Pushing the frontiers of unconstrained crowd counting: New dataset and benchmark method},
author={Sindagi, Vishwanath A and Yasarla, Rajeev and Patel, Vishal M},
booktitle={Proceedings of the IEEE International Conference on Computer Vision},
pages={1221--1231},
year={2019}
}

@article{sindagi2020jhu-crowd,
title={JHU-CROWD++: Large-Scale Crowd Counting Dataset and A Benchmark Method},
author={Sindagi, Vishwanath A and Yasarla, Rajeev and Patel, Vishal M},
journal={Tech Report},
year={2020}
}


-----------------------------------------------------------------------------------------------------
LICENSE
-----------------------------------------------------------------------------------------------------

This dataset is for academic and non-commercial uses (such as academic research, teaching, scientific
publications, or personal experimentation). All images of the JHU-CROWD++ are obtained from the Internet
which are not property of VIU-Lab, The Johns Hopkins University (JHU). please contact us if you find
yourself or your personal belongings in the data, and we (VIU-Lab) will immediately remove the concerned
 images from our servers. By downloading and/or using the dataset, you acknowledge that you have read,
 understand, and agree to be bound by the following terms and conditions.

1. All images are obtained from the Internet. We are not responsible for the content/meaning of these
   images.
2. Specific care has been taken to reduce labeling errors. Nevertheless, we do not accept any responsibility
   for errors or omissions.
3. You agree not to reproduce, duplicate, copy, sell, trade, resell or exploit for any commercial purposes,
   any portion of the images and any portion of derived data.
4. You agree not to use the dataset or any derivative work for commercial purposes as, for example, licensing
   or selling the data, or using the data with a purpose to procure a commercial gain.
5. All rights not expressly granted to you are reserved by us (VIU-Lab, JHU).
6. You acknowledge that the dataset is a valuable scientific resource and agree to appropriately reference
   the following papers in any publication making use of the Data & Software:
   Sindagi et al., "Pushing the frontiers of unconstrained crowd counting: New dataset and benchmark method",
   ICCV 2019.
   Sindagi et al., "JHU-CROWD++: Large-Scale Crowd Counting Dataset and A Benchmark Method", Arxiv 2020.
首先处理原始数据集如下:

处理完成结果如下:

之后就可以启动模型训练了,因为没有开源出来可用的预训练权重,所以这里是只能自己训练,如下:
from utils.regression_trainer_cosine import RegTrainer
import argparse
import os
import torch
args = None

def parse_args():
    parser = argparse.ArgumentParser(description='Train ')
    parser.add_argument('--model-name', default='vgg19_trans', help='the name of the model')
    parser.add_argument('--data-dir', default='./JHU-Train-Val-Test',help='training data directory')
    parser.add_argument('--save-dir', default='./model',help='directory to save models.')
    parser.add_argument('--save-all', type=bool, default=False,help='whether to save all best model')
    parser.add_argument('--lr', type=float, default=5*1e-6,help='the initial learning rate')
    parser.add_argument('--weight-decay', type=float, default=1e-5,help='the weight decay')
    parser.add_argument('--resume', default='',help='the path of resume training model')
    parser.add_argument('--max-model-num', type=int, default=1,help='max models num to save ')
    parser.add_argument('--max-epoch', type=int, default=120,help='max training epoch')
    parser.add_argument('--val-epoch', type=int, default=5,help='the num of steps to log training information')
    parser.add_argument('--val-start', type=int, default=60,help='the epoch start to val')
    parser.add_argument('--batch-size', type=int, default=8,help='train batch size')
    parser.add_argument('--device', default='0', help='assign device')
    parser.add_argument('--num-workers', type=int, default=0,help='the num of training process')
    parser.add_argument('--is-gray', type=bool, default=False,help='whether the input image is gray')
    parser.add_argument('--crop-size', type=int, default=512,help='the crop size of the train image')
    parser.add_argument('--downsample-ratio', type=int, default=16,help='downsample ratio')
    parser.add_argument('--use-background', type=bool, default=True,help='whether to use background modelling')
    parser.add_argument('--sigma', type=float, default=8.0, help='sigma for likelihood')
    parser.add_argument('--background-ratio', type=float, default=0.15,help='background ratio')
    args = parser.parse_args()
    return args


if __name__ == '__main__':
    args = parse_args()
    torch.backends.cudnn.benchmark = True
    os.environ['CUDA_VISIBLE_DEVICES'] = args.device.strip()  # set vis gpu
    trainer = RegTrainer(args)
    trainer.setup()
    trainer.train()
训练时间还是很长的,这里等待训练结束后,结果文件如下所示:

日志输出如下所示:
02-14 12:25:04 using 1 gpus
02-14 12:25:10 -----Epoch 0/119-----
02-14 12:27:03 Epoch 0 Train, Loss: 2914.89, MSE: 202.49 MAE: 81.49, Cost 112.6 sec
02-14 12:27:03 -----Epoch 1/119-----
02-14 12:28:45 Epoch 1 Train, Loss: 2691.07, MSE: 128.28 MAE: 44.69, Cost 102.0 sec
02-14 12:28:46 -----Epoch 2/119-----
02-14 12:30:28 Epoch 2 Train, Loss: 2687.40, MSE: 140.69 MAE: 43.30, Cost 102.5 sec
02-14 12:30:29 -----Epoch 3/119-----
02-14 12:32:11 Epoch 3 Train, Loss: 2688.95, MSE: 208.25 MAE: 45.59, Cost 102.1 sec
02-14 12:32:12 -----Epoch 4/119-----
02-14 12:33:55 Epoch 4 Train, Loss: 2682.65, MSE: 163.37 MAE: 39.28, Cost 103.2 sec
02-14 12:33:55 -----Epoch 5/119-----
02-14 12:35:37 Epoch 5 Train, Loss: 2677.02, MSE: 103.38 MAE: 33.43, Cost 102.0 sec
02-14 12:35:38 -----Epoch 6/119-----
02-14 12:37:15 Epoch 6 Train, Loss: 2677.04, MSE: 108.78 MAE: 34.17, Cost 96.5 sec
02-14 12:37:15 -----Epoch 7/119-----
02-14 12:38:58 Epoch 7 Train, Loss: 2676.39, MSE: 97.53 MAE: 33.18, Cost 103.1 sec
02-14 12:38:59 -----Epoch 8/119-----
02-14 12:40:41 Epoch 8 Train, Loss: 2675.40, MSE: 100.08 MAE: 31.75, Cost 102.4 sec
02-14 12:40:42 -----Epoch 9/119-----
02-14 12:42:24 Epoch 9 Train, Loss: 2676.26, MSE: 115.38 MAE: 33.94, Cost 101.8 sec
02-14 12:42:24 -----Epoch 10/119-----
02-14 12:44:07 Epoch 10 Train, Loss: 2674.91, MSE: 107.85 MAE: 31.79, Cost 102.7 sec
02-14 12:44:08 -----Epoch 11/119-----
02-14 12:45:49 Epoch 11 Train, Loss: 2675.62, MSE: 128.87 MAE: 31.46, Cost 101.5 sec
02-14 12:45:50 -----Epoch 12/119-----
02-14 12:47:32 Epoch 12 Train, Loss: 2672.00, MSE: 90.30 MAE: 27.87, Cost 102.0 sec
02-14 12:47:32 -----Epoch 13/119-----
02-14 12:49:14 Epoch 13 Train, Loss: 2671.85, MSE: 93.11 MAE: 28.77, Cost 101.6 sec
02-14 12:49:14 -----Epoch 14/119-----
02-14 12:50:57 Epoch 14 Train, Loss: 2674.60, MSE: 111.70 MAE: 31.27, Cost 102.4 sec
为了直观可视化分析,这里我对其结果日志进行可视化展示如下所示:

直观来看整体训练还不错。
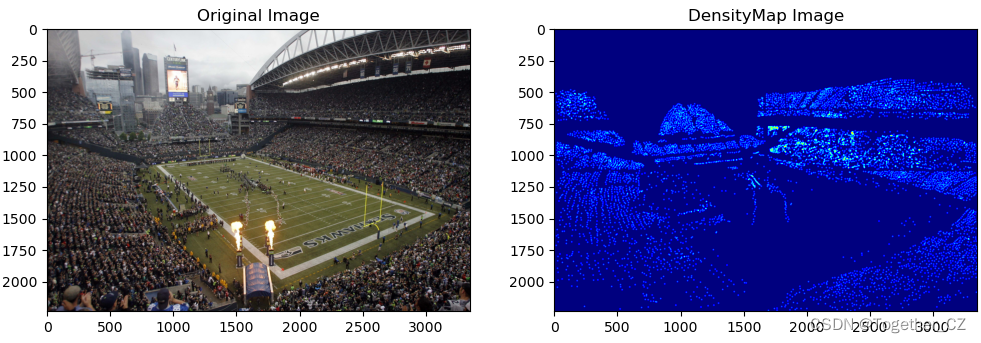
接下来绘制密度热力图如下:

