🍉CSDN小墨&晓末:https://blog.csdn.net/jd1813346972
个人介绍: 研一|统计学|干货分享
擅长Python、Matlab、R等主流编程软件
累计十余项国家级比赛奖项,参与研究经费10w、40w级横向
文章目录
- 1 加载相关包并读取数据
- 2 学生金额交易情况柱状图模块
- 3 标题模块
- 4 交易类型成功率仪表板模块
- 5 交易类型占比圆环图模块
- 6 学生消费位置情况金字塔图模块
- 7 学生交易月度预测值折线图模块
- 8 学生交易余额情况柱状图模块
- 9 模块拼接保存
- 10 页面布局优化
- 11 完整代码
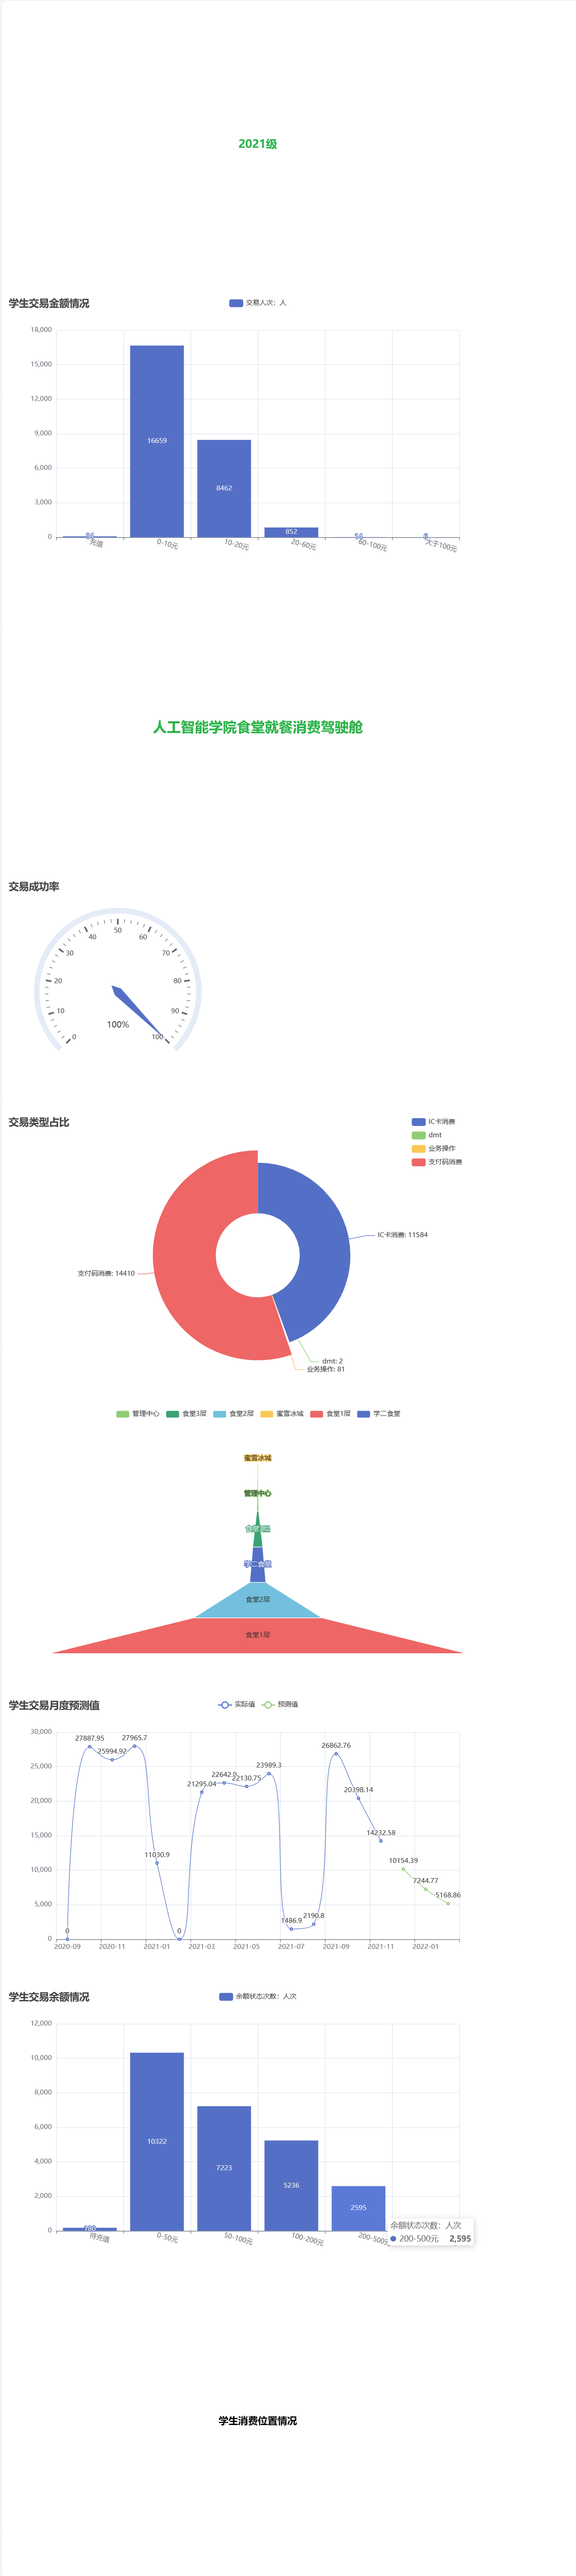
该篇文章利用Python对某学校2021级人工智能学院食堂情况就餐消费制作可视化大屏,包括六大核心模块:学生交易金额;交易成功率;学生交易类型情况;学生消费位置情况;学生交易月度预测;学生交易余额情况。各模块以不同类型图展示,其中学生交易月度预测模块嵌入自动寻优的ARIMA算法。
文末附完整代码!望关注支持!

1 加载相关包并读取数据
运行程序:
import pandas as pd
import pmdarima as pm
from pandas import DataFrame
import warnings
warnings.filterwarnings('ignore')
from pyecharts import options as opts
from pyecharts.charts import Bar,Gauge,Pie,Page,Funnel
from bs4 import BeautifulSoup
##预测
import statsmodels.api as sm
from statsmodels.tsa.stattools import adfuller
from pyecharts.charts import Line
data = pd.read_excel(r'D:\\驾驶舱\\2021级人工智能食堂就餐消费明细.xlsx',sheet_name=0)
2 学生金额交易情况柱状图模块
运行程序:
score_list =data['交易金额']
print(score_list)
# 指定多个区间
bins = [-100, 0, 10,20,60, 100, 200]
score_cut = pd.cut(score_list, bins)
print(type(score_cut)) # <class 'pandas.core.arrays.categorical.Categorical'>
print(score_cut)
print(pd.value_counts(score_cut)) # 统计每个区间人数
bar1=DataFrame(pd.value_counts(score_cut))
# 条形图
def bar():
    #柱状图
    cate = ['充值', '0-10元', '10-20元', '20-60元', '60-100元', '大于100元']
    c = (
    Bar()
    .add_xaxis(cate)
    .add_yaxis("交易人次:人",[84, 16659, 8462, 852, 14, 6])
    .set_global_opts(
        xaxis_opts=opts.AxisOpts(axislabel_opts=opts.LabelOpts(rotate=-15)),
        title_opts=opts.TitleOpts(title="学生交易金额情况")
    )
    )
    return c
运行结果:
交易金额
(0, 10]       16659
(10, 20]       8462
(20, 60]        852
(-100, 0]        84
(60, 100]        14
(100, 200]        6
Name: count, dtype: int64
3 标题模块
运行程序:
def tab0(name,color): #标题
    c = (Pie().
        set_global_opts(
        title_opts=opts.TitleOpts(title=name,pos_left='center',pos_top='center',
                                title_textstyle_opts=opts.TextStyleOpts(color=color,font_size=20))))
    return c


def tab1(name,color): #标题
    c = (Pie().
        set_global_opts(
        title_opts=opts.TitleOpts(title=name,pos_left='center',pos_top='center',
                                title_textstyle_opts=opts.TextStyleOpts(color=color,font_size=25))))
    return c

def tab2(name,color): #标题
    c = (Pie().
        set_global_opts(
        title_opts=opts.TitleOpts(title=name,pos_left='center',pos_top='center',
                                title_textstyle_opts=opts.TextStyleOpts(color=color,font_size=17.5))))
    return c
4 交易类型成功率仪表板模块
运行程序:
def gau():#仪表图
    c = (
        Gauge(init_opts=opts.InitOpts(width="400px", height="400px"))
            .add(series_name="交易成功率", data_pair=[["", 100]])
            .set_global_opts(
            legend_opts=opts.LegendOpts(is_show=False),
            tooltip_opts=opts.TooltipOpts(is_show=True, formatter="{a} <br/>{b} : {c}%"),

        )
        .set_global_opts(
        title_opts=opts.TitleOpts(title="交易成功率"),
        legend_opts=opts.LegendOpts(is_show=False),
    )
            #.render("gauge.html")
    )
    return c
5 交易类型占比圆环图模块
运行程序:
def gau():#仪表图
    c = (
        Gauge(init_opts=opts.InitOpts(width="400px", height="400px"))
            .add(series_name="交易成功率", data_pair=[["", 100]])
            .set_global_opts(
            legend_opts=opts.LegendOpts(is_show=False),
            tooltip_opts=opts.TooltipOpts(is_show=True, formatter="{a} <br/>{b} : {c}%"),

        )
        .set_global_opts(
        title_opts=opts.TitleOpts(title="交易成功率"),
        legend_opts=opts.LegendOpts(is_show=False),
    )
            #.render("gauge.html")
    )
    return c
6 学生消费位置情况金字塔图模块
运行程序:
data1=data
data1['终端名称']=data1['终端名称'].apply(lambda x:x[0:4]).tolist()
df2=pd.DataFrame(data1.groupby('终端名称').count())

df2.iloc[:,0]
def funnel():
    cate = ['学二食堂', '管理中心', '蜜雪冰城', '食堂1层', '食堂2层','食堂3层']
    data = [731, 83, 40, 18916, 5855,452]
    c = Funnel()
    c.add("用户数", [list(z) for z in zip(cate, data)],
               sort_='ascending',
               label_opts=opts.LabelOpts(position="inside"))
    c.set_global_opts(title_opts=opts.TitleOpts(title=""))


    return c
7 学生交易月度预测值折线图模块
运行程序:
data1=data
data1['终端名称']=data1['终端名称'].apply(lambda x:x[0:4]).tolist()
df2=pd.DataFrame(data1.groupby('终端名称').count())

df2.iloc[:,0]
def funnel():
    cate = ['学二食堂', '管理中心', '蜜雪冰城', '食堂1层', '食堂2层','食堂3层']
    data = [731, 83, 40, 18916, 5855,452]
    c = Funnel()
    c.add("用户数", [list(z) for z in zip(cate, data)],
               sort_='ascending',
               label_opts=opts.LabelOpts(position="inside"))
    c.set_global_opts(title_opts=opts.TitleOpts(title=""))


    return c
运行结果:
 ARIMA(0,0,0)(0,0,0)[0]             : AIC=340.998, Time=0.01 sec
 ARIMA(0,0,1)(0,0,0)[0]             : AIC=inf, Time=0.02 sec
 ARIMA(0,0,2)(0,0,0)[0]             : AIC=inf, Time=0.05 sec
 ARIMA(0,0,3)(0,0,0)[0]             : AIC=341.289, Time=0.02 sec
 ARIMA(0,0,4)(0,0,0)[0]             : AIC=333.644, Time=0.07 sec
 ARIMA(0,0,5)(0,0,0)[0]             : AIC=333.412, Time=0.09 sec
 ARIMA(1,0,0)(0,0,0)[0]             : AIC=331.546, Time=0.01 sec
 ARIMA(1,0,1)(0,0,0)[0]             : AIC=331.817, Time=0.02 sec
 ARIMA(1,0,2)(0,0,0)[0]             : AIC=inf, Time=0.07 sec
 ARIMA(1,0,3)(0,0,0)[0]             : AIC=334.645, Time=0.04 sec
 ARIMA(1,0,4)(0,0,0)[0]             : AIC=inf, Time=0.05 sec
 ARIMA(2,0,0)(0,0,0)[0]             : AIC=333.891, Time=0.01 sec
 ARIMA(2,0,1)(0,0,0)[0]             : AIC=inf, Time=0.05 sec
 ARIMA(2,0,2)(0,0,0)[0]             : AIC=inf, Time=0.17 sec
 ARIMA(2,0,3)(0,0,0)[0]             : AIC=inf, Time=0.11 sec
 ARIMA(3,0,0)(0,0,0)[0]             : AIC=334.395, Time=0.02 sec
 ARIMA(3,0,1)(0,0,0)[0]             : AIC=333.921, Time=0.04 sec
 ARIMA(3,0,2)(0,0,0)[0]             : AIC=inf, Time=0.11 sec
 ARIMA(4,0,0)(0,0,0)[0]             : AIC=336.171, Time=0.02 sec
 ARIMA(4,0,1)(0,0,0)[0]             : AIC=335.691, Time=0.05 sec
 ARIMA(5,0,0)(0,0,0)[0]             : AIC=inf, Time=0.05 sec

Best model:  ARIMA(1,0,0)(0,0,0)[0]
Total fit time: 1.094 seconds
2021-12-31    10154.394624
2022-01-31     7244.767300
2022-02-28     5168.860890
Freq: M, dtype: float64
8 学生交易余额情况柱状图模块
运行程序:
##条形图
##条形图数据
score_list1 =data['可用余额(交易后)']
print(score_list1)
# 指定多个区间
bins1 = [-1000,0,50, 100,200,500, 1000]
score_cut1 = pd.cut(score_list1, bins1)
print(type(score_cut1)) # <class 'pandas.core.arrays.categorical.Categorical'>
print(score_cut1)
print(pd.value_counts(score_cut1)) # 统计每个区间人数
bar2=DataFrame(pd.value_counts(score_cut1))
def bar2():
    #柱状图
    cate = ['待充值', '0-50元', '50-100元', '100-200元', '200-500元', '大于500元']
    c = (
    Bar()
    .add_xaxis(cate)
    .add_yaxis("余额状态次数:人次",[180, 10322, 7223, 5236, 2595, 521])
    .set_global_opts(
        xaxis_opts=opts.AxisOpts(axislabel_opts=opts.LabelOpts(rotate=-15)),
        title_opts=opts.TitleOpts(title="学生交易余额情况")
    )
    )
    return c
运行结果:
0          0.00
1          0.00
2          0.00
3         94.80
4         44.60

26072    204.41
26073     90.36
26074     22.10
26075    367.50
26076      2.02
Name: 可用余额(交易后), Length: 26077, dtype: float64
<class 'pandas.core.series.Series'>
0        (-1000, 0]
1        (-1000, 0]
2        (-1000, 0]
3         (50, 100]
4           (0, 50]

26072    (200, 500]
26073     (50, 100]
26074       (0, 50]
26075    (200, 500]
26076       (0, 50]
Name: 可用余额(交易后), Length: 26077, dtype: category
Categories (6, interval[int64, right]): [(-1000, 0] < (0, 50] < (50, 100] < (100, 200] < (200, 500] <
                                         (500, 1000]]
可用余额(交易后)
(0, 50]        10322
(50, 100]       7223
(100, 200]      5236
(200, 500]      2595
(500, 1000]      521
(-1000, 0]       180
Name: count, dtype: int64
9 模块拼接保存
运行程序:
page = Page()
page.add(
         tab0("2021级","#2CB34A"),
         bar(),
         tab1("人工智能学院食堂就餐消费驾驶舱","#2CB34A"),
         gau(),
         radius(),
         funnel(),
         line(),
         bar2(),
         tab2("学生消费位置情况","black")
         )
page.render("D:\\驾驶舱\\驾驶舱3.html")
运行结果:
10 页面布局优化
运行程序:
##对页面布局
#divs[0][“style”] = “width:10%;height:10%;position:absolute;top:0;left:2%;” 即是我们对Part0的宽度、高度、位置、上边距、左边距的定义,这里我们用百分比以达到屏幕自适应的效果

with open("D:\\驾驶舱\\驾驶舱3.html", "r+", encoding='utf-8') as html:
    html_bf = BeautifulSoup(html, 'lxml')
    divs = html_bf.select('.chart-container')
    divs[0]["style"] = "width:10%;height:10%;position:absolute;top:0;left:2%;"
    divs[1]["style"] = "width:40%;height:40%;position:absolute;top:12%;left:0;"
    divs[2]["style"] = "width:35%;height:10%;position:absolute;top:2%;left:30%;"
    divs[3]["style"] = "width:40%;height:40%;position:absolute;top:10%;left:28%;"
    divs[4]["style"] = "width:40%;height:35%;position:absolute;top:12%;left:55%;"
    divs[5]["style"] = "width:30%;height:35%;position:absolute;top:60%;left:2%;"
    divs[6]["style"] = "width:40%;height:50%;position:absolute;top:50%;left:30%;"
    divs[7]["style"] = "width:35%;height:40%;position:absolute;top:50%;left:65%;"
    divs[8]["style"] = "width:10%;height:10%;position:absolute;top:47%;left:0%;"
    body = html_bf.find("body")
    body["style"] = "background-image:url(背景1.jpg)"  # 更换背景
    html_new = str(html_bf)
    html.seek(0, 0)
    html.truncate()
    html.write(html_new)
运行结果:
11 完整代码
# -*- coding: utf-8 -*-
"""
Created on Thu Dec 15 08:36:32 2022


"""
import pandas as pd
import pmdarima as pm
from pandas import DataFrame
import warnings
warnings.filterwarnings('ignore')
from pyecharts import options as opts
from pyecharts.charts import Bar,Gauge,Pie,Page,Funnel
from bs4 import BeautifulSoup
##预测
import statsmodels.api as sm
from statsmodels.tsa.stattools import adfuller
from pyecharts.charts import Line

data = pd.read_excel(r'D:\\代做项目\\驾驶舱\\2021级人工智能食堂就餐消费明细.xlsx',sheet_name=0)
##共26077条数据
##图1数据

score_list =data['交易金额']
print(score_list)
# 指定多个区间
bins = [-100, 0, 10,20,60, 100, 200]
score_cut = pd.cut(score_list, bins)
print(type(score_cut)) # <class 'pandas.core.arrays.categorical.Categorical'>
print(score_cut)
print(pd.value_counts(score_cut)) # 统计每个区间人数
bar1=DataFrame(pd.value_counts(score_cut))
# 条形图
def bar():
    #柱状图
    cate = ['充值', '0-10元', '10-20元', '20-60元', '60-100元', '大于100元']
    c = (
    Bar()
    .add_xaxis(cate)
    .add_yaxis("交易人次:人",[84, 16659, 8462, 852, 14, 6])
    .set_global_opts(
        xaxis_opts=opts.AxisOpts(axislabel_opts=opts.LabelOpts(rotate=-15)),
        title_opts=opts.TitleOpts(title="学生交易金额情况")
    )
    )
    return c


def tab0(name,color): #标题
    c = (Pie().
        set_global_opts(
        title_opts=opts.TitleOpts(title=name,pos_left='center',pos_top='center',
                                title_textstyle_opts=opts.TextStyleOpts(color=color,font_size=20))))
    return c


def tab1(name,color): #标题
    c = (Pie().
        set_global_opts(
        title_opts=opts.TitleOpts(title=name,pos_left='center',pos_top='center',
                                title_textstyle_opts=opts.TextStyleOpts(color=color,font_size=25))))
    return c

def tab2(name,color): #标题
    c = (Pie().
        set_global_opts(
        title_opts=opts.TitleOpts(title=name,pos_left='center',pos_top='center',
                                title_textstyle_opts=opts.TextStyleOpts(color=color,font_size=17.5))))
    return c


def gau():#仪表图
    c = (
        Gauge(init_opts=opts.InitOpts(width="400px", height="400px"))
            .add(series_name="交易成功率", data_pair=[["", 100]])
            .set_global_opts(
            legend_opts=opts.LegendOpts(is_show=False),
            tooltip_opts=opts.TooltipOpts(is_show=True, formatter="{a} <br/>{b} : {c}%"),

        )
        .set_global_opts(
        title_opts=opts.TitleOpts(title="交易成功率"),
        legend_opts=opts.LegendOpts(is_show=False),
    )
            #.render("gauge.html")
    )
    return c

df1=pd.DataFrame(data.groupby('交易描述').count())
df1.iloc[:,0]
def radius():
    cate = ['IC卡消费', 'dmt', '业务操作', '支付码消费']
    data = [11584, 2, 81,14410]
    c = (
    Pie()
    .add(
        "",
        [
            list(z)
            for z in zip(
                cate,
                data,
            )
        ],
        radius=["30%", "75%"],
        rosetype="radius"
    )
    .set_global_opts(
        title_opts=opts.TitleOpts(title="交易类型占比"),
        legend_opts=opts.LegendOpts(type_="scroll", pos_left="80%", orient="vertical"),
    )
    .set_series_opts(label_opts=opts.LabelOpts(formatter="{b}: {c}"))
)
    return c


data1=data
data1['终端名称']=data1['终端名称'].apply(lambda x:x[0:4]).tolist()
df2=pd.DataFrame(data1.groupby('终端名称').count())

df2.iloc[:,0]
def funnel():
    cate = ['学二食堂', '管理中心', '蜜雪冰城', '食堂1层', '食堂2层','食堂3层']
    data = [731, 83, 40, 18916, 5855,452]
    c = Funnel()
    c.add("用户数", [list(z) for z in zip(cate, data)],
               sort_='ascending',
               label_opts=opts.LabelOpts(position="inside"))
    c.set_global_opts(title_opts=opts.TitleOpts(title=""))


    return c

##预测图
data1=data
data1['记账日期']=data1['记账日期'].astype('str')
data1['记账日期']=data1['记账日期'].apply(lambda x:x[0:6]).tolist()
data2=data1[['记账日期','交易金额']]
data2=pd.DataFrame(data2.groupby('记账日期').sum())
data3=data2.sort_index(axis=1)##根据索引列排序
#data3.to_excel('D:\\代做项目\\驾驶舱\\聚合数据.xlsx',index=True)#将数据文件中未存在的月份赋值为0
data4=pd.read_excel(r'D:\\代做项目\\驾驶舱\\聚合数据.xlsx',sheet_name=0)
data4.set_index('记账日期',inplace = True)

#plt.figure(figsize=(12,8))
#data4.plot()
adfuller(data4['交易金额'])
#非平稳差分
dta=pd.Series(data4['交易金额'])
dta.index = pd.Index(sm.tsa.datetools.dates_from_range('2020m9',length=15))


model = pm.auto_arima(dta, start_p=1, start_q=1,
                           max_p=8, max_q=8, m=1,
                           start_P=0, seasonal=False,
                           max_d=3, trace=True,
                           information_criterion='aic',
                           error_action='ignore',
                           suppress_warnings=True,
                           stepwise=False)
forecast = model.predict(3)#预测未来3个月的数据
print(forecast)
#为绘图的连续性把2090的值添加为PredicValue第一个元素


ser_df1=pd.DataFrame(dta).reset_index()
ser_df1.columns = ['记账日期','交易金额']
ser_df2=pd.DataFrame(forecast).reset_index()
ser_df2.columns = ['记账日期','交易金额']
ser_df3=pd.concat([ser_df1,ser_df2])
ser_df3['记账日期']=ser_df3['记账日期'].astype('str')
ser_df3['记账日期']=ser_df3['记账日期'].apply(lambda x:x[0:7]).tolist()
ser_df3['交易金额']=round(ser_df3['交易金额'],2)
ser_df4=[None,None,None,None,None,None,None,None,None,None,None,None,None,None,None]+list(ser_df3.交易金额)[15:18]


def line():
    c = (
        Line()
        .add_xaxis(list(ser_df3.记账日期))
        .add_yaxis('实际值',list(ser_df3.交易金额)[:15], is_smooth=True)
        .add_yaxis("预测值",ser_df4, is_smooth=True)
        .set_global_opts(title_opts=opts.TitleOpts(title="学生交易月度预测值"))
    )
    return c


##条形图
##条形图数据
score_list1 =data['可用余额(交易后)']
print(score_list1)
# 指定多个区间
bins1 = [-1000,0,50, 100,200,500, 1000]
score_cut1 = pd.cut(score_list1, bins1)
print(type(score_cut1)) # <class 'pandas.core.arrays.categorical.Categorical'>
print(score_cut1)
print(pd.value_counts(score_cut1)) # 统计每个区间人数
bar2=DataFrame(pd.value_counts(score_cut1))
def bar2():
    #柱状图
    cate = ['待充值', '0-50元', '50-100元', '100-200元', '200-500元', '大于500元']
    c = (
    Bar()
    .add_xaxis(cate)
    .add_yaxis("余额状态次数:人次",[180, 10322, 7223, 5236, 2595, 521])
    .set_global_opts(
        xaxis_opts=opts.AxisOpts(axislabel_opts=opts.LabelOpts(rotate=-15)),
        title_opts=opts.TitleOpts(title="学生交易余额情况")
    )
    )
    return c


page = Page()
page.add(
         tab0("2021级","#2CB34A"),
         bar(),
         tab1("人工智能学院食堂就餐消费驾驶舱","#2CB34A"),
         gau(),
         radius(),
         funnel(),
         line(),
         bar2(),
         tab2("学生消费位置情况","black")
         )
page.render("D:\\代做项目\\驾驶舱\\驾驶舱3.html")

##对页面布局
#divs[0][“style”] = “width:10%;height:10%;position:absolute;top:0;left:2%;” 即是我们对Part0的宽度、高度、位置、上边距、左边距的定义,这里我们用百分比以达到屏幕自适应的效果

with open("D:\\代做项目\\驾驶舱\\驾驶舱3.html", "r+", encoding='utf-8') as html:
    html_bf = BeautifulSoup(html, 'lxml')
    divs = html_bf.select('.chart-container')
    divs[0]["style"] = "width:10%;height:10%;position:absolute;top:0;left:2%;"
    divs[1]["style"] = "width:40%;height:40%;position:absolute;top:12%;left:0;"
    divs[2]["style"] = "width:35%;height:10%;position:absolute;top:2%;left:30%;"
    divs[3]["style"] = "width:40%;height:40%;position:absolute;top:10%;left:28%;"
    divs[4]["style"] = "width:40%;height:35%;position:absolute;top:12%;left:55%;"
    divs[5]["style"] = "width:30%;height:35%;position:absolute;top:60%;left:2%;"
    divs[6]["style"] = "width:40%;height:50%;position:absolute;top:50%;left:30%;"
    divs[7]["style"] = "width:35%;height:40%;position:absolute;top:50%;left:65%;"
    divs[8]["style"] = "width:10%;height:10%;position:absolute;top:47%;left:0%;"
    body = html_bf.find("body")
    body["style"] = "background-image:url(背景1.jpg)"  # 更换背景
    html_new = str(html_bf)
    html.seek(0, 0)
    html.truncate()
    html.write(html_new)