本文对 Matplotlib 的用法进行不完全总结。
更新: 2023 / 1 / 4
Python | Matplotlib | 不完全总结
- ImageMagick
- 导库
- 画布
- 创建多子图
- 动图
- 2D
- 柱状图
- 基本:水平 / 垂直柱形
- 主题:颜色、文字、网格线
- 动图
- 线图
- 基本
- 动图
- 3D
- 柱状图
- 基本
- 线图
- 动图
- 参考链接
ImageMagick
参考这里 1
导库
import pandas as pd
import numpy as np
import matplotlib.pyplot as plt
import matplotlib.ticker as ticker
import matplotlib.animation as animation
画布
创建多子图
- 创建图片对象及坐标轴,自定义图片大小
# setup the figure and axes
fig = plt.figure(figsize=(8, 3))
ax1 = fig.add_subplot(121, projection='3d')
ax2 = fig.add_subplot(122, projection='3d')

plt.show()
其中,
    def add_subplot(self, *args, **kwargs):
        """
        Add an `~.axes.Axes` to the figure as part of a subplot arrangement.

        Call signatures::

           add_subplot(nrows, ncols, index, **kwargs)
           add_subplot(pos, **kwargs)
           add_subplot(ax)
           add_subplot()

        Parameters
        ----------
		...
        projection : {None, 'aitoff', 'hammer', 'lambert', 'mollweide', \
'polar', 'rectilinear', str}, optional
            The projection type of the subplot (`~.axes.Axes`). *str* is the
            name of a custom projection, see `~matplotlib.projections`. The
            default None results in a 'rectilinear' projection.
动图
参考这里 2
将使用 matplotlib.animation 中的 FuncAnimation。
FuncAnimation 通过重复调用函数(在画布上绘制)来制作动画。
语法如下,
def __init__(self, fig, func, frames=None, init_func=None, fargs=None,
                 save_count=None, *, cache_frame_data=True, **kwargs):
Animation 是一个幻象:在每一个 frame 中,绘制的对象都使用 update 函数来更新。所有的 frame 都在最后被保存为一个文件(要么是 gif,要么是 mp4)。
2D
参考这里 3
柱状图
准备数据,数据集参考此处的网址 4,将其数据集保存为 3d.csv。
选取出 year=2018 时 value 按倒序排列的 df 的前 10 行,
df = pd.read_csv('3d.csv', usecols=['name', 'group', 'year', 'value'])
current_year = 2018
df = df[df['year'].eq(current_year)].sort_values(by='value', ascending=True).tail(10)
df = df[::-1]

#              name          group  year    value
# 6045        Tokyo           Asia  2018  38194.2
# 1324        Delhi          India  2018  27890.0
# 5547     Shanghai           Asia  2018  25778.6
# 689       Beijing           Asia  2018  22674.2
# 3748       Mumbai          India  2018  22120.0
# 5445    Sao Paulo  Latin America  2018  21697.8
# 3574  Mexico City  Latin America  2018  21520.4
# 4679        Osaka           Asia  2018  20409.0
# 1195        Cairo    Middle East  2018  19849.6
# 1336        Dhaka           Asia  2018  19632.6

print(df['name'].shape, df['name'].unique())
# (10,) ['Tokyo' 'Delhi' 'Shanghai' 'Beijing' 'Mumbai' 'Sao Paulo' 'Mexico City'
#  'Osaka' 'Cairo' 'Dhaka']
上面经筛选后所得的 df 中 name 为唯一值的有 10 个,分别为 ['Tokyo' 'Delhi' 'Shanghai' 'Beijing' 'Mumbai' 'Sao Paulo' 'Mexico City' 'Osaka' 'Cairo' 'Dhaka']。
基本:水平 / 垂直柱形
- 横向
使用 ax.barh(x, y) 来绘制水平柱状图,
fig, ax = plt.subplots(figsize=(15, 8))
ax.barh(df['name'], df['value'])
plt.show()
效果图如下所示,

- 竖向
使用 ax.bar(x, y) 来绘制垂直柱状图,
fig, ax = plt.subplots(figsize=(15, 8))
ax.bar(df['name'], df['value'])
plt.show()
效果图如下所示,

主题:颜色、文字、网格线
- 颜色
使用ax.barh(color=[])来定义bar的颜色,语法如下:
    def barh(self, x=None, y=None, **kwargs):
        """
        Make a horizontal bar plot.

        A horizontal bar plot is a plot that presents quantitative data with
        rectangular bars with lengths proportional to the values that they
        represent. A bar plot shows comparisons among discrete categories. One
        axis of the plot shows the specific categories being compared, and the
        other axis represents a measured value.
        """
        return self(kind="barh", x=x, y=y, **kwargs)
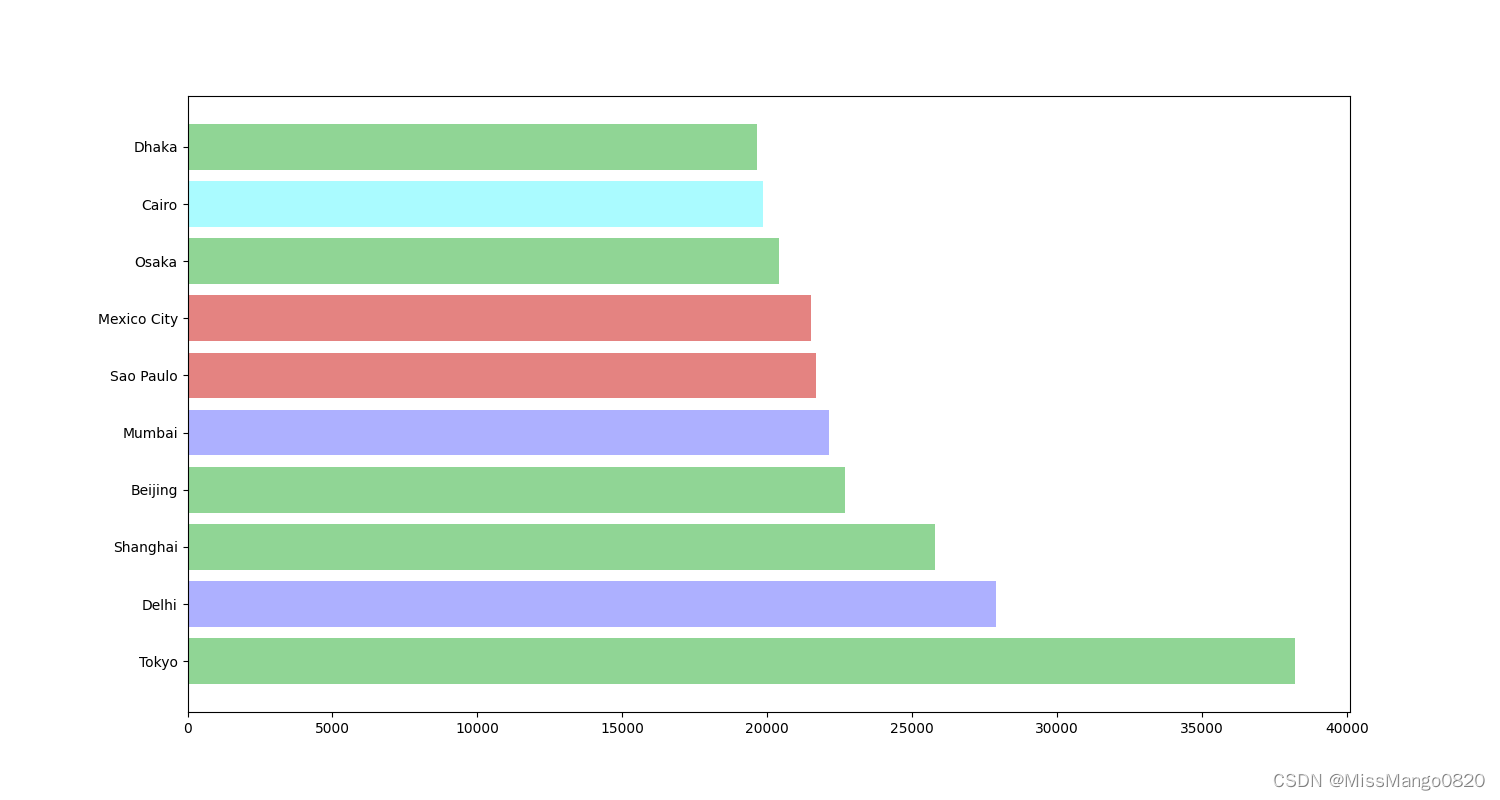
在示例中,
fig, ax = plt.subplots(figsize=(15, 8))

colors = dict(zip(
    ['India','Europe','Asia','Latin America','Middle East','North America','Africa'],
    ['#adb0ff', '#ffb3ff', '#90d595', '#e48381', '#aafbff', '#f7bb5f', '#eafb50']
))
group_lk = df.set_index('name')['group'].to_dict()

ax.barh(df['name'], df['value'], color=[colors[group_lk[x]] for x in df['name']])

plt.show()
效果图如下所示,
- 文字
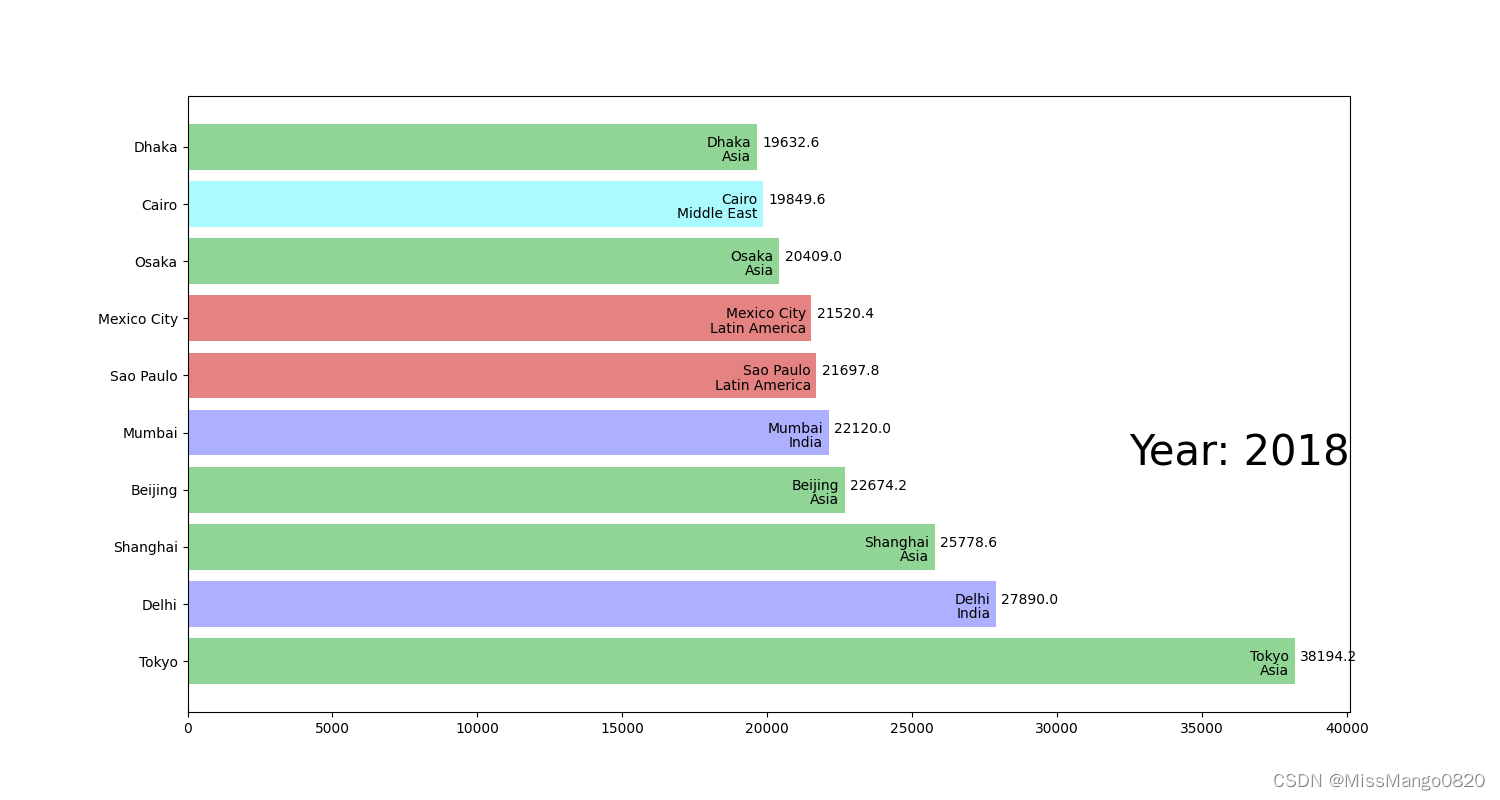
使用 ax.text 来添加文字,语法如下:
    def text(self, x, y, s, fontdict=None, **kwargs):
        """
        Add text to the Axes.

        Add the text *s* to the Axes at location *x*, *y* in data coordinates.

        Parameters
        ----------
        x, y : float
            The position to place the text. By default, this is in data
            coordinates. The coordinate system can be changed using the
            *transform* parameter.

        s : str
            The text.

        fontdict : dict, default: None
            A dictionary to override the default text properties. If fontdict
            is None, the defaults are determined by `.rcParams`.
在示例中,
fig, ax = plt.subplots(figsize=(15, 8))

colors = dict(zip(
    ['India','Europe','Asia','Latin America','Middle East','North America','Africa'],
    ['#adb0ff', '#ffb3ff', '#90d595', '#e48381', '#aafbff', '#f7bb5f', '#eafb50']
))
group_lk = df.set_index('name')['group'].to_dict()

ax.barh(df['name'], df['value'], color=[colors[group_lk[x]] for x in df['name']])

for i, (value, name) in enumerate(zip(df['value'], df['name'])):
    dx = df['value'].max() / 200
    ax.text(value-dx, i,     name,            ha='right', size=10)  # Tokyo: name
    ax.text(value-dx, i-.25, group_lk[name],  ha='right', size=10)  # Asia: group name
    ax.text(value+dx, i,     value,           ha='left', size=10)   # 38194.2: value

ax.text(1, 0.4, f'Year: {current_year}', transform=ax.transAxes, size=30, ha='right')

plt.show()
效果图如下所示,
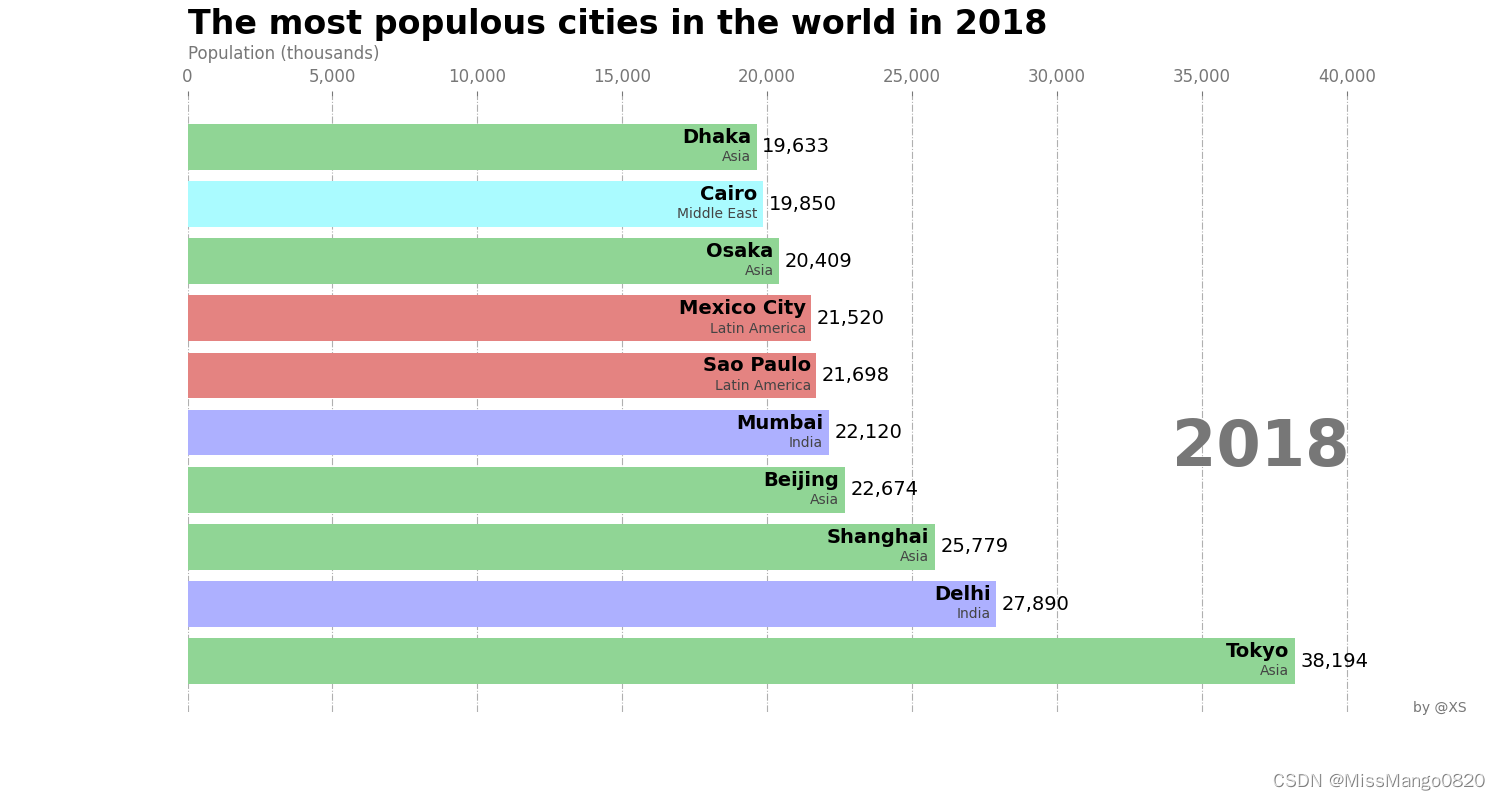
- 复合效果
fig, ax = plt.subplots(figsize=(15, 8))

colors = dict(zip(
    ['India','Europe','Asia','Latin America','Middle East','North America','Africa'],
    ['#adb0ff', '#ffb3ff', '#90d595', '#e48381', '#aafbff', '#f7bb5f', '#eafb50']
))
group_lk = df.set_index('name')['group'].to_dict()

def draw_barchart(df, year):
    df = df[df['year'].eq(year)].sort_values(by='value', ascending=True).tail(10)
    df = df[::-1]
    ax.clear()
    ax.barh(df['name'], df['value'], color=[colors[group_lk[x]] for x in df['name']])
    dx = df['value'].max() / 200
    for i, (value, name) in enumerate(zip(df['value'], df['name'])):
        ax.text(value - dx, i, name, size=14, weight=600, ha='right', va='bottom')
        ax.text(value - dx, i - .25, group_lk[name], size=10, color='#444444', ha='right', va='baseline')
        ax.text(value + dx, i, f'{value:,.0f}', size=14, ha='left', va='center')
    # ... polished styles

    ax.text(0, 1.1, 'The most populous cities in the world in 2018',
            transform=ax.transAxes, size=24, weight=600, ha='left')
    ax.text(0, 1.06, 'Population (thousands)', transform=ax.transAxes, size=12, color='#777777')
    ax.xaxis.set_major_formatter(ticker.StrMethodFormatter('{x:,.0f}'))
    ax.xaxis.set_ticks_position('top')
    ax.tick_params(axis='x', colors='#777777', labelsize=12)
    ax.set_yticks([])
    # ax.margins(0, 0.01)
    ax.grid(which='major', axis='x', linestyle='-.')
    ax.set_axisbelow(True)
    ax.text(1, 0.4, year, transform=ax.transAxes, color='#777777', size=46, ha='right', weight=800)
    ax.text(1.1, 0, 'by @XS', transform=ax.transAxes, ha='right',
            color='#777777', bbox=dict(facecolor='white', alpha=0.8, edgecolor='white'))
    plt.box(False)

draw_barchart(df, 2018)

plt.show()
效果图如下所示,
动图
为了设置动画,我们将使用 matplotlib.animation 中的 FuncAnimation。 FuncAnimation 通过重复调用函数(在画布上绘制)来制作动画。
在我们的例子中,该函数将是 draw_barchart。我们还使用 frame,这个参数接受你想要运行的函数的值 —— 我们将从 1968 年运行到 2018 年。
-
animation
使用 animation 来添加回调函数,
def draw_barchart(year):
    df = pd.read_csv('3d.csv', usecols=['name', 'group', 'year', 'value'])

    colors = dict(zip(
        ['India', 'Europe', 'Asia', 'Latin America', 'Middle East', 'North America', 'Africa'],
        ['#adb0ff', '#ffb3ff', '#90d595', '#e48381', '#aafbff', '#f7bb5f', '#eafb50']
    ))
    group_lk = df.set_index('name')['group'].to_dict()

    df = df[df['year'].eq(year)].sort_values(by='value', ascending=True).tail(10)
    df = df[::-1]
    ax.clear()
    ax.barh(df['name'], df['value'], color=[colors[group_lk[x]] for x in df['name']])
    dx = df['value'].max() / 200
    for i, (value, name) in enumerate(zip(df['value'], df['name'])):
        ax.text(value - dx, i, name, size=14, weight=600, ha='right', va='bottom')
        ax.text(value - dx, i - .25, group_lk[name], size=10, color='#444444', ha='right', va='baseline')
        ax.text(value + dx, i, f'{value:,.0f}', size=14, ha='left', va='center')

    ax.text(0, 1.1, 'The most populous cities in the world in 2018',
            transform=ax.transAxes, size=24, weight=600, ha='left')
    ax.text(0, 1.06, 'Population (thousands)', transform=ax.transAxes, size=12, color='#777777')
    ax.xaxis.set_major_formatter(ticker.StrMethodFormatter('{x:,.0f}'))
    ax.xaxis.set_ticks_position('top')
    ax.tick_params(axis='x', colors='#777777', labelsize=12)
    # ax.set_yticks([])
    ax.margins(0, 0.01)
    ax.grid(which='major', axis='x', linestyle='-.')
    ax.set_axisbelow(True)
    ax.text(1, 0.4, year, transform=ax.transAxes, color='#777777', size=46, ha='right', weight=800)
    ax.text(1.1, 0, 'by @XS', transform=ax.transAxes, ha='right',
            color='#777777', bbox=dict(facecolor='white', alpha=0.8, edgecolor='white'))
    plt.box(False)

fig, ax = plt.subplots(figsize=(15, 8))
animator = animation.FuncAnimation(fig, draw_barchart, repeat_delay=100, frames=range(1968, 2019),)
animator.save(filename='1.gif', writer='imagemagick')
效果图如下所示,

线图
准备数据,如下所示:
# fake data
x = np.linspace(0, 10)
# [ 0.          0.20408163  0.40816327  0.6122449   0.81632653  1.02040816
#   1.2244898   1.42857143  1.63265306  1.83673469  2.04081633  2.24489796
#   2.44897959  2.65306122  2.85714286  3.06122449  3.26530612  3.46938776
#   3.67346939  3.87755102  4.08163265  4.28571429  4.48979592  4.69387755
#   4.89795918  5.10204082  5.30612245  5.51020408  5.71428571  5.91836735
#   6.12244898  6.32653061  6.53061224  6.73469388  6.93877551  7.14285714
#   7.34693878  7.55102041  7.75510204  7.95918367  8.16326531  8.36734694
#   8.57142857  8.7755102   8.97959184  9.18367347  9.3877551   9.59183673
#   9.79591837 10.        ]

y = np.sin(x)
# [ 0.          0.20266794  0.39692415  0.57470604  0.72863478  0.85232157
#   0.94063279  0.98990308  0.99808748  0.96484631  0.89155923  0.78126802
#   0.63855032  0.46932961  0.2806294   0.08028167 -0.12339814 -0.32195632
#  -0.50715171 -0.67129779 -0.80758169 -0.91034694 -0.97532829 -0.99982867
#  -0.9828312  -0.92504137 -0.82885774 -0.6982724  -0.53870529 -0.35677924
#  -0.16004509  0.04333173  0.24491007  0.43632343  0.6096272   0.75762842
#   0.8741843   0.9544572   0.99511539  0.99447137  0.95255185  0.8710967
#   0.75348673  0.60460332  0.43062587  0.23877532  0.0370144  -0.16628279
#  -0.36267843 -0.54402111]
x 为横坐标,y 为纵坐标。
基本
使用 ax.plot(x, y) 来绘制线图,
fig, ax = plt.subplots()
line, = ax.plot(x, y)

plt.show()
效果图如下所示,

动图
x = np.linspace(0, 10)
y = np.sin(x)

fig, ax = plt.subplots()
line, = ax.plot(x, y)

def update(num, x, y, line):
    line.set_data(x[:num], y[:num])
    return line,

ani = animation.FuncAnimation(fig, update, len(x), interval=100,
                              fargs=[x, y, line], blit=True)
ani.save('1.gif', writer='imagemagick', fps=60)
- 前两个参数只是
fig(图形对象)和update(更新每一帧中绘制对象的函数)。 - 传递给构造函数的第三个参数是
len(x),它指示数据点的总数(回想一下x和y是列表)。这正是传递给update的num参数!在每一帧中,一个从1到len(x)的值被赋予更新函数以生成不同的图。这些情节构成了Animation的 “幻觉”。 - 参数
interval是以毫秒为单位的帧之间的延迟,在这种情况下设置为100 ms。 - 参数
fargs是一个包含传递给更新函数的其他参数(除了num)的元组,它是x、y和line的顺序相同的元组。 - 最后一个参数
blit设置为True以优化结果。
FuncAnimation 的构造函数中还有很多其他的参数,你可以查看 FuncAnimation 的文档了解更多。
最后调用 FuncAnimation 对象的 save 方法保存动画。在这里,我们使用 gif 生成器 imagemagick 将 ani 保存到 gif 文件。在这里,我们将帧率 fps 设置为 60。
效果图如下,

还有另外一个例子,效果如下所示,源码参考这里 5

3D
参考这里 6‘ 2
柱状图
参考这里 7
准备数据,如下所示:
# fake data
_x = np.arange(4)
_y = np.arange(5)
_xx, _yy = np.meshgrid(_x, _y)
x, y = _xx.ravel(), _yy.ravel()

top = x + y
bottom = np.zeros_like(top)
width = depth = 1
基本
使用 ax.bar3d() 画出相应柱状图,
ax1.bar3d(x, y, bottom, width, depth, top, shade=True)
ax1.set_title('Shaded')

plt.savefig('3D-bar-example.png')
plt.show()
效果图如下所示,

线图
参考这里 8
动图
# Fixing random state for reproducibility
np.random.seed(19680801)


def random_walk(num_steps, max_step=0.05):
    """Return a 3D random walk as (num_steps, 3) array."""
    start_pos = np.random.random(3)
    steps = np.random.uniform(-max_step, max_step, size=(num_steps, 3))
    walk = start_pos + np.cumsum(steps, axis=0)
    return walk


def update_lines(num, walks, lines):
    for line, walk in zip(lines, walks):
        # NOTE: there is no .set_data() for 3 dim data...
        line.set_data(walk[:num, :2].T)
        line.set_3d_properties(walk[:num, 2])
    return lines


# Data: 40 random walks as (num_steps, 3) arrays
num_steps = 30
walks = [random_walk(num_steps) for index in range(40)]

# Attaching 3D axis to the figure
fig = plt.figure()
ax = fig.add_subplot(projection="3d")

# Create lines initially without data
lines = [ax.plot([], [], [])[0] for _ in walks]

# Setting the axes properties
ax.set(xlim3d=(0, 1), xlabel='X')
ax.set(ylim3d=(0, 1), ylabel='Y')
ax.set(zlim3d=(0, 1), zlabel='Z')

# Creating the Animation object
ani = animation.FuncAnimation(
    fig, update_lines, num_steps, fargs=(walks, lines), interval=100)

plt.show()
效果图如下,

参考链接
ImageMagick的基本使用 ↩︎
Beginners’ Guide to Animate Plots with matplotlib.animation ↩︎ ↩︎
Bar Chart Race in Python with Matplotlib ↩︎
示例数据集 ↩︎
一步一步教你用 Matplotlib 保存 GIF 动图 ↩︎
3D animation using matplotlib ↩︎
Demo of 3D bar charts ↩︎
Animated 3D random walk ↩︎


