一、完整代码
<!DOCTYPE html>
<html>
<head>
<meta charset="utf-8">
<title>Highlight features containing similar data</title>
<meta name="viewport" content="initial-scale=1,maximum-scale=1,user-scalable=no">
<link href="https://api.mapbox.com/mapbox-gl-js/v3.1.2/mapbox-gl.css" rel="stylesheet">
<script src="https://api.mapbox.com/mapbox-gl-js/v3.1.2/mapbox-gl.js"></script>
<style>
body { margin: 0; padding: 0; }
#map { position: absolute; top: 0; bottom: 0; width: 100%; }
</style>
</head>
<body>
<style>
    .map-overlay {
        font: 12px/20px 'Helvetica Neue', Arial, Helvetica, sans-serif;
        background-color: #fff;
        box-shadow: 0 1px 2px rgba(0, 0, 0, 0.1);
        border-radius: 3px;
        position: absolute;
        width: 25%;
        top: 10px;
        left: 10px;
        padding: 10px;
        display: none;
    }
</style>

<div id="map"></div>
<div id="map-overlay" class="map-overlay"></div>

<script>
	// TO MAKE THE MAP APPEAR YOU MUST
	// ADD YOUR ACCESS TOKEN FROM
	// https://account.mapbox.com
	mapboxgl.accessToken = 'YOUR_MAPBOX_ACCESS_TOKEN';
    const map = new mapboxgl.Map({
        container: 'map',
        // Choose from Mapbox's core styles, or make your own style with Mapbox Studio
        style: 'mapbox://styles/mapbox/streets-v12',
        center: [-98, 38.88],
        minZoom: 2,
        zoom: 3
    });

    const overlay = document.getElementById('map-overlay');

    // Create a popup, but don't add it to the map yet.
    const popup = new mapboxgl.Popup({
        closeButton: false
    });

    // Because features come from tiled vector data,
    // feature geometries may be split
    // or duplicated across tile boundaries.
    // As a result, features may appear
    // multiple times in query results.
    function getUniqueFeatures(features, comparatorProperty) {
        const uniqueIds = new Set();
        const uniqueFeatures = [];
        for (const feature of features) {
            const id = feature.properties[comparatorProperty];
            if (!uniqueIds.has(id)) {
                uniqueIds.add(id);
                uniqueFeatures.push(feature);
            }
        }
        return uniqueFeatures;
    }

    map.on('load', () => {
        // Add a custom vector tileset source. The tileset used in
        // this example contains a feature for every county in the U.S.
        // Each county contains four properties. For example:
        // {
        //     COUNTY: "Uintah County",
        //     FIPS: 49047,
        //     median-income: 62363,
        //     population: 34576
        // }
        map.addSource('counties', {
            'type': 'vector',
            'url': 'mapbox://mapbox.82pkq93d'
        });
        // Add transparent county polygons
        // for default display.
        map.addLayer(
            {
                'id': 'counties',
                'type': 'fill',
                'source': 'counties',
                'source-layer': 'original',
                'paint': {
                    'fill-outline-color': 'rgba(0,0,0,0.1)',
                    'fill-color': 'rgba(0,0,0,0.1)'
                }
            },
            // Place polygons under labels, roads and buildings.
            'building'
        );

        // Add filled county polygons
        // for highlighted display.
        map.addLayer(
            {
                'id': 'counties-highlighted',
                'type': 'fill',
                'source': 'counties',
                'source-layer': 'original',
                'paint': {
                    'fill-outline-color': '#484896',
                    'fill-color': '#6e599f',
                    'fill-opacity': 0.75
                },
                // Display none by adding a
                // filter with an empty string.
                'filter': ['in', 'COUNTY', '']
            },
            // Place polygons under labels, roads and buildings.
            'building'
        );

        map.on('mousemove', 'counties', (e) => {
            // Change the cursor style as a UI indicator.
            map.getCanvas().style.cursor = 'pointer';

            // Use the first found feature.
            const feature = e.features[0];

            // Query the counties layer visible in the map.
            // Only onscreen features are returned.
            // Use filter to collect only results
            // with the same county name.
            const relatedCounties = map.querySourceFeatures('counties', {
                sourceLayer: 'original',
                filter: ['in', 'COUNTY', feature.properties.COUNTY]
            });

            // Remove duplicates by checking for matching FIPS county ID.
            const uniqueCounties = getUniqueFeatures(relatedCounties, 'FIPS');

            // Total the populations of all features.
            const populationSum = uniqueCounties.reduce((memo, feature) => {
                return memo + feature.properties.population;
            }, 0);

            // Render found features in an overlay.
            const title = document.createElement('strong');
            title.textContent =
                feature.properties.COUNTY +
                ' (' +
                uniqueCounties.length +
                ' found)';

            const population = document.createElement('div');
            population.textContent =
                'Total population: ' + populationSum.toLocaleString();

            overlay.innerHTML = '';
            overlay.style.display = 'block';

            overlay.appendChild(title);
            overlay.appendChild(population);

            // Add features with the same county name
            // to the highlighted layer.
            map.setFilter('counties-highlighted', [
                'in',
                'COUNTY',
                feature.properties.COUNTY
            ]);

            // Display a popup with the name of the county.
            popup
                .setLngLat(e.lngLat)
                .setText(feature.properties.COUNTY)
                .addTo(map);
        });

        map.on('mouseleave', 'counties', () => {
            map.getCanvas().style.cursor = '';
            popup.remove();
            map.setFilter('counties-highlighted', ['in', 'COUNTY', '']);
            overlay.style.display = 'none';
        });
    });
</script>

</body>
</html>
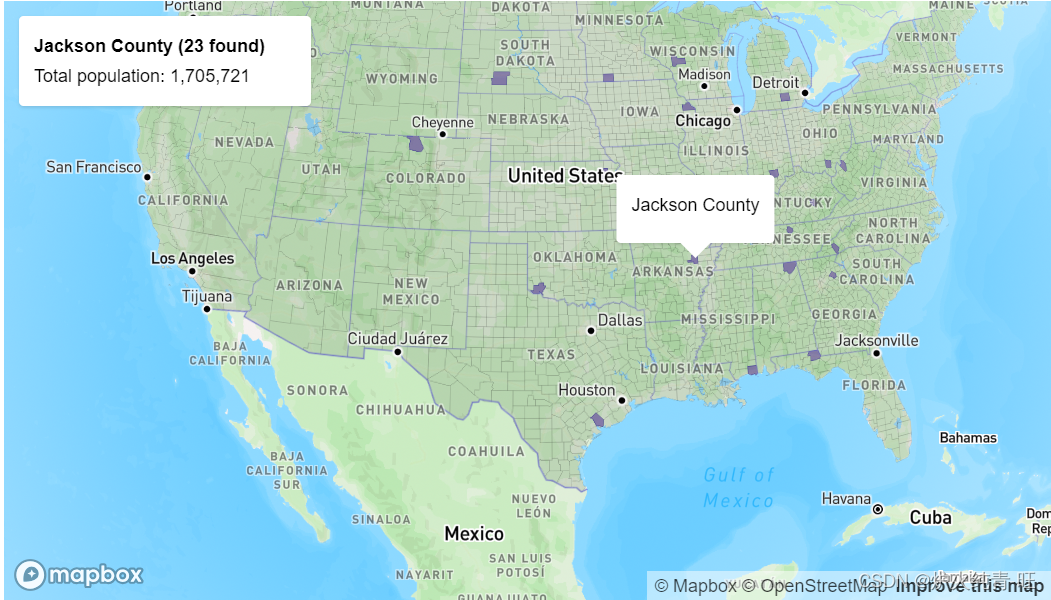
二、效果截图
三、 代码分析
-
添加矢量瓦片数据源
map.addSource('counties', {
    'type': 'vector',
    'url': 'mapbox://mapbox.82pkq93d'
});
-
添加矢量瓦片底图图层
// Add transparent county polygons
// for default display.
map.addLayer(
    {
        'id': 'counties',
        'type': 'fill',
        'source': 'counties',
        'source-layer': 'original',
        'paint': {
            'fill-outline-color': 'rgba(0,0,0,0.1)',
            'fill-color': 'rgba(0,0,0,0.1)'
        }
    },
    // Place polygons under labels, roads and buildings.
    'building'
);
-
添加矢量瓦片高亮图层
map.addLayer(
    {
        'id': 'counties-highlighted',
        'type': 'fill',
        'source': 'counties',
        'source-layer': 'original',
        'paint': {
            'fill-outline-color': '#484896',
        'fill-color': '#6e599f',
        'fill-opacity': 0.75
        },
        // Display none by adding a
        // filter with an empty string.
        'filter': ['in', 'COUNTY', '']
    },
    // Place polygons under labels, roads and buildings.
    'building'
);
-
底图图层添加鼠标移入事件
map.on('mousemove', 'counties', (e) => {

}
-
底图图层鼠标移出事件
map.on('mouseleave', 'counties', () => {

}
-
获取相关联要素数据信息
// 1 鼠标移入图层后修改鼠标手势
map.getCanvas().style.cursor = 'pointer';

// 2 获取鼠标移入第一个要素
const feature = e.features[0];

// 3 根据第一个要素的属性信息,根据图层获取与该属性相同的要素
const relatedCounties = map.querySourceFeatures('counties', {
    sourceLayer: 'original',
    filter: ['in', 'COUNTY', feature.properties.COUNTY]
});

// 4 对关联关联要素数据进行去重
const uniqueCounties = getUniqueFeatures(relatedCounties, 'FIPS');

function getUniqueFeatures(features, comparatorProperty) {
    const uniqueIds = new Set();
    const uniqueFeatures = [];
    for (const feature of features) {
        const id = feature.properties[comparatorProperty];
        if (!uniqueIds.has(id)) {
            uniqueIds.add(id);
            uniqueFeatures.push(feature);
        }
    }
    return uniqueFeatures;
}

// 5 获取去重后关联图层人口总和
const populationSum = uniqueCounties.reduce((memo, feature) => {
    return memo + feature.properties.population;
}, 0);

// 6 创建dom展示人口相关信息
const title = document.createElement('strong');
title.textContent =
    feature.properties.COUNTY +
    ' (' +
    uniqueCounties.length +
' found)';

const population = document.createElement('div');
population.textContent =
    'Total population: ' + populationSum.toLocaleString();

overlay.innerHTML = '';
overlay.style.display = 'block';

overlay.appendChild(title);
overlay.appendChild(population);

// 7 修改高亮图层过滤条件显示高亮要素
map.setFilter('counties-highlighted', [
    'in',
    'COUNTY',
    feature.properties.COUNTY
]);

// 8 根据过滤条件清空高亮要素
map.setFilter('counties-highlighted', ['in', 'COUNTY', '']);