echart 3d立体颜色渐变柱状图

news2025/1/23 12:05:45

如果可以实现记得点赞分享,谢谢老铁~

1.需求描述

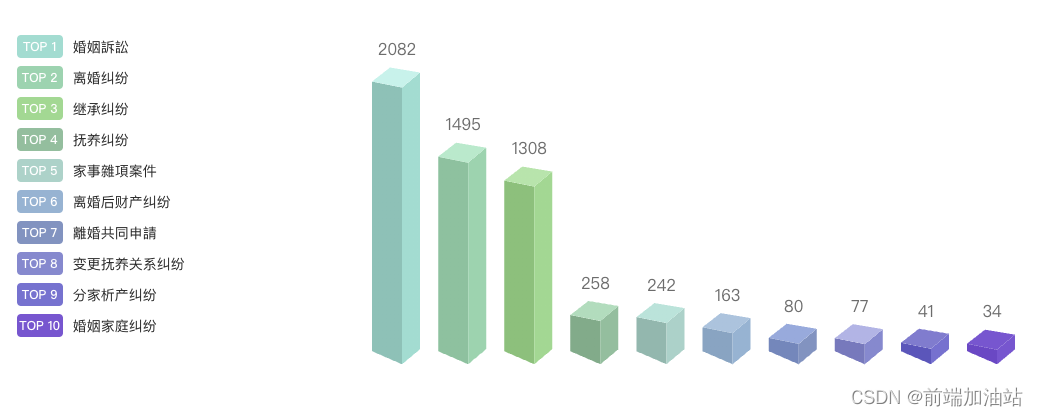
根据业务需求将不同的法律法规,展示不同的3d立体渐变柱状图。

2.先看下效果图
在这里插入图片描述

3. 确定三面的颜色,这里我是自定义的颜色

   // 右面生成颜色
    const rightColorArr = ref([
      "#79DED1",
       ...
    ]);
    // 左面生成颜色
    const leftColorArr = ref([
      "#67C3B7", 
      ...
    ]);
    // 顶部生成颜色
    const topColorArr = ref([
      "#ADF4EB",
      ...
    ]);

4.然后绘画三个面对应的函数,且注册

// 绘制左侧面
    const CubeLeft = echarts.graphic.extendShape({
    });
    // 绘制右侧面
    const CubeRight = echarts.graphic.extendShape({
    });
    // 绘制顶面
    const CubeTop = echarts.graphic.extendShape({
    });
    // 注册三个面图形
    echarts.graphic.registerShape("CubeLeft", CubeLeft);
    echarts.graphic.registerShape("CubeRight", CubeRight);
    echarts.graphic.registerShape("CubeTop", CubeTop);

5.重点在renderItem 自定义渲染函数上

 series: [
          {
            type: "custom",
            renderItem: (params, api) => {
              let cubeLeftStyle: any = "";
              let cubeRightStyle: any = "";
              let cubeTopStyle: any = "";
              cubeLeftStyle = new echarts.graphic.LinearGradient(0, 0, 0, 1, [
                {
                  offset: 0,
                  color: leftColorArr.value[params.dataIndex],
                },
                {
                  offset: 1,
                  color: leftColorArr.value[params.dataIndex],
                },
              ]);
              cubeRightStyle = new echarts.graphic.LinearGradient(0, 0, 0, 1, [
                {
                  offset: 0,
                  color: rightColorArr.value[params.dataIndex],
                },
                {
                  offset: 1,
                  color: rightColorArr.value[params.dataIndex],
                },
              ]);
              cubeTopStyle = new echarts.graphic.LinearGradient(0, 0, 0, 1, [
                {
                  offset: 0,
                  color: topColorArr.value[params.dataIndex],
                },
                {
                  offset: 1,
                  color: topColorArr.value[params.dataIndex],
                },
              ]);
              const location = api.coord([api.value(0), api.value(1)]);
              return {
                type: "group",
                children: [
                  {
                    type: "CubeLeft",
                    shape: {
                      api,
                      xValue: api.value(0),
                      yValue: api.value(1),
                      x: location[0],
                      y: location[1],
                      xAxisPoint: api.coord([api.value(0), -80]),
                    },
                    style: {
                      fill: cubeLeftStyle,
                    },
                  },
                  {
                    type: "CubeRight",
                    shape: {
                      api,
                      xValue: api.value(0),
                      yValue: api.value(1),
                      x: location[0],
                      y: location[1],
                      xAxisPoint: api.coord([api.value(0), -80]),
                    },
                    style: {
                      fill: cubeRightStyle,
                    },
                  },
                  {
                    type: "CubeTop",
                    shape: {
                      api,
                      xValue: api.value(0),
                      yValue: api.value(1),
                      x: location[0],
                      y: location[1],
                      xAxisPoint: api.coord([api.value(0), -50]),
                    },
                    style: {
                      fill: cubeTopStyle,
                    },
                  },
                ],
              };
            },
            data: valList.value,
          },
        ],

5.最后看全文吧,这个是vue3 的文件

<template>
  <div class="topCon">
    <div class="tagList left">
      <div class="item" v-for="(item, index) in nameList" :key="index">
        <a-tag :color="rightColorArr[index]" class="tag"
          >TOP {{ index + 1 }}</a-tag
        >
        <span>{{ item }}</span>
      </div>
    </div>
    <div class="right" id="AnalysisLegalTopBar" style="height: 400px"></div>
  </div>
</template>
<script lang="ts">
import { onMounted, toRefs, ref, watch } from "vue";
import * as echarts from "echarts";
type EChartsOption = echarts.EChartsOption;
export default {
  props: {
    data: Array,
  },
  setup(props) {
    const { data } = toRefs<any>(props);
    const myChart = ref<any>(null);
    let valList = ref<any>([]);
    let nameList = ref<any>([]);

    // 右面生成颜色
    const rightColorArr = ref([
      "#79DED1",
      "#75D5AF",
      "#7FD991",
      "#78BF9D",
      "#95D3C9",
      "#84B5D3",
      "#7794C1",
      "#828AD0",
      "#7573D1",
      "#8057D1",
    ]);
    // 左面生成颜色
    const leftColorArr = ref([
      "#67C3B7",
      "#68C39F",
      "#68C27A",
      "#65AD8A",
      "#7BB8AE",
      "#76A6C3",
      "#6789BC",
      "#737ABE",
      "#5A58BC",
      "#7349C6",
    ]);
    // 顶部生成颜色
    const topColorArr = ref([
      "#ADF4EB",
      "#9BEBCC",
      "#9DE6AB",
      "#98DEBD",
      "#A1E5DA",
      "#9DC5DE",
      "#8CACDD",
      "#B0B5E6",
      "#7F7DD0",
      "#8057D1",
    ]);

    // 绘制左侧面
    const CubeLeft = echarts.graphic.extendShape({
      shape: {
        x: 0,
        y: 0,
      },
      buildPath: function (ctx: any, shape) {
        // 会canvas的应该都能看得懂,shape是从custom传入的
        const xAxisPoint = shape.xAxisPoint;
        const c0 = [shape.x + 7, shape.y];
        const c1 = [shape.x - 23, shape.y - 6];
        const c2 = [xAxisPoint[0] - 23, xAxisPoint[1] - 13];
        const c3 = [xAxisPoint[0] + 7, xAxisPoint[1]];
        ctx
          .moveTo(c0[0], c0[1])
          .lineTo(c1[0], c1[1])
          .lineTo(c2[0], c2[1])
          .lineTo(c3[0], c3[1])
          .closePath();
      },
    });
    // 绘制右侧面
    const CubeRight = echarts.graphic.extendShape({
      shape: {
        x: 0,
        y: 0,
      },
      buildPath: function (ctx: any, shape) {
        const xAxisPoint = shape.xAxisPoint;
        const c1 = [shape.x + 7, shape.y];
        const c2 = [xAxisPoint[0] + 7, xAxisPoint[1]];
        const c3 = [xAxisPoint[0] + 25, xAxisPoint[1] - 15];
        const c4 = [shape.x + 25, shape.y - 15];
        ctx
          .moveTo(c1[0], c1[1])
          .lineTo(c2[0], c2[1])
          .lineTo(c3[0], c3[1])
          .lineTo(c4[0], c4[1])
          .closePath();
      },
    });
    // 绘制顶面
    const CubeTop = echarts.graphic.extendShape({
      shape: {
        x: 0,
        y: 0,
      },
      buildPath: function (ctx: any, shape) {
        const c1 = [shape.x + 7, shape.y];
        const c2 = [shape.x + 25, shape.y - 15]; //右点
        const c3 = [shape.x - 5, shape.y - 20];
        const c4 = [shape.x - 23, shape.y - 6];
        ctx
          .moveTo(c1[0], c1[1])
          .lineTo(c2[0], c2[1])
          .lineTo(c3[0], c3[1])
          .lineTo(c4[0], c4[1])
          .closePath();
      },
    });
    // 注册三个面图形
    echarts.graphic.registerShape("CubeLeft", CubeLeft);
    echarts.graphic.registerShape("CubeRight", CubeRight);
    echarts.graphic.registerShape("CubeTop", CubeTop);

    const getOption = () => {
      return {
        backgroundColor: "transparent",
        title: {
          // text: "单位:个",
          textStyle: {
            color: "#79DED1",
            fontWeight: "800",
            fontSize: 16,
          },
          left: "18px",
          top: "1%",
        },
        tooltip: {
          trigger: "axis",
          axisPointer: {
            type: "shadow",
          },
          formatter: function (params, ticket, callback) {
            const item = params[1];
            return item.name + " : " + item.value;
          },
        },
        grid: {
          top: "12%",
          bottom: "3%",
          left: "left",
          containLabel: true,
        },
        xAxis: {
          type: "category",
          show: false,
          data: nameList.value,
          axisLine: {
            show: true,
            lineStyle: {
              color: "#7ebaf2",
            },
          },
          axisTick: {
            show: false,
            length: 9,
            alignWithLabel: true,
            lineStyle: {
              color: "#7DFFFD",
            },
          },
          axisLabel: {
            fontSize: 12,
          },
        },
        yAxis: {
          type: "value",
          show: false,
          min: 0,
          axisLine: {
            show: true,
            lineStyle: {
              color: "#7ebaf2",
            },
          },
          splitLine: {
            show: false,
          },
          splitArea: {
            show: true,
            areaStyle: {
              color: ["rgba(26,50,83,1)", "rgba(30,57,92,1)"],
            },
          },
          axisTick: {
            show: false,
          },
          axisLabel: {
            fontSize: 12,
          },
          boundaryGap: ["20%", "20%"],
        },
        series: [
          {
            type: "custom",
            renderItem: (params, api) => {
              let cubeLeftStyle: any = "";
              let cubeRightStyle: any = "";
              let cubeTopStyle: any = "";
              cubeLeftStyle = new echarts.graphic.LinearGradient(0, 0, 0, 1, [
                {
                  offset: 0,
                  color: leftColorArr.value[params.dataIndex],
                },
                {
                  offset: 1,
                  color: leftColorArr.value[params.dataIndex],
                },
              ]);
              cubeRightStyle = new echarts.graphic.LinearGradient(0, 0, 0, 1, [
                {
                  offset: 0,
                  color: rightColorArr.value[params.dataIndex],
                },
                {
                  offset: 1,
                  color: rightColorArr.value[params.dataIndex],
                },
              ]);
              cubeTopStyle = new echarts.graphic.LinearGradient(0, 0, 0, 1, [
                {
                  offset: 0,
                  color: topColorArr.value[params.dataIndex],
                },
                {
                  offset: 1,
                  color: topColorArr.value[params.dataIndex],
                },
              ]);
              const location = api.coord([api.value(0), api.value(1)]);
              return {
                type: "group",
                children: [
                  {
                    type: "CubeLeft",
                    shape: {
                      api,
                      xValue: api.value(0),
                      yValue: api.value(1),
                      x: location[0],
                      y: location[1],
                      xAxisPoint: api.coord([api.value(0), -80]),
                    },
                    style: {
                      fill: cubeLeftStyle,
                    },
                  },
                  {
                    type: "CubeRight",
                    shape: {
                      api,
                      xValue: api.value(0),
                      yValue: api.value(1),
                      x: location[0],
                      y: location[1],
                      xAxisPoint: api.coord([api.value(0), -80]),
                    },
                    style: {
                      fill: cubeRightStyle,
                    },
                  },
                  {
                    type: "CubeTop",
                    shape: {
                      api,
                      xValue: api.value(0),
                      yValue: api.value(1),
                      x: location[0],
                      y: location[1],
                      xAxisPoint: api.coord([api.value(0), -50]),
                    },
                    style: {
                      fill: cubeTopStyle,
                    },
                  },
                ],
              };
            },
            data: valList.value,
          },
          {
            type: "bar",
            label: {
              normal: {
                show: true,
                position: "top",
                fontSize: 16,
                color: "#6C6C6C",
                offset: [2, -25],
              },
            },
            itemStyle: {
              color: "transparent",
            },
            tooltip: {},
            data: valList.value,
          },
        ],
      };
    };

    watch(
      () => data.value,
      (list) => {
        let option_bar: any = getOption();
        list.forEach((item, index) => {
          nameList.value.push(item.name);
          valList.value.push(item.value);
        });
        option_bar && myChart.value.setOption(option_bar);
      }
    );
    onMounted(() => {
      // 基于准备好的dom,初始化echarts实例
      var chartDom: any = document.getElementById("AnalysisLegalTopBar");
      myChart.value = echarts.init(chartDom);

      window.addEventListener("resize", () => {
        myChart.value.resize();
      });
    });

    return {
      nameList,
      rightColorArr,
    };
  },
};
</script>
<style lang="less" scoped>
.topCon {
  display: flex;
  justify-content: center;
  align-items: center;
  .left {
    width: 30%;
    .item {
      display: flex;
      align-items: center;
    }
  }
  .right {
    width: 70%;
  }
  .tagList {
    .tag {
      width: 46px;
      height: 23px;
      border-radius: 4px;
      font-size: 10px;
      font-weight: 500;
      line-height: 20px;
      margin: 4px 0px;
      margin-right: 10px;
      color: #fff;
      background: rgba(121, 222, 209, 0.39);
      display: flex;
      justify-content: center;
      align-items: center;
    }
  }
}
</style>

收工!谢谢老铁们的点赞收藏~

本文来自互联网用户投稿,该文观点仅代表作者本人,不代表本站立场。本站仅提供信息存储空间服务,不拥有所有权,不承担相关法律责任。如若转载,请注明出处:http://www.coloradmin.cn/o/883287.html

如若内容造成侵权/违法违规/事实不符,请联系多彩编程网进行投诉反馈,一经查实,立即删除!

相关文章

【图像融合】融合算法综述(持续更新)

按时间顺序&#xff0c;综述近5年的融合算法。重点分析了最近两年的work&#xff0c;欢迎留言探讨 文章目录 前言1.SSR-Laplacian Image Fusion&#xff08;2017&#xff09;2、FusionGAN&#xff08;2019&#xff09;3、MBNet&#xff08;2020&#xff09;4、DIDFuse&#xff…

【闪击Linux系列P10】操作系统管理的算珠——进程の详解

​ 前言 大家好吖&#xff0c;欢迎来到 YY 滴 Linux系列 &#xff0c;热烈欢迎&#xff01; 本章主要内容面向接触过Linux的老铁&#xff0c;从操作系统层面向大家介绍进程&#xff1a; 主要内容含&#xff1a; 欢迎订阅 YY滴Linux专栏&#xff01;更多干货持续更新&#xff0…

AIGC绘画:基于Stable Diffusion进行AI绘图

文章目录 AIGC深度学习模型绘画系统stable diffusion简介stable diffusion应用现状在线网站云端部署本地部署Stable Diffusion AIGC深度学习模型绘画系统 stable diffusion简介 Stable Diffusion是2022年发布的深度学习文本到图像生成模型&#xff0c;它主要用于根据文本的描述…

MySQL — 索引

文章目录 索引索引结构 — B树与B树B树B树 聚簇索引与非聚簇索引聚簇索引非聚簇索引优缺点 覆盖索引与回表联合索引索引覆盖最左前缀匹配 索引 索引是对数据库表中一列或多列的值进行排序的一种结构。MySQL索引的建立对于MySQL的高效运行是很重要的&#xff0c;索引可以大大提…

图像去雨-雨线清除-图像处理-(计算机作业附代码)

背景 多年来&#xff0c;图像去雨已经被广泛研究&#xff0c;使用传统方法和基于学习的方法。然而&#xff0c;传统方法如高斯混合模型和字典学习方法耗时&#xff0c;并且无法很好地处理受到严重雨滴影响的图像块。 算法 通过考虑雨滴条状特性和角度分布&#xff0c;这个问…

2023+HuggingGPT: Solving AI Tasks with ChatGPT and itsFriends in Hugging Face

摘要&#xff1a; 语言是llm(例如ChatGPT)连接众多AI模型(例如hugs Face)的接口&#xff0c;用于解决复杂的AI任务。在这个概念中&#xff0c;llms作为一个控制器&#xff0c;管理和组织专家模型的合作。LLM首先根据用户请求规划任务列表&#xff0c;然后为每个任务分配专家模…

3D- vista:预训练的3D视觉和文本对齐Transformer

论文&#xff1a;https://arxiv.org/abs/2308.04352 代码: GitHub - 3d-vista/3D-VisTA: Official implementation of ICCV 2023 paper "3D-VisTA: Pre-trained Transformer for 3D Vision and Text Alignment" 摘要 三维视觉语言基础(3D- vl)是一个新兴领域&…

JDBC封装与设计模式

什么是 DAO &#xff1f; Data Access Object(数据存取对象) 位于业务逻辑和持久化数据之间实现对持久化数据的访问 DAO起着转换器的作用&#xff0c;将数据在实体类和数据库记录之间进行转换。 ----------------------------------------------------- DAO模式的组成部分 …

【动画】p60动画蓝图、播放蒙太奇、打包

p60动画蓝图、播放蒙太奇、打包 p60动画蓝图、播放蒙太奇、打包添加动画动画蓝图使模型使用动画蓝图奔跑跳舞蒙太奇 移动打断蒙太奇打包退出游戏 p60动画蓝图、播放蒙太奇、打包 添加动画 右键内容浏览器-》动画-》混合空间1D-》选择新的角色的骨骼 如下图在资产详情修改参数…

【TypeScript】基础类型

安装 Node.js 环境 https://nodejs.org/en 终端中可以查到版本号即安装成功。 然后&#xff0c;终端执行npm i typescript -g安装 TypeScript 。 查到版本号即安装成功。 字符串类型 let str:string "Hello"; console.log(str);终端中先执行tsc --init&#xf…

机器学习:特征工程之特征预处理

目录 特征预处理 1、简述 2、内容 3、归一化 3.1、鲁棒性 3.2、存在的问题 4、标准化 ⭐所属专栏&#xff1a;人工智能 文中提到的代码如有需要可以私信我发给你&#x1f60a; 特征预处理 1、简述 什么是特征预处理&#xff1a;scikit-learn的解释&#xff1a; provide…

预训练GNN:GPT-GNN Generative Pre-Training of Graph Neural Networks

一.文章概述 本文提出了一种自监督属性图生成任务来预训练GNN&#xff0c;使得其能捕图的结构和语义属性。作者将图的生成分为两个部分&#xff1a;属性生成和边生成&#xff0c;即给定观测到的边&#xff0c;生成节点属性&#xff1b;给定观测到的边和生成的节点属性&#xf…

【第三阶段】kotlin中使用带let的安全调用

let常常和&#xff1f;.配合使用&#xff0c;如果前面的对象为null,let不执行&#xff0c;能够执行到let里面 对象一定不为null 1.不为null fun main() {var name:String?"kotlin" //name是一个可空类型&#xff0c;发出广播&#xff0c;调用的地方必须补救措施var…

WSL2 Ubuntu子系统安装cuda+cudnn+torch

文章目录 前言一、安装cudncudnn安装pytorch 前言 确保Windows系统版本高于windows10 21H2或Windows11&#xff0c;然后在Windows中将显卡驱动升级到最新即可&#xff0c;WSL2已支持对显卡的直接调用。 一、安装cudncudnn 配置cuda环境&#xff0c;WSL下的Ubuntu子系统的cu…

炬芯科技低延迟高音质无线麦克风解决方案

随着互联网技术的高速发展&#xff0c;诸多新兴产业被带动起来。就近十年来看&#xff0c;内容平台以及其载体在不断演变&#xff0c;从自媒体到短视频以及直播&#xff0c;一点一滴地渗透进大众生活。而这些平台的兴起&#xff0c;亦为普罗大众提供了广阔的分享空间&#xff0…

六十四卦-整体

前言&#xff1a;整理一下学习的卦&#xff0c;从整体上更好地了解六十四卦。 目录 八纯卦 难卦 消息卦 最吉的卦 六爻皆正位的卦 六爻皆不正位的卦 爻辞中含有“利涉大川”的卦 八纯卦 乾三连&#xff0c;坤六断&#xff0c;震仰盂&#xff0c;艮覆碗&#xff0c;离…

【免费分享 图书】《阿里云天池大赛赛题解析——机器学习篇》-PDF电子书-百度云...

找这本书的资源简直要把我找吐了&#xff0c;各种网站压缩包一下下来就开始各种套路(比如要你充钱) 为了防止还有我这样的受害者&#xff0c;这就把找到的PDF给大家分享一下。 链接在文章最后 如果这篇文章能够帮到您&#xff0c;麻烦帮我点个赞&#xff0c;并关注一下我&…

【uniapp】中 微信小程序实现echarts图表组件的封装

插件地址&#xff1a;echarts-for-uniapp - DCloud 插件市场 图例&#xff1a; 一、uniapp 安装 npm i uniapp-echarts --save 二、文件夹操作 将 node_modules 下的 uniapp-echarts 文件夹复制到 components 文件夹下 当前不操作此步骤的话&#xff0c;运行 -> 运行到小…

动手学深度学习—卷积神经网络LeNet(代码详解)

1. LeNet LeNet由两个部分组成&#xff1a; 卷积编码器&#xff1a;由两个卷积层组成&#xff1b;全连接层密集块&#xff1a;由三个全连接层组成。 每个卷积块中的基本单元是一个卷积层、一个sigmoid激活函数和平均汇聚层&#xff1b;每个卷积层使用55卷积核和一个sigmoid激…

基于libevent的tcp服务器

libevent使用教程_evutil_make_socket_nonblocking_易方达蓝筹的博客-CSDN博客 一、准备 centos7下安装libevent库 yum install libevent yum install -y libevent-devel 二、代码 server.cpp /** You need libevent2 to compile this piece of code Please see: http://li…