【Sklearn】基于朴素贝叶斯算法的数据分类预测(Excel可直接替换数据)
- 1.模型原理
- 2.模型参数
- 3.文件结构
- 4.Excel数据
- 5.下载地址
- 6.完整代码
- 7.运行结果
1.模型原理
模型原理:
朴素贝叶斯分类是基于贝叶斯定理的一种分类方法。它假设特征之间相互独立(朴素性),从而简化计算过程。朴素贝叶斯分类器适用于文本分类、垃圾邮件过滤、情感分析等多种应用场景。
贝叶斯定理:
在朴素贝叶斯分类中,我们使用贝叶斯定理来计算后验概率。对于一个待分类的数据点,假设其特征向量为 x \mathbf{x} x,类别为 y y y,贝叶斯定理表示为:
P ( y ∣ x ) = P ( x ∣ y ) ⋅ P ( y ) P ( x ) P(y|\mathbf{x}) = \frac{P(\mathbf{x}|y) \cdot P(y)}{P(\mathbf{x})} P(y∣x)=P(x)P(x∣y)⋅P(y)
其中,
- P ( y ∣ x ) P(y|\mathbf{x}) P(y∣x):给定特征 x \mathbf{x} x 的情况下,类别 y y y 的后验概率。
- P ( x ∣ y ) P(\mathbf{x}|y) P(x∣y):在类别 y y y 下,特征 x \mathbf{x} x 的条件概率。
- P ( y ) P(y) P(y):类别 y y y 的先验概率。
- P ( x ) P(\mathbf{x}) P(x):特征 x \mathbf{x} x 的边缘概率。
朴素性假设:
朴素贝叶斯分类器假设特征之间相互独立,即给定类别的情况下,特征之间没有关联。这个假设大大简化了计算过程,尽管在实际情况中很少有特征完全独立的情况。尽管如此,朴素贝叶斯分类器在实际应用中表现良好。
数学模型:
在朴素贝叶斯分类中,我们需要计算条件概率,主要有两种类型:离散型特征和连续型特征。
离散型特征:
对于离散型特征,我们可以计算每个特征值在给定类别下的条件概率:
P ( x i ∣ y ) = Count ( x i , y ) + 1 Count ( y ) + ∣ X i ∣ P(x_i|y) = \frac{{\text{Count}(x_i, y) + 1}}{{\text{Count}(y) + |X_i|}} P(xi∣y)=Count(y)+∣Xi∣Count(xi,y)+1
其中,
- Count ( x i , y ) \text{Count}(x_i, y) Count(xi,y):在类别 y y y 下,特征 x i x_i xi 出现的次数。
- Count ( y ) \text{Count}(y) Count(y):类别 y y y 的样本总数。
- ∣ X i ∣ |X_i| ∣Xi∣:特征 x i x_i xi 可能的取值数量。
连续型特征:
对于连续型特征,我们通常假设特征的分布是高斯分布(正态分布),然后计算每个特征在给定类别下的均值和方差,然后使用高斯分布的概率密度函数计算条件概率:
P ( x i ∣ y ) = 1 2 π ⋅ σ y ⋅ exp ( − ( x i − μ y ) 2 2 σ y 2 ) P(x_i|y) = \frac{1}{{\sqrt{2 \pi} \cdot \sigma_y}} \cdot \exp\left(-\frac{(x_i - \mu_y)^2}{2 \sigma_y^2}\right) P(xi∣y)=2π⋅σy1⋅exp(−2σy2(xi−μy)2)
其中,
- μ y \mu_y μy:在类别 y y y 下,特征 x i x_i xi 的均值。
- σ y \sigma_y σy:在类别 y y y 下,特征 x i x_i xi 的标准差。
朴素贝叶斯分类器通过计算每个类别的后验概率来进行分类决策,选择具有最大后验概率的类别作为预测结果。虽然朴素贝叶斯分类器假设特征之间相互独立,在实际应用中仍然表现良好,并且具有较快的训练和预测速度。
2.模型参数
GaussianNB类是朴素贝叶斯分类器的一种实现,用于处理连续型特征。以下是GaussianNB类的主要参数列表:
-
priors: 先验概率,可以为None(默认)或array-like。如果为None,使用数据中的样本数来估计先验概率;如果为array-like,则指定每个类别的先验概率。
-
var_smoothing: 方差平滑项,一个非负数。默认为1e-9。用于稳定计算,避免概率为零的情况。
3.文件结构

iris.xlsx						% 可替换数据集
Main.py							% 主函数
4.Excel数据

5.下载地址
- 资源下载地址
6.完整代码
import pandas as pd
from sklearn.model_selection import train_test_split
from sklearn.naive_bayes import GaussianNB
from sklearn.metrics import accuracy_score, confusion_matrix
import matplotlib.pyplot as plt
import seaborn as sns

def naive_bayes_classification(data_path, test_size=0.2, random_state=42):
    # 加载数据
    data = pd.read_excel(data_path)

    # 分割特征和标签
    X = data.iloc[:, :-1]  # 所有列除了最后一列
    y = data.iloc[:, -1]   # 最后一列

    # 划分训练集和测试集
    X_train, X_test, y_train, y_test = train_test_split(X, y, test_size=test_size, random_state=random_state)

    # 创建朴素贝叶斯分类器
    # 1. ** priors: ** 先验概率,可以为None(默认)或array - like。如果为None,使用数据中的样本数来估计先验概率;如果为array - like,则指定每个类别的先验概率。
    # 2. ** var_smoothing: ** 方差平滑项,一个非负数。默认为1e - 9。用于稳定计算,避免概率为零的情况。
    # 在你提供的示例中,`model = GaussianNB(priors=[0.2, 0.3, 0.5], var_smoothing=1e-8)`
    # 意味着你在创建朴素贝叶斯分类器时,显式地指定了三个类别的先验概率为0.2、0.3和0.5,
    # 并设置了方差平滑项为`1e-8`,以确保概率计算的稳定性。
    model = GaussianNB(priors=[0.2, 0.3, 0.5], var_smoothing=1e-8)

    # 在训练集上训练模型
    model.fit(X_train, y_train)

    # 在测试集上进行预测
    y_pred = model.predict(X_test)

    # 计算准确率
    accuracy = accuracy_score(y_test, y_pred)
    return confusion_matrix(y_test, y_pred), y_test.values, y_pred, accuracy

if __name__ == "__main__":
    # 使用函数进行分类任务
    data_path = "iris.xlsx"
    confusion_mat, true_labels, predicted_labels, accuracy = naive_bayes_classification(data_path)

    print("真实值:", true_labels)
    print("预测值:", predicted_labels)
    print("准确率:{:.2%}".format(accuracy))

    # 绘制混淆矩阵
    plt.figure(figsize=(8, 6))
    sns.heatmap(confusion_mat, annot=True, fmt="d", cmap="Blues")
    plt.title("Confusion Matrix")
    plt.xlabel("Predicted Labels")
    plt.ylabel("True Labels")
    plt.show()

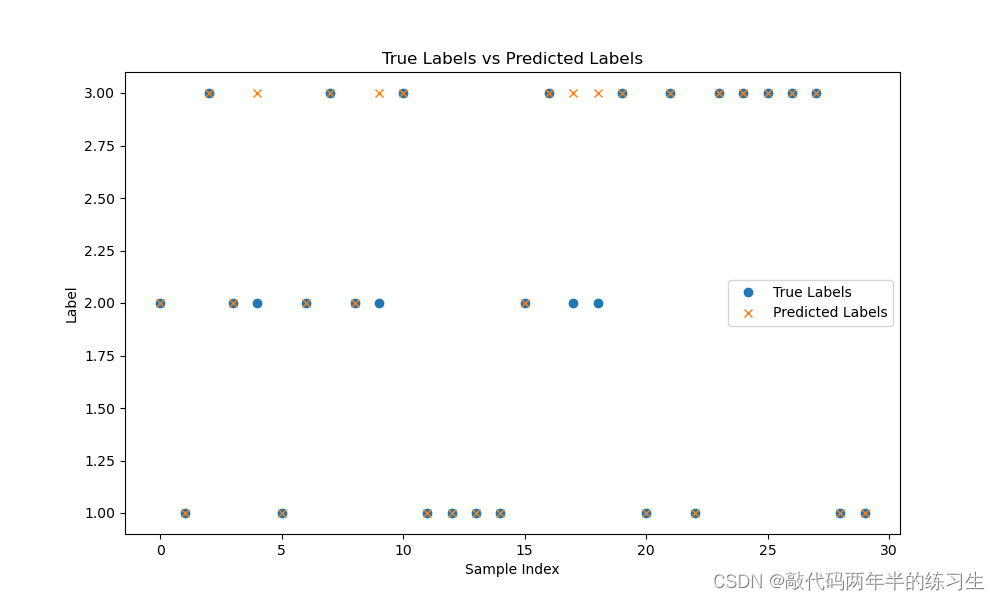
    # 用圆圈表示真实值,用叉叉表示预测值
    # 绘制真实值与预测值的对比结果
    plt.figure(figsize=(10, 6))
    plt.plot(true_labels, 'o', label="True Labels")
    plt.plot(predicted_labels, 'x', label="Predicted Labels")

    plt.title("True Labels vs Predicted Labels")
    plt.xlabel("Sample Index")
    plt.ylabel("Label")
    plt.legend()
    plt.show()
7.运行结果


