python森林生物量(蓄积量)估算全流程
- 一.哨兵2号获取/处理/提取数据
- 1.1 影像处理与下载
- 采用云概率影像去云
- 采用6S模型对1C级产品进行大气校正
- geemap下载数据到本地
- NDVI
- 1.2 各种参数计算(生物物理变量、植被指数等)
- LAI:叶面积指数
- FAPAR:吸收的光合有效辐射的分数
- FVC:植被覆盖率
- GEE计算植被指数
- 采用gdal计算各类植被指数
- 1.3 纹理特征参数提取
- 二.哨兵1号获取/处理/提取数据
- 2.1 纹理特征参数提取
- 三、DEM数据
- 3.1 数据下载
- 3.2 数据处理
- 四、样本生物量计算
- 五、样本变量选取
- 六、随机森林建模
- 6.1导入库与变量准备
- 6.2 选取参数
- 6.3 误差分布直方图
- 6.4 变量重要性可视化展示
- 6.5 对精度进行验证
- 6.6 预测生物量
- 七、生物量制图
- 7.1. 将得到的biomass.tif文件按掩膜提取
- 7.2. 提取森林掩膜区域
- 八. 需要注意的点
一.哨兵2号获取/处理/提取数据
1.1 影像处理与下载
这里采用哨兵12号影像估算森林生物量
在GEE上处理和下载2017年的S2L1C级产品,因为S2L2A级产品(经过大气校正)量少,没有2017年的可用产品。
这里需要对S2L1C产品进行大气较正,采用6S模型,运行这个库需要安装。
可以看这篇文章完成
#导入必要的库文件
import ee
from Py6S import *
import datetime
import math
import os
import sys
sys.path.append(os.path.join(os.path.dirname(os.getcwd()),'bin'))
from atmospheric import Atmospheric
ee.Initialize()
import geemap
wanzhou = geemap.geojson_to_ee("./input/wanzhou.json")
roi = wanzhou.geometry().bounds()
geom = wanzhou.geometry().bounds()
采用云概率影像去云
s2 = ee.ImageCollection("COPERNICUS/S2_HARMONIZED")
s2_cloud = ee.ImageCollection("COPERNICUS/S2_CLOUD_PROBABILITY")
point = roi

def rmCloudByProbability(image, thread):
    prob = image.select("probability")
    return image.updateMask(prob.lte(thread))

def scaleImage(image):
    time_start = image.get("system:time_start")
    image = image.divide(10000)
    image = image.set("system:time_start", time_start)
    return image

def getMergeImages(primary, secondary):
    join = ee.Join.inner()
    filter = ee.Filter.equals(leftField='system:index', rightField='system:index')
    joinCol = join.apply(primary, secondary, filter)
    joinCol = joinCol.map(lambda image: ee.Image(image.get("primary")).addBands(ee.Image(image.get("secondary"))))
    return ee.ImageCollection(joinCol)

startDate = "2016-06-01"
endDate = "2016-10-31"
ee.Date(startDate)
ee.Date(endDate)
s2_raw = s2.filterDate(startDate, endDate).filterBounds(point)
s2Imgs1 = s2.filterDate(startDate, endDate).filterBounds(point).map(scaleImage)
s2Imgs2 = s2_cloud.filterDate(startDate, endDate).filterBounds(point)
s2Imgs = getMergeImages(s2Imgs1, s2Imgs2)
s2Imgs = s2Imgs.map(lambda image: rmCloudByProbability(image,40))
s2Img = s2Imgs.median()


composite = s2Img.clip(point).toFloat()
rgbVis = {
 'min': 0.0,
 'max': 0.3,
 'bands': ['B4', 'B3', 'B2'],
}
styling = {

   'color': 'red',
   'fillColor': '00000000'
}
#随后创建一个 Map 实例,将栅格和矢量添加到图层中。
Map = geemap.Map()
Map.addLayer(composite,rgbVis, "S2_2A_wanzhou")
Map.addLayer(wanzhou.style(**styling), {}, '万州边界')
Map.centerObject(wanzhou, 9)
Map
toa = composite
采用6S模型对1C级产品进行大气校正
date = ee.Date('2016-07-01')

geom = ee.Geometry.Point(107.7632, 30.8239)
S2 = ee.Image(
  ee.ImageCollection('COPERNICUS/S2')
    .filterBounds(geom)
    .filterDate(date,date.advance(3,'month'))
    .sort('system:time_start')
    .first()
  )
info = S2.getInfo()['properties']
scene_date = datetime.datetime.utcfromtimestamp(info['system:time_start']/1000)# i.e. Python uses seconds, EE uses milliseconds
solar_z = info['MEAN_SOLAR_ZENITH_ANGLE']
date = ee.Date('2016-07-01')

h2o = Atmospheric.water(geom,date).getInfo()
o3 = Atmospheric.ozone(geom,date).getInfo()
aot = Atmospheric.aerosol(geom,date).getInfo()

SRTM = ee.Image('CGIAR/SRTM90_V4')# Shuttle Radar Topography mission covers *most* of the Earth
alt = SRTM.reduceRegion(reducer = ee.Reducer.mean(),geometry = geom.centroid()).get('elevation').getInfo()
km = alt/1000 # i.e. Py6S uses units of kilometers


# Instantiate
s = SixS()

# Atmospheric constituents
s.atmos_profile = AtmosProfile.UserWaterAndOzone(h2o,o3)
s.aero_profile = AeroProfile.Continental
s.aot550 = aot

# Earth-Sun-satellite geometry
s.geometry = Geometry.User()
s.geometry.view_z = 0               # always NADIR (I think..)
s.geometry.solar_z = solar_z        # solar zenith angle
s.geometry.month = scene_date.month # month and day used for Earth-Sun distance
s.geometry.day = scene_date.day     # month and day used for Earth-Sun distance
s.altitudes.set_sensor_satellite_level()
s.altitudes.set_target_custom_altitude(km)


def spectralResponseFunction(bandname):
    """
    Extract spectral response function for given band name
    """
    bandSelect = {
        'B1':PredefinedWavelengths.S2A_MSI_01,
        'B2':PredefinedWavelengths.S2A_MSI_02,
        'B3':PredefinedWavelengths.S2A_MSI_03,
        'B4':PredefinedWavelengths.S2A_MSI_04,
        'B5':PredefinedWavelengths.S2A_MSI_05,
        'B6':PredefinedWavelengths.S2A_MSI_06,
        'B7':PredefinedWavelengths.S2A_MSI_07,
        'B8':PredefinedWavelengths.S2A_MSI_08,
        'B8A':PredefinedWavelengths.S2A_MSI_8A,
        'B9':PredefinedWavelengths.S2A_MSI_09,
        'B10':PredefinedWavelengths.S2A_MSI_10,
        'B11':PredefinedWavelengths.S2A_MSI_11,
        'B12':PredefinedWavelengths.S2A_MSI_12,
        }
    return Wavelength(bandSelect[bandname])


def toa_to_rad(bandname):
    """
    Converts top of atmosphere reflectance to at-sensor radiance
    """

    # solar exoatmospheric spectral irradiance
    ESUN = info['SOLAR_IRRADIANCE_'+bandname]
    solar_angle_correction = math.cos(math.radians(solar_z))

    # Earth-Sun distance (from day of year)
    doy = scene_date.timetuple().tm_yday
    d = 1 - 0.01672 * math.cos(0.9856 * (doy-4))# http://physics.stackexchange.com/questions/177949/earth-sun-distance-on-a-given-day-of-the-year

    # conversion factor
    multiplier = ESUN*solar_angle_correction/(math.pi*d**2)

    # at-sensor radiance
    rad = toa.select(bandname).multiply(multiplier)

    return rad


def surface_reflectance(bandname):
    """
    Calculate surface reflectance from at-sensor radiance given waveband name
    """

    # run 6S for this waveband
    s.wavelength = spectralResponseFunction(bandname)
    s.run()

    # extract 6S outputs
    Edir = s.outputs.direct_solar_irradiance             #direct solar irradiance
    Edif = s.outputs.diffuse_solar_irradiance            #diffuse solar irradiance
    Lp   = s.outputs.atmospheric_intrinsic_radiance      #path radiance
    absorb  = s.outputs.trans['global_gas'].upward       #absorption transmissivity
    scatter = s.outputs.trans['total_scattering'].upward #scattering transmissivity
    tau2 = absorb*scatter                                #total transmissivity

    # radiance to surface reflectance
    rad = toa_to_rad(bandname)
    ref = rad.subtract(Lp).multiply(math.pi).divide(tau2*(Edir+Edif))

    return ref


# # surface reflectance rgb
# b = surface_reflectance('B2')
# g = surface_reflectance('B3')
# r = surface_reflectance('B4')
# ref = r.addBands(g).addBands(b)

# all wavebands
output = S2.select('QA60')
for band in ['B1','B2','B3','B4','B5','B6','B7','B8','B8A','B9','B10','B11','B12']:
#     print(band)
    output = output.addBands(surface_reflectance(band))
#随后创建一个 Map 实例,将栅格和矢量添加到图层中。
Map = geemap.Map()
Map.addLayer(output, rgbVis, '万州')
Map.addLayer(wanzhou.style(**styling), {}, '万州边界')
Map.centerObject(wanzhou, 9)
Map
geemap下载数据到本地
这里需要安装geemap库,具体可以参考这篇文章
#定义下载函数
def download(image):
    band_name = image.bandNames().getInfo()
    band_name_str = str(band_name).replace('[', '').replace(']', '').replace("'", '')
    work_dir = os.path.join(os.path.expanduser("E:\jupyter\geeDownloads"), 'tif')
    if not os.path.exists(work_dir):
       os.makedirs(work_dir)
    out_tif = os.path.join(work_dir, str(band_name_str)+"_S2_2016_wanzhou.tif")

    geemap.download_ee_image(
       image=image,
       filename=out_tif,
       region=wanzhou.geometry(),
       crs="EPSG:4326",
       scale=10,
    )
    return image
#下载原始数据
 download(output)
NDVI
# 选择 Sentinel-2 的红波段(B4)和近红外波段(B8)
red = output.select('B4')
nir = output.select('B8')

# 计算归一化植被指数(NDVI)
ndvi = nir.subtract(red).divide(nir.add(red)).rename('ndvi')

# 设置可视化参数
vis_params = {
  'min': -1,
  'max': 1,
  'palette': ['blue', 'white', 'green']
}
ndvi = ndvi.clip(wanzhou)
# 在地图上添加 NDVI 图层
Map.addLayer(ndvi, vis_params, "NDVI_S2_2016")
Map
download(ndvi)
1.2 各种参数计算(生物物理变量、植被指数等)
LAI:叶面积指数
这几个参数都用用snap软件打开,但是从GEE上下载的数据是tif格式的,缺失了头文件,不能用SNAP处理,我也不知道有什么好的解决方法呜呜呜
参考链接
参考文献:Boegh E,Soegaard H,Broge N,et al.Airborne multispectral data for
quantifying leaf area index,nitrogen concentration,and photosynthetic
efficiency in agriculture[J].Remote Sensing of
Environment,2002,81(2):179-193.
公式:LAI=3.618*EVI-0.118
EVI = output.expression(
    '2.5*((NIR - RED)/(NIR + 6*RED-7.5*BLUE+1))',
    {
        'NIR':output.select('B8'),
        'RED':output.select('B4'),
        'BLUE':output.select('B2')
    }
).float().rename('EVI')

LAI = output.expression(
    '3.618*EVI-0.118',
    {
        'EVI':EVI.select('EVI'),
    }
).rename('LAI')
LAI=LAI.clip(wanzhou)

download(LAI)
FAPAR:吸收的光合有效辐射的分数
参考链接
LAI和FAPAR之间存在一定的数学关系,通常使用经验公式来描述它们之间的关系。其中最常用的公式是:
FAPAR = exp(-k * LAI)
其中,k是一个常数,通常取值在0.5左右。这个公式表明,FAPAR与LAI成指数反比关系,即LAI越高,FAPAR越低。
这个公式的基本原理是,LAI越高,表示单位面积内植物叶面积越大,可以吸收更多的光能,导致FAPAR值降低。而当赖
需要注意的是,这个公式是一种经验公式,适用于各种植被类型和环境条件。在实际应用中,还需要考虑到植被的结构、生长状态、光谱特征等因素,以获得更准确的LAI和FAPAR估算结果。
FAPAR = output.expression(
    'exp(-0.51*LAI)',
    {
         'LAI':LAI.select('LAI')
    }
).float().rename('FAPAR')

download(FAPAR)
FVC:植被覆盖率
参考链接1
参考链接2
FVC = (NDVI -NDVIsoil)/ ( NDVIveg - NDVIsoil)
在ndvi影像值统计结果中,最后一列表示对应NDVI值的累积概率分布。我们分别取累积概率为5%和90%的NDVI值作为NDVImin和NDVImax
#计算NDVImin和NDVImax
from osgeo import gdal
import numpy as np

inputRaster = gdal.Open(r"E:\jupyter\geeDownloads\NDVI_2016_wanzhou.tif")  # 输入的遥感影像数据
# inputRaster = gdal.Open(r"E:\jupyter\geeDownloads\tif\NDVI.tif")  # 输入的遥感影像数据
ndviBand = inputRaster.GetRasterBand(1)
ndviValues = ndviBand.ReadAsArray()  # 将 NDVI 栅格数据转换为 numpy 数组

# 统计 NDVI 值的分布
ndviHist, ndviBins = np.histogram(ndviValues, bins=1000, range=(-1, 1))
ndviCumHist = np.cumsum(ndviHist) / ndviValues.size

# 找到累积概率值分别为 0.05 和 0.9 时对应的 NDVI 值
ndviBinSize = ndviBins[1] - ndviBins[0]
ndviSoilIndex = np.where(ndviCumHist <= 0.05)[0][-1]
ndviSoil = ndviBins[ndviSoilIndex] + ndviBinSize / 2
ndviVegIndex = np.where(ndviCumHist <= 0.9)[0][-1]
ndviVeg = ndviBins[ndviVegIndex] + ndviBinSize / 2

# 输出统计结果
print("ndviSoil: {:.3f}".format(ndviSoil))
print("ndviVeg: {:.3f}".format(ndviVeg))
然后在ArcGis中栅格计算器中计算:
Con((“NDVI.tif” >= 0.503) & (“NDVI.tif” <= 0.999), ((“NDVI.tif” - 0.503) / (0.999 - 0.503)), 0)
GEE计算植被指数
这是可选项,如果你wifi质量好,可以这样下载,当然还是建议本地计算栅格
1.比值植被指数RVI =B8/B4
2.红外植被指数IPVI=B8/(B8+B4)
3.垂直植被指数PVI=SIN(45)*B8-COS(45)*B4
4.反红边叶绿素指数IRECI=(B8-B4)/(B8+B4)
5.土壤调节植被指数SAVI=((B8-B4)/(B8+B4+L))(1+L) L取0.5
6.大气阻抗植被指数ARVI=B8-(2*B4-B2)/B8+(2B4-B2)
7.特定色素简单比植被指数PSSRa=B7/B4
8.Meris陆地叶绿素指数MTCI=(B6-B5)/(B5-B4)
9.修正型叶绿素吸收比值指数MCARI=[B5-B4]-0.2*(B5-B3)]*(B5-B4)
10.REIP红边感染点指数REIP=700+40*[(B4+B7)/2-B5]/(B6-B5)
import numpy as np
# 选择需要的波段
b4= output.select('B4')# 红波段
b8= output.select('B8')#近红外
b2= output.select('B2')#蓝波段
b3= output.select('B3')#绿波段
b7 = output.select('B7')#红边3波段
b5= output.select('B5')#红边1波段
b6 = output.select('B6')#红边2波段


# 比值植被指数RVI = B8/B4
rvi = b8.divide(b4).rename('rvi')
download(rvi)

# 红外植被指数IPVI = B8/(B8+B4)
ipvi = b8.divide(b8.add(b4)).rename('ipvi')
download(ipvi)

# 垂直植被指数PVI = SIN(45)*B8 - COS(45)*B4
pvi = b8.multiply(np.sin(45)).subtract(b4.multiply(np.cos(45))).rename('pvi')
download(pvi)

# 反红边叶绿素指数IRECI=(B8-B4)/(B8+B4)
ireci = b8.subtract(b4).divide(b8.add(b4)).rename('ireci')
download(ireci)

# 土壤调节植被指数SAVI=((NIR-R)/(NIR+R+L))(1+L)
L = 0.5  # 土壤校正因子
savi = b8.subtract(b4).divide(b8.add(b4).add(L)).multiply(1 + L).rename('savi')
download(savi)

# 大气阻抗植被指数ARVI=[NIR - (2xRed-BLUE)] / [NIR + (2xRed-BLUE)]
arvi = b8.subtract(b4.multiply(2).subtract(b2)).divide(b8.add(b4.multiply(2).subtract(b2))).rename('arvi')
download(arvi)

# 特定色素简单比植被指数PSSRa = B7/B4
pssra = b7.divide(b4).rename('pssra')
download(pssra)

# Meris陆地叶绿素指数MTCI = (B6 - B5)/(B5 - B4 - 0.01)
mtci = b6.subtract(b5).divide(b5.subtract(b4).subtract(0.01)).rename('mtci')
download(mtci)

# 修正型叶绿素吸收比值指数MCARI = (B5 - B4 - 0.2*(B5 - B3))*(B5-B4)
mcari = b5.subtract(b4).subtract((b5.subtract(b3)).multiply(0.2)).multiply(b5.subtract(b4)).rename('mcari')
download(mcari)

# REIP红边感染点指数REIP = 700 + 40*((B4+B7)/2 - B5)/(B6 - B5)
reip = ee.Image(700).add(ee.Image(40).multiply(b4.add(b7).divide(2).subtract(b5).divide(b6.subtract(b5)))).rename('reip')
download(reip)
采用gdal计算各类植被指数
Sentinel-2 影像文件名 s.tif,然后使用以下命令将指数计算转换为 GDAL python本地计算
安装gdal库,安装gdal库建议采用本地安装,去下载whl文件,然后转到放置whl文件的目录下,pip install 即可
进入安装好gdal库的虚拟环境,然后将gdal_calc.py下载地址和s.tif文件放在同一个文件夹下。运行python gdal_calc.py文件
RVI:
python gdal_calc.py -A s.tif --A_band=4 -B s_wanzhou.tif --B_band=8 --outfile=rvi_wanzhou.tif --calc="(B/A)"
IPVI:
python gdal_calc.py -A s.tif --A_band=4 -B s_wanzhou.tif --B_band=8 --outfile=ipvi_wanzhou.tif --calc="(B/(A+B))"
PVI:
python gdal_calc.py -A s.tif --A_band=4 -B s.tif --B_band=8 --outfile=pvi.tif --calc="(sin(pi/4)*B)-(cos(pi/4)*A)"
IRECI:
python gdal_calc.py -A s.tif --A_band=4 -B s.tif --B_band=8 --outfile=ireci.tif --calc="((B-A)/(B+A))"
SAVI:
python gdal_calc.py -A s_wanzhou.tif --A_band=4 -B s_wanzhou.tif --B_band=8 --outfile=savi_wanzhou.tif --calc="((B-A)/(B+A+0.5))*(1+0.5)"
ARVI:
python gdal_calc.py -A s_wanzhou.tif -B s_wanzhou.tif -C s_wanzhou.tif --A_band=4 --B_band=8 --C_band=2 --outfile=arvi_wanzhou.tif --calc="((B-(2*A-C))/(B+(2*A-C)))"
PSSRa:
python gdal_calc.py -A s_wanzhou.tif --A_band=4 -B s_wanzhou.tif --B_band=7 --outfile=pssra_wanzhou.tif --calc="(B/A)"
MTCI:
python gdal_calc.py -A s_wanzhou.tif --A_band=4 -B s_wanzhou.tif --B_band=5 -C s_wanzhou.tif --C_band=6 --outfile=mtci_wanzhou.tif --calc="((B-C)/(C-A-0.01))"
MCARI:
python gdal_calc.py -A s_wanzhou.tif --A_band=4 -B s_wanzhou.tif --B_band=5 -C s_wanzhou.tif --C_band=3 --outfile=mcari_wanzhou.tif --calc="((B-A)-(0.2*(B-C)))*(B-A)"
REIP:
python gdal_calc.py -A s_wanzhou.tif --A_band=4 -B s_wanzhou.tif --B_band=5 -C s_wanzhou.tif --C_band=6 -D s_wanzhou.tif --D_band=7 --outfile=reip_wanzhou.tif --calc="(700)+(40*((B+D)/2-A)/(C-A))"
请注意,这里的 s.tif 文件名应该与你的实际文件名相匹配,而且在计算 SAVI 时,你需要预先定义 L 的值并将其替换为相应的值。
采用gdal_calc.py的命令计算一下哨兵二号的
NDVI78a (NIR2 – RE3)/ (NIR2 + RE3)
NDVI67 (RE3- RE2)/ (RE3+ RE2)
NDVI58a (NIR2- RE1)/ (NIR2 + RE1)
NDVI56 (RE2- RE1)/ (RE2+ RE1)
NDVI57 (RE3- RE1)/ (RE3+ RE1)
NDVI68a (NIR2 - RE2)/ (NIR2 + RE2)
NDVI48 (NIR - R)/ (NIR + R)
注:蓝波段(B)、绿波段 (G)、红波段 ®、近红外波段(NIR1)、窄近红外波段 (NIR2)、红边波段 1 (RE1)、
红边波段 2 (RE2)、红边波段 3 (RE3).
python gdal_calc.py -A sentinel2.tif --A_band=8 -B sentinel2.tif --B_band=7 --outfile=ndvi78a.tif --calc="(A-B)/(A+B)" --NoDataValue=0

python gdal_calc.py -A sentinel2.tif --A_band=7 -B sentinel2.tif --B_band=6 --outfile=ndvi67.tif --calc="(A-B)/(A+B)" --NoDataValue=0

python gdal_calc.py -A sentinel2.tif --A_band=8 -B sentinel2.tif --B_band=5 --outfile=ndvi58a.tif --calc="(A-B)/(A+B)" --NoDataValue=0

python gdal_calc.py -A sentinel2.tif --A_band=6 -B sentinel2.tif --B_band=5 --outfile=ndvi56.tif --calc="(A-B)/(A+B)" --NoDataValue=0

python gdal_calc.py -A sentinel2.tif --A_band=7 -B sentinel2.tif --B_band=5 --outfile=ndvi57.tif --calc="(A-B)/(A+B)" --NoDataValue=0

python gdal_calc.py -A sentinel2.tif --A_band=8 -B sentinel2.tif --B_band=6 --outfile=ndvi68a.tif --calc="(A-B)/(A+B)" --NoDataValue=0

python gdal_calc.py -A sentinel2.tif --A_band=8 -B sentinel2.tif --B_band=4 --outfile=ndvi48.tif --calc="(A-B)/(A+B)" --NoDataValue=0
1.3 纹理特征参数提取
采用envi软件
有研究表明,遥感数据的纹理信息能够增强原始影像亮度的空间信息辨识度,提升地表参数的反演精度。本研究采用灰度共生矩阵( gray level co-occurrence matrix,GLCM) 提取纹理特征信息,究纹理窗口大小设置为 3×3,获取8类 纹 理 特 征 值。
灰度共生矩阵提取纹理特征信息可参考
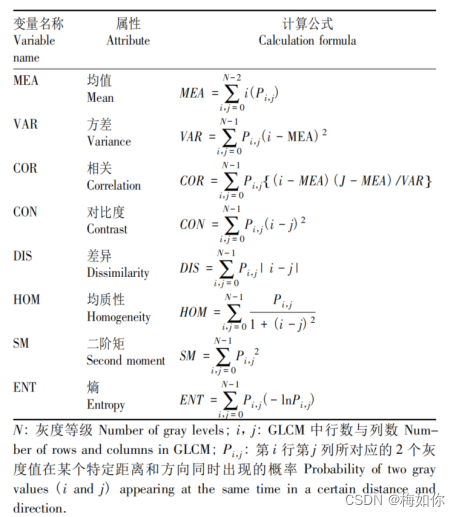
处理完后可将纹理信息提取出来,可通过APP store 中的Split to Multiple Single-Band Files 工具进行直接拆分
Sentinel-2中10个波段每个波段的纹理信息共80个
二.哨兵1号获取/处理/提取数据
哨兵1号数据在欧空局中下载,然后采用SNAP软件对其进行一系列处理
可参考链接
处理后记得把坐标系和投影转成和哨兵2号一样
2.1 纹理特征参数提取
同1.3
基于 VH 和VV 极化影像提取纹理特征信息,获 取 8X2=16 个 纹 理 特 征


三、DEM数据
3.1 数据下载
可参考这篇文章进行数据下载
3.2 数据处理
一定要注意呀!
获取的数据是30m分辨率的,哨兵数据是10米分辨率,在arcGis中搜索resample 需要将DEM重采样到10米分辨率。
然后在ArcGis中搜索坡度和坡向这两个工具,分别计算这两变量。
四、样本生物量计算
代码如下,d代表胸径,h代表树高
查找优势树种对应的异速生长方程写上就行
import pandas as pd
# 读取 CSV 文件
df = pd.read_csv('E:\Sentinel12\yangben\yangben.csv', encoding='gbk')
# 定义优势树种类型及对应的
tree_types = {
    '柏木': lambda d, h: 0.12703 * (d ** 2 * h )** 0.79775,
    '刺槐': lambda d, h: ( 0.05527 * (d ** 2 * h )** 0.8576) + (  0.02425* (d ** 2 * h )** 0.7908) +( 0.0545 * (d ** 2 * h )** 0.4574),
     #http://www.xbhp.cn/news/11502.html
    '栎类': lambda d, h:0.16625 * ( d ** 2 * h ) ** 0.7821,
    '柳杉': lambda d, h:( 0.2716 * ( d ** 2 * h ) ** 0.7379 ) + ( 0.0326 * ( d ** 2 * h ) ** 0.8472 ) + ( 0.0250 * ( d ** 2 * h ) ** 1.1778 ) + ( 0.0379 * ( d ** 2 * h ) ** 0.7328 ),
    '马尾松': lambda d, h: 0.0973 * (d ** 2 * h )** 0.8285,
    '其他硬阔': lambda d, h:( 0.0125 * (d ** 2 * h )**1.05 ) + (  0.000933* (d ** 2 * h )**1.23 ) +( 0.000394 * (d ** 2 * h )** 1.20),
    '杉木': lambda d, h: ( 0.00849 * (d ** 2 * h) ** 1.107230) + ( 0.00175 * (d ** 2 * h )** 1.091916) + 0.00071 * d **3.88664 ,
    '湿地松': lambda d, h: 0.01016* (d ** 2 * h )**1.098,
    '香樟': lambda d, h:( 0.05560 * (d ** 2 * h )** 0.850193) + ( 0.00665 * (d ** 2 * h )** 1.051841) +( 0.05987 * (d ** 2 * h )** 0.574327)+( 0.01476 * (d ** 2 * h )** 0.808395) ,
    '油桐': lambda d, h: ( 0.086217 *d ** 2.00297)+ ( 0.072497 *d ** 2.011502)+( 0.035183 *d ** 1.63929),
    '杨树': lambda d, h: ( 0.03 * (d ** 2 * h )** 0.8734) + ( 0.0174 * (d ** 2 * h )** 0.8574) +( 0.4562 * (d ** 2 * h )** 0.3193)+( 0.0028 * (d ** 2 * h )**0.9675 ) ,
}

# 遍历样本并计算地上生物量```python
for i, row in df.iterrows():
    tree_type = row['优势树']
    if tree_type in tree_types:s
        d = row['平均胸径']
        h = row['林分平均树高']
        biomass = tree_types[tree_type](d, h)
        df.at[i, '生物量'] = biomass

# 将计算后的地上生物量写入 CSV 文件
df.to_csv('E:\Sentinel12\yangben\yangben_processed.csv', index=False)
五、样本变量选取
将样本导入arcgis,设置好投影信息,在ArcGis中找到多值提取至点工具。
参考这篇文章
六、随机森林建模
参考1
参考2
可以用SPSS进行相关性分析,可参考,选择相关性比较大的变量进行建模
随机森林代码如下:
6.1导入库与变量准备
记得安装sklearn包
命令行如下:
pip install scikit-learn
本文中设计到的所有python代码均在jupyter notebook中运行
import pandas as pd
import numpy as np
from matplotlib import pyplot as plt
from sklearn.ensemble import RandomForestRegressor
from sklearn.model_selection import train_test_split
from sklearn.metrics import mean_squared_error, r2_score
from pyswarm import pso
import rasterio
# import pydot
import numpy as np
import pandas as pd
import scipy.stats as stats
from pprint import pprint
from sklearn import metrics
from sklearn.model_selection import GridSearchCV
from sklearn.model_selection import RandomizedSearchCV
from joblib import dump
# 读取Excel表格数据
data = pd.read_csv(r'E:\Sentinel12\yangben\建模\jianmo.csv' )
y = data.iloc[:, 0].values  # 生物量
X = data.iloc[:, 1:].values  # 指标变量
df = pd.DataFrame(data)
random_seed=44
random_forest_seed=np.random.randint(low=1,high=230)
# 分割数据集为训练集和测试集
X_train, X_test, y_train, y_test = train_test_split(X, y, test_size=0.3, random_state=42)
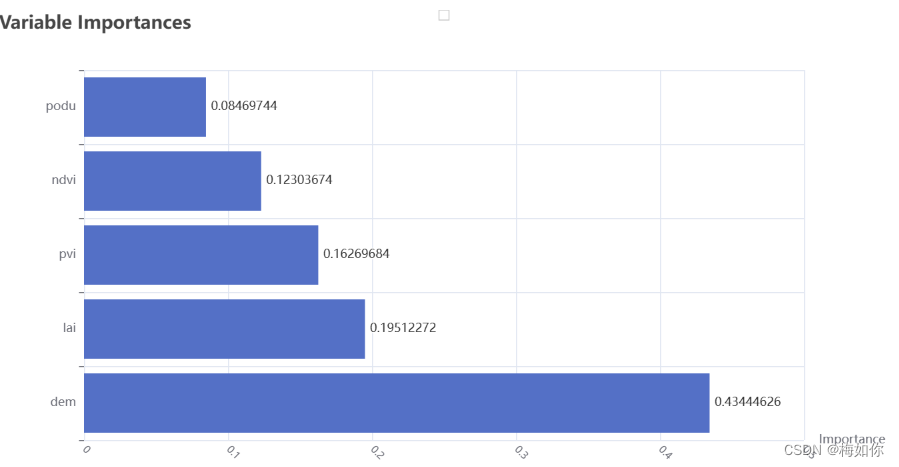
运行完这个代码块,可以打印一下,看看变量长什么样。这里可以看到,选取的变量一共有5个,值分别为1.11691217e+01, 4.37000000e+02, 1.31032691e+00, 7.31299972e-01, 1.13057424e-01 可以打开样本表看看,这五个变量对应的值是否正确。

6.2 选取参数
决策树个数n_estimators
决策树最大深度max_depth,
最小分离样本数(即拆分决策树节点所需的最小样本数) min_samples_split,
最小叶子节点样本数(即一个叶节点所需包含的最小样本数)min_samples_leaf,
最大分离特征数(即寻找最佳节点分割时要考虑的特征变量数量)max_features
# Search optimal hyperparameter
#对六种超参数划定了一个范围,然后将其分别存入了一个超参数范围字典random_forest_hp_range
n_estimators_range=[int(x) for x in np.linspace(start=50,stop=3000,num=60)]
max_features_range=['sqrt','log2',None]
max_depth_range=[int(x) for x in np.linspace(10,500,num=50)]
max_depth_range.append(None)
min_samples_split_range=[2,5,10]
min_samples_leaf_range=[1,2,4,8]

random_forest_hp_range={'n_estimators':n_estimators_range,
                        'max_features':max_features_range,
                        'max_depth':max_depth_range,
                        'min_samples_split':min_samples_split_range,
                        'min_samples_leaf':min_samples_leaf_range
                        }
random_forest_model_test_base=RandomForestRegressor()
random_forest_model_test_random=RandomizedSearchCV(estimator=random_forest_model_test_base,
                                                   param_distributions=random_forest_hp_range,
                                                   n_iter=200,
                                                   n_jobs=-1,
                                                   cv=3,
                                                   verbose=1,
                                                   random_state=random_forest_seed
                                                   )
random_forest_model_test_random.fit(X_train,y_train)

best_hp_now=random_forest_model_test_random.best_params_
# Build RF regression model with optimal hyperparameters
random_forest_model_final=random_forest_model_test_random.best_estimator_
print(best_hp_now)
可以看到打印结果

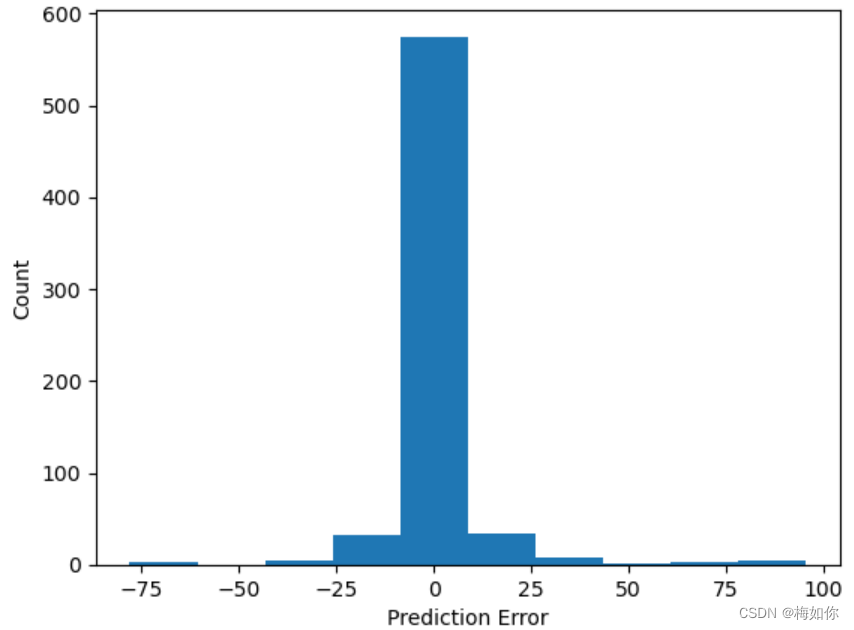
6.3 误差分布直方图
如果直方图呈现正态分布或者近似正态分布,说明模型的预测误差分布比较均匀,预测性能较好。如果直方图呈现偏斜或者非正态分布,说明模型在某些情况下的预测误差较大,预测性能可能需要进一步改进。
# Predict test set data
random_forest_predict=random_forest_model_test_random.predict(X_test)
random_forest_error=random_forest_predict-y_test

plt.figure(1)
plt.clf()
plt.hist(random_forest_error)
plt.xlabel('Prediction Error')
plt.ylabel('Count')
plt.grid(False)
plt.show()
6.4 变量重要性可视化展示
# 计算特征重要性
random_forest_importance = list(random_forest_model_final.feature_importances_)
random_forest_feature_importance = [(feature, round(importance, 8))
                                    for feature, importance in zip(df.columns[4:], random_forest_importance)]
random_forest_feature_importance = sorted(random_forest_feature_importance, key=lambda x:x[1], reverse=True)

# 将特征重要性转换为Pyecharts所需的格式
x_data = [item[0] for item in random_forest_feature_importance]
y_data = [item[1] for item in random_forest_feature_importance]

# 绘制柱状图
bar = (
    Bar()
    .add_xaxis(x_data)
    .add_yaxis("", y_data)
    .reversal_axis()
    .set_series_opts(label_opts=opts.LabelOpts(position="right"))
    .set_global_opts(
        title_opts=opts.TitleOpts(title="Variable Importances"),
        xaxis_opts=opts.AxisOpts(name="Importance",axislabel_opts=opts.LabelOpts(rotate=-45, font_size=10)),
        yaxis_opts=opts.AxisOpts(name_gap=30, axisline_opts=opts.AxisLineOpts(is_show=False)),
        tooltip_opts=opts.TooltipOpts(trigger="axis", axis_pointer_type="shadow")
    )
)

bar.render_notebook()
6.5 对精度进行验证
这里可输出相关的精度值
# Verify the accuracy
random_forest_pearson_r=stats.pearsonr(y_test,random_forest_predict)
random_forest_R2=metrics.r2_score(y_test,random_forest_predict)
random_forest_RMSE=metrics.mean_squared_error(y_test,random_forest_predict)**0.5
print('Pearson correlation coefficient = {0}、R2 = {1} and RMSE = {2}.'.format(random_forest_pearson_r[0],random_forest_R2,random_forest_RMSE))
6.6 预测生物量
注意几个tif数据的nodata值不一样,最好全部都将nodata值设为0,最后得到的biomass图像按照掩膜提取,nodata就变回来啦
import numpy as np
import rasterio
from tqdm import tqdm

# 读取五个栅格指标变量数据并整合为一个矩阵
with rasterio.open(r'E:\Sentinel12\yangben\建模\result\nodata\podu.tif') as src:
    data1 = src.read(1)
    meta = src.meta
with rasterio.open(r'E:\Sentinel12\yangben\建模\result\nodata\dem.tif') as src:
    data2 = src.read(1)
with rasterio.open(r'E:\Sentinel12\yangben\建模\result\nodata\lai.tif') as src:
    data3 = src.read(1)
with rasterio.open(r'E:\Sentinel12\yangben\建模\result\nodata\ndvi.tif') as src:
    data4 = src.read(1)
with rasterio.open(r'E:\Sentinel12\yangben\建模\result\nodata\pvi.tif') as src:
    data5 = src.read(1)

X = np.stack((data1, data2, data3, data4, data5), axis=-1)

# 清洗输入数据
X_2d = X.reshape(-1, X.shape[-1])
# 检查数据中是否存在 NaN 值
print(np.isnan(X_2d).any())  # True

# 将 nodata 值替换为0
X_2d[np.isnan(X_2d)] = 0

# 使用已经训练好的随机森林模型对整合后的栅格指标变量数据进行生物量的预测
y_pred = []
for i in tqdm(range(0, X_2d.shape[0], 10000)):
    y_pred_chunk = random_forest_model_test_random.predict(X_2d[i:i+10000])
    y_pred.append(y_pred_chunk)
y_pred = np.concatenate(y_pred)

# 将预测结果保存为一个新的栅格数据
with rasterio.open(r'E:\Sentinel12\yangben\建模\result\biomass_v5.tif', 'w', **meta) as dst:
    dst.write(y_pred.reshape(X.shape[:-1]), 1)
print("预测结束")
运行之后会在下面出现进度条,进度条走完了就代码预测完了

七、生物量制图
7.1. 将得到的biomass.tif文件按掩膜提取
掩膜文件选择用于预测的tif文件,目的是将nodata值还原回来。
7.2. 提取森林掩膜区域
[参考链接](https://www.bilibili.com/video/BV1qv4y1A75B?p=10&vd_source=ddb0eb9d8fde0d0629fc9f25dc6915e5)
-
这里需要全球土地覆盖10米的更精细分辨率观测和监测(FROM-GLC10)数据。
-
我们在GEE平台上下载研究区的GLC10图,参考链接
- 在 Google Earth Engine Code Editor 中搜索“ESA Global Land Cover 10m v2.0.0”并加载该数据集。
var glc = ee.Image('ESA/GLOBCOVER_L4_200901_200912_V2_3');
- 定义您感兴趣的区域。
这里的table需要先将shp文件上传到平台,再点那个小箭头导入
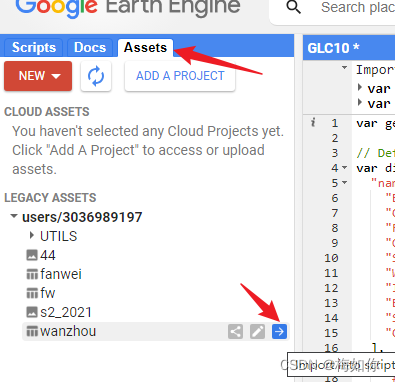
这里就会有table出现

var geometry = table;
- 使用 Image.clip() 函数将图像裁剪为您感兴趣的区域。
var clipped = glc.clip(geometry);
- 使用 Export.image.toDrive() 函数导出图像。以下代码将图像导出到您的 Google Drive 中。
Export.image.toDrive({
  image: clipped,
  description: 'GLC',
  folder: 'my_folder',
  scale: 10,
  region: geometry
});
其中,description 是导出图像的名称,folder 是导出图像的文件夹,scale 是导出图像的分辨率,region 是导出图像的区域。
- 点击“Run”按钮运行代码。代码运行完成后,您可以在 Google Drive 中找到导出的图像文件。
- 20序号代表森林,按属性提取,可以把森林提取出来,按属性提取工具。
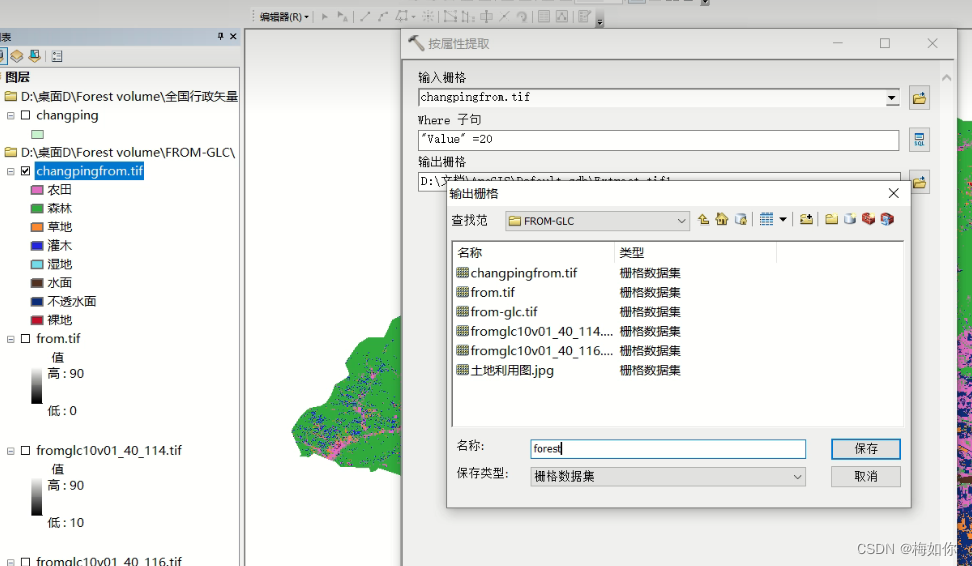
将生物量.tif按照掩膜tif掩膜即可得到森林区域的生物量。
八. 需要注意的点
- 每个栅格变量数据一定要保持行数和列数一致,这不仅是为了”多值提取至点“等一一对应,更是为了最后估算生物量的时候生成二维矩阵输入模型,保证输入数据的维度一致。
- 第一步的前提是第二部,投影!投影!投影!重要的事情说三遍,一定要在相同坐标系下面
- 注意nodata值的处理,最好所有的影像nodata设置为0,这样最后输入模型中可以减少计算量。
