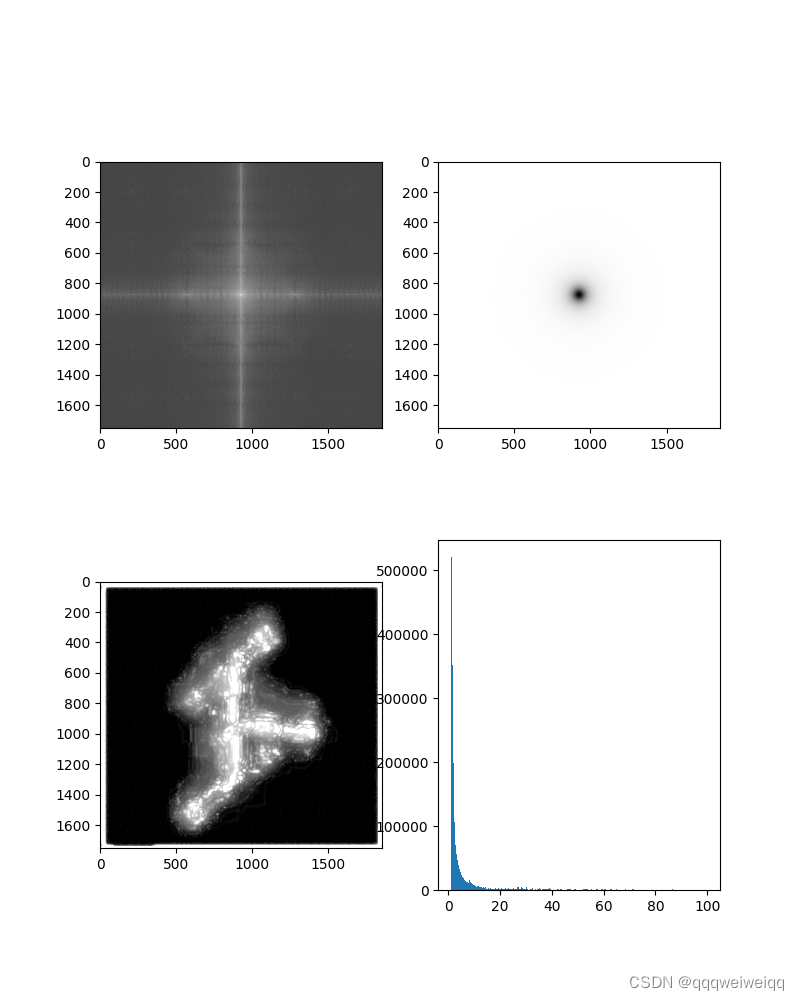
import numpy as np
import matplotlib.pyplot as plt
import cv2

def Butterworth_Filter_Image():
    img = cv2.imread(r'/Users/PycharmProjects/ImageProcess/Butterworth Filter Image/Pasted Graphic 31.png',0)
    plt.imshow(img)
    # ——————————————————————————————————————————————————————————————————————————————————
    F_domain = np.fft.fft2(img)
    F_shift = np.fft.fftshift(F_domain)
    # ——————————————————————————————————————————————————————————————————————————————————
    plt.figure(figsize=(8,10))

    # plot loss

    plt.subplot(2,2,1)
    plt.imshow(np.log1p(np.abs(F_shift)), cmap='gray')
    # plt.axis('off')
    # plt.show()

    M_shape, N_shape = img.shape
    H = np.zeros((M_shape, N_shape), dtype=np.float32)
    D0 = 40  # cut-off frequency
    n = 2 # It is order for butterworth
    for u in range(M_shape):
        for v in range(N_shape):
            D = np.sqrt((u - M_shape / 2) ** 2 + (v - N_shape / 2) ** 2)
            # H[u, v] = 1-1 / (1 + (D / D0) ** n)
            H[u, v] = 1 / (1 + (D0 / D) ** n)


    # __————————————————————————————————————————————————————————————————————
    # plt.figure(figsize=(8,10))

    # plot loss

    plt.subplot(2,2,2)

    plt.imshow(H, cmap='gray')
    # plt.axis('off')
    # plt.show()


    # ——————————————————————————————————————————————————————————————————————————————————

    G_shift = F_shift * H
    G = np.fft.ifftshift(G_shift)
    g = np.abs(np.fft.ifft2(G))
    # mean_img.mean()

    print(g.shape)
    plt.subplot(2,2,3)

    # plt.imshow(g, cmap='gray',vmin=g.mean()-3*g.std(),vmax=g.mean()+3*g.std())
    # plt.imshow(10*g+img, cmap='gray')
    plt.imshow(10*g+img, cmap='gray',vmin=20,vmax=250)

    # plt.axis('off')


    # plt.show()


#     ————————————————————————————————————————————————————————
    plt.subplot(2,2,4)

    plt.hist(g.ravel(), 256, [1, 100])  # numpy的ravel函数功能是将多维数组降为一维数组

    # plt.axis('off')
    plt.savefig('/Users/PycharmProjects/ImageProcess/2d_scatterplot_1.3_n=2.png')

    # plt.show()


if __name__ == '__main__':
    Butterworth_Filter_Image()
