3.1线性回归模型-part-1
In this video, we’ll look at what the overall process of supervised learning is like. Specifically, you see the first model of this course, Linear Regression Model. That just means fitting a straight line to your data. It’s probably the most widely used learning algorithm in the world today. As you get familiar with linear regression, many of the concepts you see here will also apply to other machine learning models that you’ll see later in this specialization. Let’s start with a problem that you can address using linear regression.
在这个视频中,我们将了解到监督学习的整体过程是什么样的。具体来说,你将看到本课程的第一个模型:线性回归模型。它能将你的数据拟合成一条直线。它可能是当今世界上最广泛使用的学习算法。当你熟悉线性回归后,你在这里看到的许多概念也会适用于你在本专项课程后面看到的其他机器学习模型。让我们从一个可以用线性回归来解决的问题开始。
Say you want to predict the price of a house based on the size of the house. This is the example we’ve seen earlier this week. We’re going to use a dataset on house sizes and prices from Portland, a city in the United States. Here we have a graph where the horizontal axis is the size of the house in square feet, and the vertical axis is the price of a house in thousands of dollars.
假设你想根据房屋的面积来预测房屋的价格。这是我们本周早些时候看过的例子。我们将使用来自美国波特兰市的一个关于房屋面积和价格的数据集。这里有一张图,横轴表示房屋的面积(以平方英尺为单位),纵轴表示房屋的价格(以千美元为单位)。

Let’s go ahead and plot the data points for various houses in the dataset. Here each data point, each of these little crosses is a house with the size and the price that it most recently was sold for. Now, let’s say you’re a real estate agent in Portland and you’re helping a client to sell her house. She is asking you, how much do you think I can get for this house? This dataset might help you estimate the price she could get for it.
让我们继续绘制数据集中各个房屋的数据点。在图中,每一个X代表一座房屋,它对应的横纵坐标分别展现了它的面积和最近售价。现在假设你是波特兰的一位房地产经纪人,你正在帮助一位客户出售她的房子。她问你:“你认为我能以多少价格出售这座房子?”,这个数据集可能会帮助你估计她的房子的价格。

You start by measuring the size of the house, and it turns out that the house is 1250 square feet. How much do you think this house could sell for? One thing you could do this, you can build a linear regression model from this dataset. Your model will fit a straight line to the data, which might look like this. Based on this straight line fit to the data, you can see that the house is 1250 square feet, it will intersect the best fit line over here, and if you trace that to the vertical axis on the left, you can see the price is maybe around here, say about $220,000.
你开始测量这座房子的面积,结果发现它是1250平方英尺。你认为这座房子可能以多少价格售出?你可以通过这个数据集建立一个线性回归模型来进行估算。你的模型将会将一条直线拟合到数据对应的二维图像上,可能看起来是这样的(下图中的蓝色线)。基于这条最佳拟合直线,你可以看到,当这座房子的面积为1250平方英尺时,它将与最佳拟合线相交于这里(黄色直线与蓝色直线相交的点),如果你追踪垂直轴上的数值,你会发现价格大约在这个位置(粉色线的纵坐标的值),可能是22万美元左右。

This is an example of what’s called a supervised learning model. We call this supervised learning because you are first training a model by giving a data that has right answers because you get the model examples of houses with both the size of the house, as well as the price that the model should predict for each house. Well, here are the prices, that is, the right answers are given for every house in the dataset.
线性回归就是一个监督学习的典型案例。之所以我们将线性回归归类为监督学习,是因为你先要给算法提供具有正确答案的数据来训练模型。在本例中,你提供了房屋的面积以及模型应该为每座房屋预测的价格(就是你先提供了数据,然后再对新的输入做预测)。也就是说,你为数据集中的每个房子样本都提供了正确的答案(价格)。
This linear regression model is a particular type of supervised learning model. It’s called regression model because it predicts numbers as the output like prices in dollars. Any supervised learning model that predicts a number such as 220,000 or 1.5 or negative 33.2 is addressing what’s called a regression problem. Linear regression is one example of a regression model. But there are other models for addressing regression problems too. We’ll see some of those later in Course 2 of this specialization.
线性回归模型是一种特殊的监督学习模型。之所以称他为回归模型是因为它预测的输出结果是数值,比如美元价格。任何一个预测数值(比如220,000、1.5或-33.2)的监督学习模型都可以解决所谓的回归问题。线性回归是回归模型的一个例子,但还有其他模型可以解决回归问题。在本专项课程的第二门课程中,我们将看到其他的模型。

Just to remind you, in contrast with the regression model, the other most common type of supervised learning model is called a classification model. Classification model predicts categories or discrete categories, such as predicting if a picture is of a cat, meow or a dog, woof, or if given medical record, it has to predict if a patient has a particular disease. You’ll see more about classification models later in this course as well. As a reminder about the difference between classification and regression, in classification, there are only a small number of possible outputs.
在这里我要提醒一下你,与回归模型相对应的另一种最常见的监督学习模型叫作分类模型。分类模型用于预测类别或离散的分类,比如预测一张图片是猫还是狗,或者在给定病例的情况下,预测患者是否患有某种特定疾病。在本课程后面的内容中,您还会了解更多关于分类模型的知识。再提一下分类和回归之间的区别,在分类模型中,可能的输出只有很少几个。
If your model is recognizing cats versus dogs, that’s two possible outputs. Or maybe you’re trying to recognize any of 10 possible medical conditions in a patient, so there’s a discrete, finite set of possible outputs. We call it classification problem, whereas in regression, there are infinitely many possible numbers that the model could output.
如果您的模型是用来识别猫和狗的,那它只有两种可能的输出。或者您正在尝试识别患者身上可能存在的10种医疗状况,所以模型只能有一个离散的、有限的可能输出集合。我们将其称为分类问题,而在回归问题中,模型可以输出无限多个可能的数值。

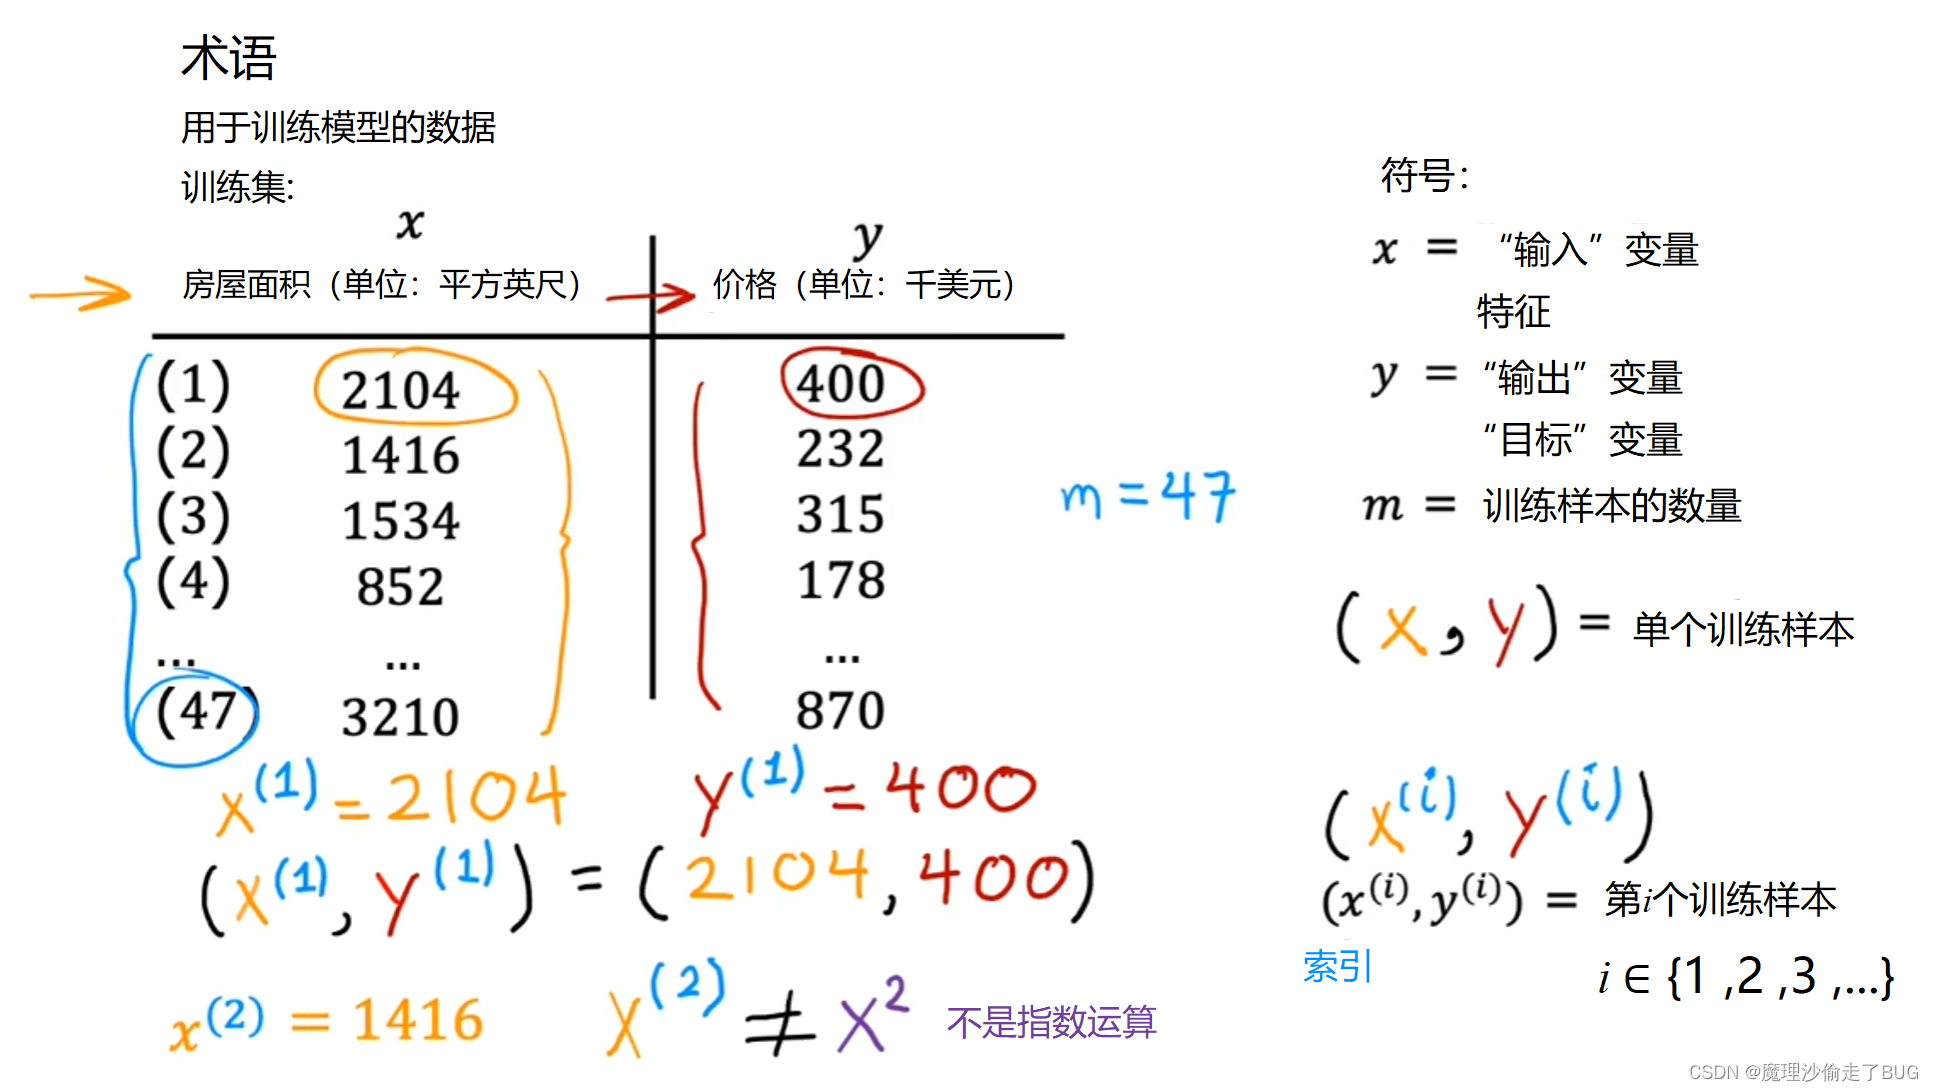
In addition to visualizing this data as a plot here on the left, there’s one other way of looking at the data that would be useful, and that’s a data table here on the right. The data comprises a set of inputs. This would be the size of the house, which is this column here. It also has outputs. You’re trying to predict the price, which is this column here.
除了在左侧将这些数据可视化为图表之外,还有一种有用的方法可以查看数据,那就是用右侧的这个数据表。右侧数据表中的数据包括一组输入。这里是房屋的面积,就是这一列(黄色线条)。同时,还有输出。你要预测的是价格,就是这一列(红色线条)。

Notice that the horizontal and vertical axes correspond to these two columns, the size and the price. If you have, say, 47 rows in this data table, then there are 47 of these little crosses on the plot of the left, each cross corresponding to one row of the table.
请注意,横轴和纵轴对应的是这两列,即面积和价格。假设在这个数据表中有47行,那么在左边的图表上就会有47个这样的X点,每个X点对应表格中的一行数据。

For example, the first row of the table is a house with size, 2,104 square feet, so that’s around here, and this house is sold for $400,000 which is around here.
例如,表格的第一行(蓝色标记)是一个面积为2104平方英尺的别墅,所以它在这儿附近(横轴标记的黄色2104字样),而这栋房子的售价是400000美元,也就是在这儿(纵轴标记的红色400字样)

This first row of the table is plotted as this data point over here.
表格的第一行对应的数据点应该在此处绘制。(左侧图中青蓝色圆圈标记处)

Now, let’s look at some notation for describing the data. This is notation that you find useful throughout your journey in machine learning. As you increasingly get familiar with machine learning terminology, this would be terminology they can use to talk about machine learning concepts with others as well since a lot of this is quite standard across AI, you’ll be seeing this notation multiple times in this specialization, so it’s okay if you don’t remember everything for assign through, it will naturally become more familiar overtime.
现在,让我们来看一下描述数据的一些符号表示法。这是你在机器学习旅程中很有用的表示法。随着你对机器学习术语越来越熟悉,这些表示法也可以用来与他人讨论机器学习概念,因为这些符号很多都是人工智能领域的标准。在本专项课程中,你会多次见到这些符号表示法,因此如果你不能完全记住所有内容,也没关系,随着时间的推移,它们会自然而然地对这些符号更加熟悉。
The dataset that you just saw and that is used to train the model is called a training set. Note that your client’s house is not in this dataset because it’s not yet sold, so no one knows what the price is. To predict the price of your client’s house, you first train your model to learn from the training set and that model can then predict your client’s houses price.
你刚刚看到的用于训练模型的数据集被称为训练集。请注意,你客户的房屋不在这个数据集中,因为它尚未出售,所以没有人知道价格是多少。为了预测你客户的房屋价格,你首先需要让模型从训练集中学习,然后该模型可以预测你客户房屋的价格。
【概念】训练集:从数据中学得模型的过程称为"学习" (learning) 或"训练" (training), 这个过程通过执行某个学习算法来完成.训练过程中使用的数据称为"训练数据" (training data) ,其中每个样本称为一个"训练样本" (training sample), 训练样本组成的集合称为"训练集" (training set).
引用自周志华的《机器学习》
In Machine Learning, the standard notation to denote the input here is lowercase x, and we call this the input variable, is also called a feature or an input feature. For example, for the first house in your training set, x is the size of the house, so x equals 2,104. The standard notation to denote the output variable which you’re trying to predict, which is also sometimes called the target variable, is lowercase y. Here, y is the price of the house, and for the first training example, this is equal to 400, so y equals 400.
在机器学习中,表示输入的标准符号是小写的
x
x
x,我们称之为输入变量,也被称为特征或输入特征。例如,对于训练集中的第一栋房屋,
x
x
x 表示房屋的面积,所以
x
=
2104
x=2104
x=2104。表示预测的输出变量的标准符号是小写的
y
y
y,有时也称为目标变量。在这里,
y
y
y 表示房屋的价格,对于第一个训练样本,
y
y
y是 400,所以
y
=
400
y=400
y=400

The dataset has one row for each house and in this training set, there are 47 rows with each row representing a different training example. We’re going to use lowercase m to refer it to the total number of training examples, and so here m is equal to 47. To indicate the single training example, we’re going to use the notation parentheses x, y. For the first training example, x, y, this pair of numbers is 2,104, 400.
在这个数据集中,每个房屋对应表格中的每一行,在这个训练集中,共有47行,每行代表一个不同的训练样本。我们将使用小写的
m
m
m 来表示训练样本的总数,所以这里
m
=
47
m=47
m=47。我们将使用
(
x
,
y
)
(x,y)
(x,y)的符号表示单个的训练样本。对于第一个训练样本,x, y 这对数字是
(
2104
,
400
)
(2104,400)
(2104,400).
Now we have a lot of different training examples. We have 47 of them in fact. To refer to a specific training example, this will correspond to a specific row in this table on the left, I’m going to use the notation x superscript in parenthesis, i, y superscript in parentheses i. The superscript tells us that this is the ith training example, such as the first, second, or third up to the 47th training example. I here, refers to a specific row in the table.
现在我们有很多不同的训练样本(实际上我们有47个训练样本)。为了表示特定的训练样本,它对应于左侧表格中的特定行,我将使用上标
i
i
i的符号表示,即
(
x
(
i
)
,
y
(
i
)
)
(x^{(i)},y^{(i)})
(x(i),y(i)). 上标告诉我们这是第
i
i
i个训练样本,例如第一个、第二个,一直到第47个训练样本。这里的
i
i
i指的是表格中的特定行。

For instance, here is the first example, when i equals 1 in the training set, and so x superscript 1 is equal to 2,104 and y superscript 1 is equal to 400 and let’s add this superscript 1 here as well. Just to note, this superscript i in parentheses is not exponentiation. When I write this, this is not x squared. This is not x to the power 2. It just refers to the second training example. This i, is just an index into the training set and refers to row i in the table.
例如,这是第一个例子,当
i
=
1
i=1
i=1时,在训练集中,我们有
x
(
1
)
=
2104
x^{(1)}=2104
x(1)=2104,
y
(
1
)
=
400
y^{(1)}=400
y(1)=400,让我们也在这里加上上标 1(上图的蓝色上标(1))。需要注意的是,括号中的上标
i
i
i不表示指数运算。当我写下这个时,它不是
x
x
x 的平方,也不是
x
x
x 的2次幂。它只是指第二个训练样本。这里的
i
i
i只是训练集中的索引,对应表格中的第
i
i
i行。
In this video, you saw what a training set is like, as well as a standard notation for describing this training set. In the next video, let’s look at what rotate to take this training set that you just saw and feed it to learning algorithm so that the algorithm can learn from this data. Let’s see that in the next video.
在这个视频中,你了解了什么是训练集,以及描述训练集的标准符号表示法。在下一个视频中,让我们来看看如何将这个你刚刚看到的这个训练集输入到学习算法中,以便算法能够从这些数据中学习。我们将在下一个视频中详细了解这个问题。
