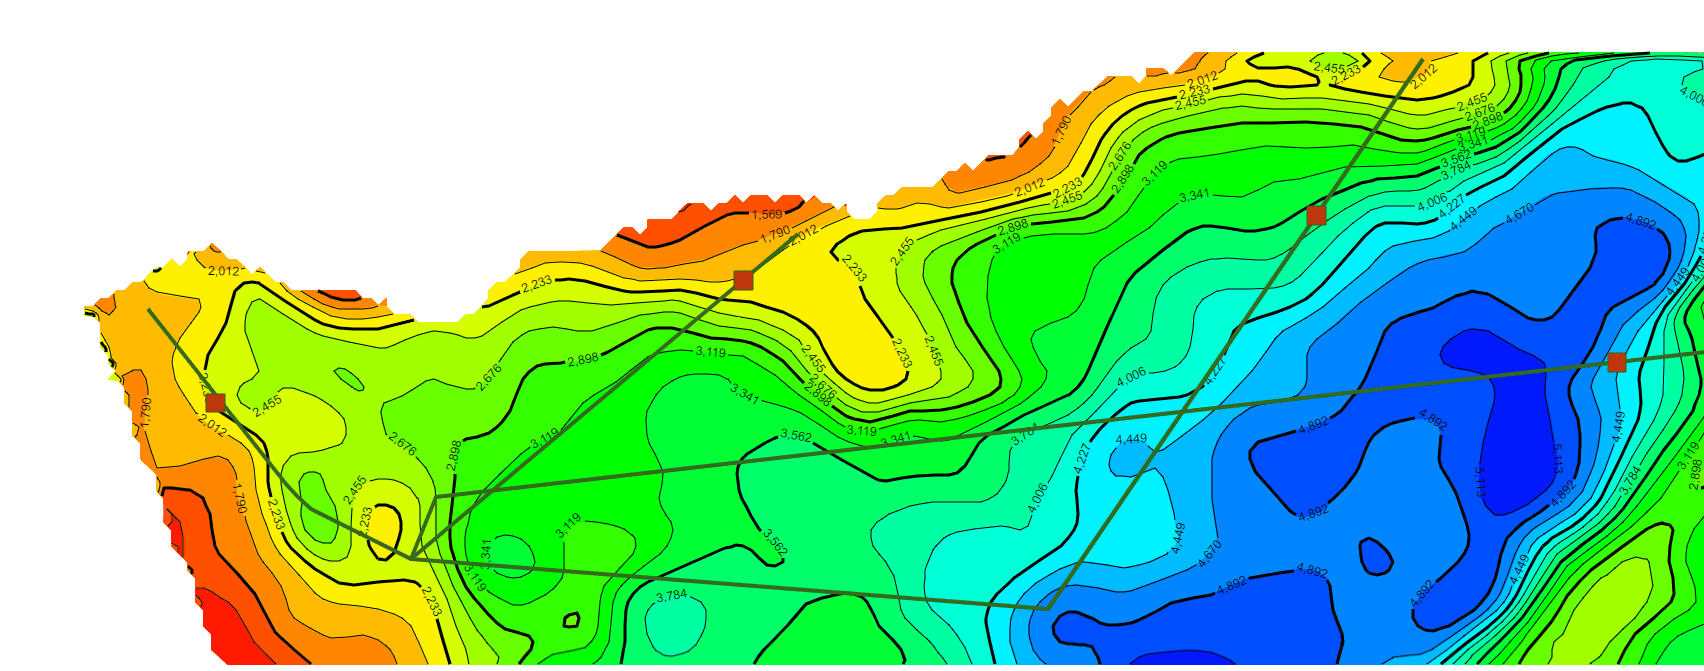
继续在上一篇文章的基础上,利用相同的数据处理方法统一了不同年代地层的数据格式(目前js解析支持的格式有ZMap、TS、XYZ和XYZA等),本文主要基于GeoToolKit/INT组件,针对地质研究经常在二维等值线基础上模拟计算地层中物体流动的模拟仿真可视化诉求,主要在ContourShape背景上,绘制矢量流线和SymbolShape的动画显示,最终实现了某个时期地层的物体流动的矢量流线动画效果,仿真油气的聚集过程的二维可视化,包括前端、后端设计等内容。详细效果如下。
1.前端设计与相关技术:主要采用VUE+JS+GeotoolKit.JS,充分利用VUE的组件化设计思想,以及GeotoolKit.JS的ContourShape、Polyline和SymbolShape组件结合实现。具体前端代码如下,示例效果详见第3部分。
vue组件
<script>
import {ContourPlot} from './vectorstreamline.js';
let contourPlot = null;
const SOURCE_DATA_FILE = 'src/demos/contour/contourplot/data/2018_T28.dat';
export default {
    name: 'ContourPlotDemo',
    components: {IntSnackbar, IntContourToolbar, IntPrintDialog, JsonForms},
    data: function () {
        return {
            showDismissibleAlert: false,
            showPrintDialog: false,
            propertiesDialogData: null,
            propertiesDialogActive: false,
            schema: null,
            uischema: Object.freeze(contourSchema),
            materialRenderers: Object.freeze(materialRenderers),
            ajv: null
        };
    },
    destroyed () {
        this._file = null;
        contourPlot.dispose();
        window.removeEventListener('resize', this.onResize);
    },
    updated () {
        if (!this.componentDidResize) {
            this.onResize();
            this.componentDidResize = true;
        }
    },
    mounted () {
        contourPlot = new ContourPlot({
            'host': this.$refs.host,
            'canvas': this.$refs.plot,
            'ondataload': this.onDataLoad,
            'onchangerubberband': this.onChangeRubberBand
        });
        this.setShowDismissibleAlert(false);
        this.setToolbarEnabled(false);
        this._file = this.$refs.file;
        this._file.addEventListener('change', this.onFileChange);
        contourPlot.loadDataSource(SOURCE_DATA_FILE);
        window.addEventListener('resize', this.onResize);
    },
    methods: {
        onResize () {
            contourPlot.resize();
            this.componentDidResize = false;
            this.$forceUpdate();
        },
        onChangeRubberBand (sender) {
            this.$refs.toolbar.setRubberBand(sender.isEnabled());
        },
        onFileChange (event) {
            this.setToolbarEnabled(true);
            contourPlot.loadFile(event.target)
                .then(this.setShowDismissibleAlert.bind(this, false))
                .catch(this.setShowDismissibleAlert.bind(this, true));
        },
        //绘制矢量流线动画效果
        vectorStreamline () {
            //console.log('in vectorStreamline');
            contourPlot.drawVectorStreamLine(this);
        }
}
</script>
基于二维等值线,用于解析绘制矢量线和动画的js组件(vectorstreamline.js),关于矢量流线数据的计算,后续我会专门写相应的内容分享相关方法。
import {ContourShape} from '@int/geotoolkit/contour/shapes/ContourShape';
import {Polyline} from "@int/geotoolkit/scene/shapes/Polyline";
import {Path} from '@int/geotoolkit/scene/shapes/Path';
import {KnownColors} from "@int/geotoolkit/util/ColorUtil";
import {SymbolShape} from "@int/geotoolkit/scene/shapes/SymbolShape";
import {AnchorType} from "@int/geotoolkit/util/AnchorType";
import {SquarePainter} from "@int/geotoolkit/scene/shapes/painters/SquarePainter";
import {AnimationFill} from "@int/geotoolkit/animation/AnimationFill";
const DEFAULT_CROSS_HAIR_COLOR = 'red';
export class ContourPlot {
    constructor (options) {
        TextMetrics.setCacheLimit(512);
        this._host = options.host;
        this._canvas = options.canvas;
        this._onDataLoad = options.ondataload;
        this._onChangeRB = options.onchangerubberband;
        this._contour = null;
        this._vectorstream=null;
        // Create model to hold the contour shape
        this._contourModel = new Group()
            .setVerticalFlip(true)
            .setCache(new ViewCache());
        // Initialize default properties
        this._numberOfLevels = 20;
        this._showFills = true;
        // Create annotated node model
        this._annotatedNodeModel = new Group()
            .setBounds(new Rect(0, 0, this._canvas.clientWidth, this._canvas.clientHeight))
            .addChild(this._contourModel)
            .setScaleScrollStrategy(new RestrictScaleStrategy({
                'minscale': 1E-3,
                'maxscale': 1E3
            }));
        this._layer = [];
    }
    //绘制矢量流线图动画
    drawVectorStreamLine(obj){
        console.log('drawVectorStreamLine');
        //删除上一次绘制的矢量流线和动画方块,注意,之前在哪里加上child,后续就在哪里removeChild。
        this._vectorstream=this._contour.getRoot();
        if(this._vectorstream.children.length>1){
            for(let i=this._vectorstream.children.length-1;i>0;i--){
                // console.log(i+'='+this._vectorstream.getChild(i));
                this._vectorstream.removeChild(this._vectorstream.getChild(i));
            }
        }
        //1.曲线1路径(曲线路径来自于矢量流线计算得到的数据)
        let pathX1=[280, 390, 400, 410, 490,510,1830];
        let pathY1=[280, 420, 430, 440, 480,430,280];
        const line=this.createLines(pathX1,pathY1);//构建曲线子对象1
        //2.曲线2路径(曲线路径来自于矢量流线计算得到的数据)
        pathX1=[800, 490,1000,1300];
        pathY1=[220, 480, 520,80];
        const line2=this.createLines(pathX1,pathY1);//构建曲线子对象2
        //3.运动方块1 路径(路径来自于曲线1路径)
        pathX1=[260, 390, 400, 410, 485];
        pathY1=[270, 420, 430, 440, 480];
        const rec =this.createRecRun(pathX1,pathY1);//构建运动方块子对象1
        //4.运动方块2 路径(路径来自于曲线2路径)
        let pathX2=[1830, 510,495];
        let pathY2=[280, 430,475];
        const rec2 =this.createRecRun(pathX2,pathY2);//构建运动方块子对象2
        //5.运动方块3 路径(路径来自于曲线1路径)
        pathX2=[800, 495];
        pathY2=[220, 480];
        const rec3 =this.createRecRun(pathX2,pathY2);//构建运动方块子对象3
        //6.运动方块4 路径(路径来自于曲线2路径)
        pathX2=[1300,1000, 495];
        pathY2=[80, 520,485];
        const rec4 =this.createRecRun(pathX2,pathY2);//构建运动方块子对象3
        //增加对象
        this._vectorstream.addChild(line);
        this._vectorstream.addChild(line2);
        this._vectorstream.addChild(rec);
        this._vectorstream.addChild(rec2);
        this._vectorstream.addChild(rec3);
        this._vectorstream.addChild(rec4);
    }
    //构建曲线
    createLines(pathlistX,pathlistY){
        //曲线方式(可以是Polyline,Path或Spline等
        const path = new Polyline({
        'x': pathlistX,//[38, 39, 40, 41, 48,51,53]
        'y': pathlistY,//[41, 42, 43, 44, 42,43,45]
        'linestyle': {
            'color': KnownColors.DarkGreen,
            'width': 4
        }
        });
        return path;
    }
    //构建动画方块
    createRecRun(pathlistX,pathlistY){
        const symbolShape=new SymbolShape(20, 15, 15, 15, AnchorType.Center, false, SquarePainter);
        symbolShape.setFillStyle(new FillStyle(KnownColors.DarkRed));
        symbolShape.setLineStyle(new LineStyle(KnownColors.DarkGreen, 1));
        //设置symbolShape动画的各种属性
        //屏幕横向:x(左小右大),纵向:y(下小上大)
        symbolShape.setAnimationStyle([
            {
                'attributeName': 'x',
                'duration': 2000,
                // 'repeatCount': Infinity,     //多次循环设置
                'fill':AnimationFill.Freeze,    //运行到最后位置冻结
                // 'function': Functions.NoEasing,
                'values':pathlistX
             },
             {
                'attributeName': 'y',
                'duration': 2000,
                 // 'repeatCount': Infinity,
                 // 'function': Functions.NoEasing,
                'fill':AnimationFill.Freeze,
                'values': pathlistY
            }
        ]);
      return symbolShape;
}
}2.后端设计与相关技术:主要采用NodeJS的微服务接口实现。为了便于js解析地层和矢量流数据。代码详见上一篇文章,后端代码、服务方式和调用方式和数据文件格式类似。
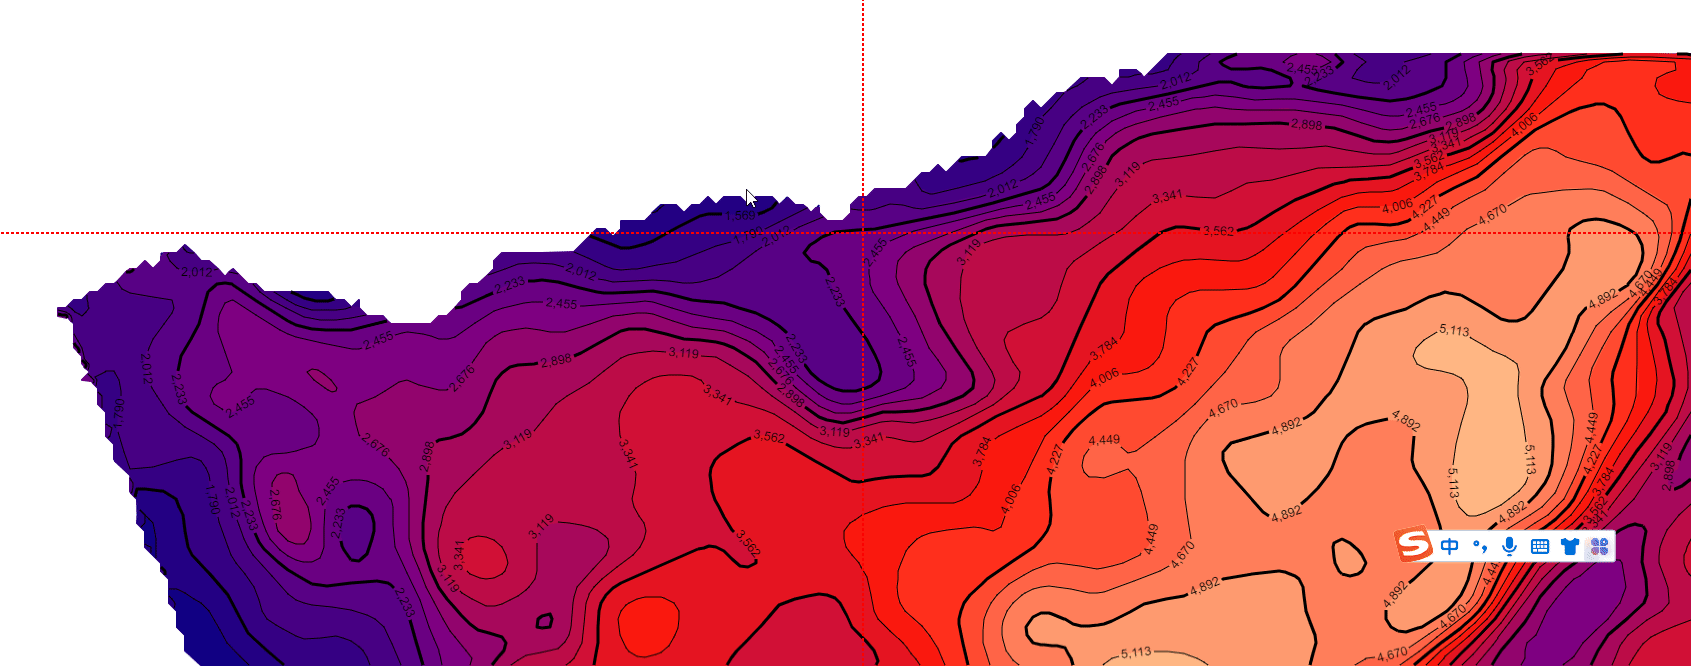
3.矢量流线和动画显示示例效果(不同色标)