作者水平低,如有错误,恳请指正!谢谢!!!!!
项目简单,适合大学生参考
分类专栏还有其它的可视化博客哦!
专栏地址:https://blog.csdn.net/qq_55906442/category_11906804.html?spm=1001.2014.3001.5482
目录
一、数据源
二、所需工具
三、项目框架搭建
四、代码编写
订单金额折线图
利润情况信息
虚拟柱状图
平均支付时间统计
订单金额统计
旭日图
五、大屏编写
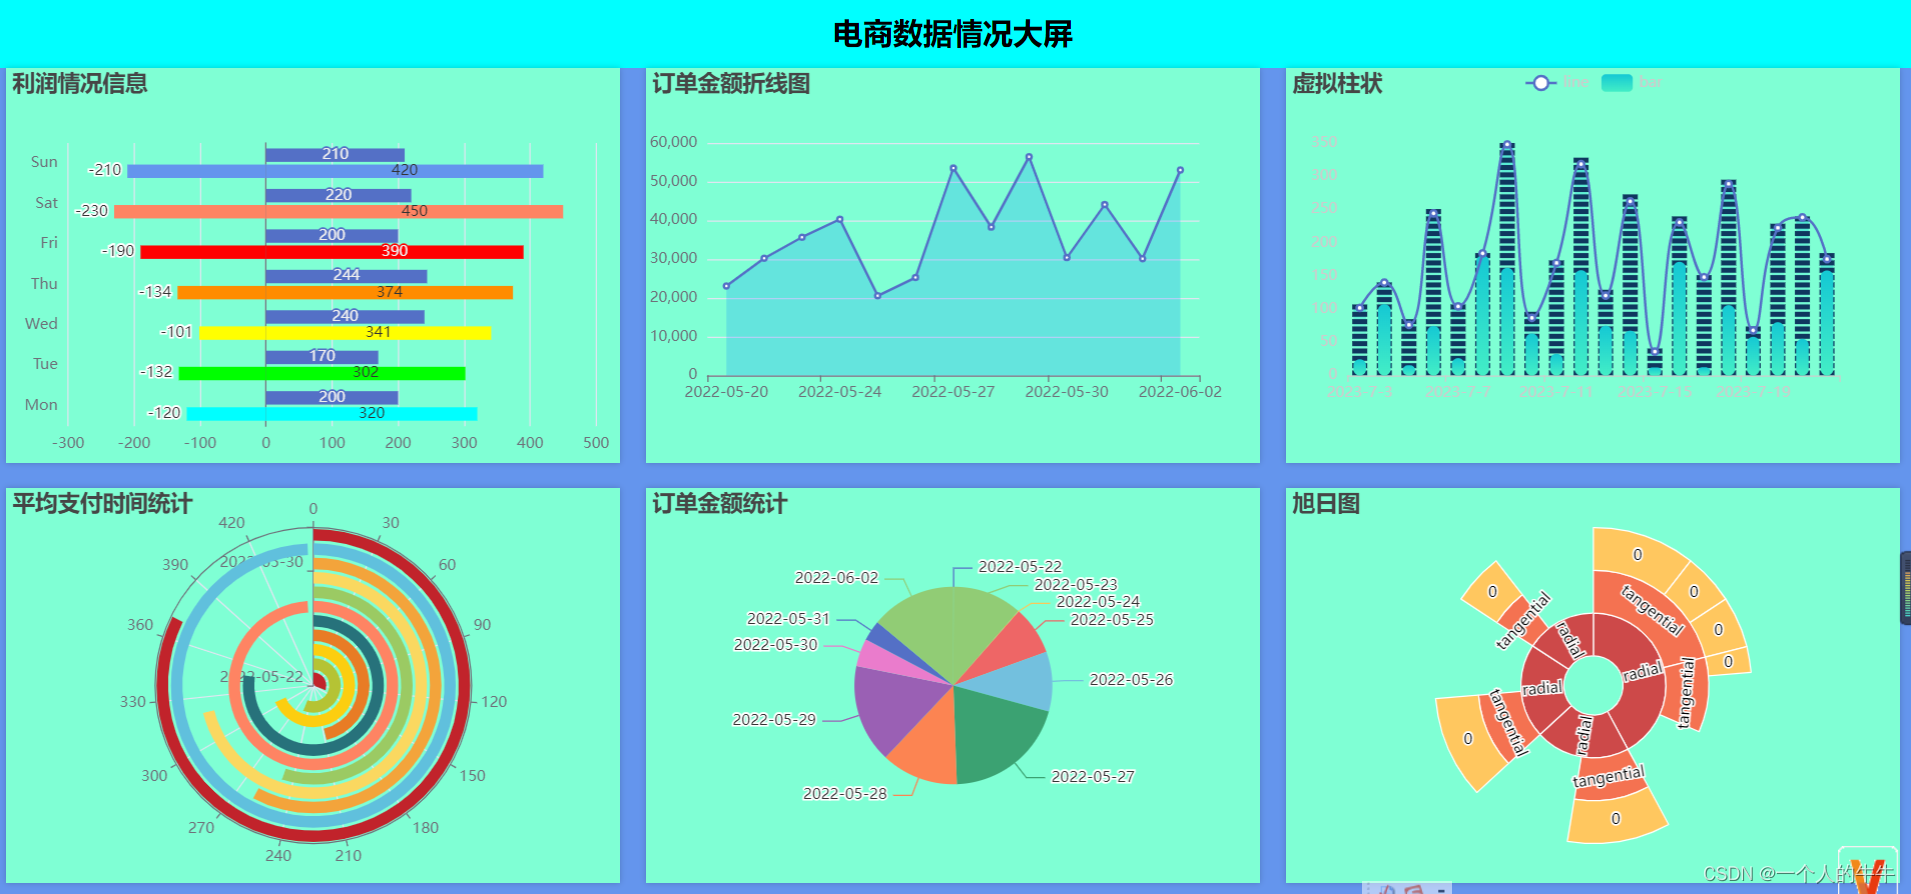
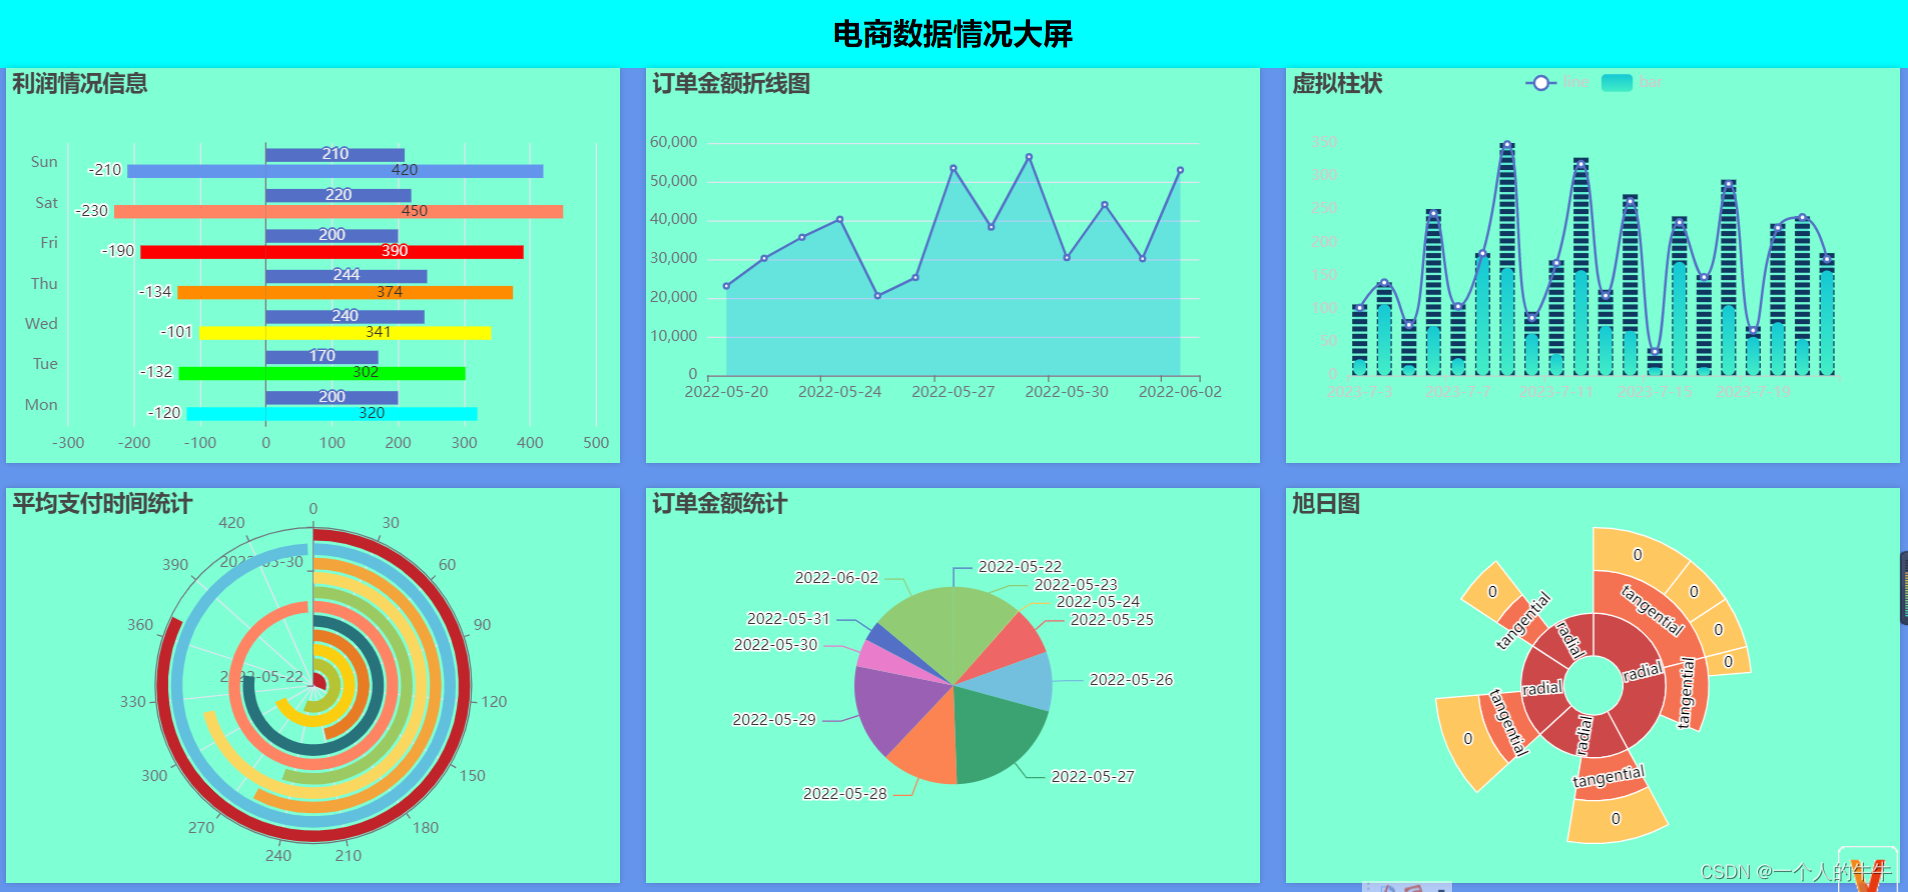
成果展示:
一、数据源
1)可以使用自己的MySQL数据库;
2)使用我提供的数据。(要数据私信/留言——>留下邮箱即可)
二、所需工具
MySQL、IDEA、jdk1.8、Maven等等,总之编写工具要准备好,环境要搭建好
三、项目框架搭建
参考我博客的项目框架搭建,从3.1看到4.3即可springboot+mybatis+echarts +mysql制作数据可视化大屏_spring + 可视化大屏_一个人的牛牛的博客-CSDN博客
四、代码编写
代码简单,后端代码都写在一起了,没有区分controller等等,前端也是一样,没有单独写js等等。有些图数据为了偷懒是手敲的,没有从数据库读取。
订单金额折线图
后端
import org.springframework.beans.factory.annotation.Autowired;
import org.springframework.jdbc.core.JdbcTemplate;
import org.springframework.web.bind.annotation.GetMapping;
import org.springframework.web.bind.annotation.RestController;

import java.util.ArrayList;
import java.util.HashMap;
import java.util.List;
import java.util.Map;

@RestController
public class Big2Controller {

    private final JdbcTemplate jdbcTemplate;

    @Autowired
    public Big2Controller(JdbcTemplate jdbcTemplate) {
        this.jdbcTemplate = jdbcTemplate;
    }

    @GetMapping("/chart-data2")
    public Map<String, Object> getChartData() {
        String query = "SELECT dt, order_amount FROM ads_order_daycount";
        List<Map<String, Object>> result = jdbcTemplate.queryForList(query);

        List<String> labels = new ArrayList<>();
        List<Integer> values = new ArrayList<>();

        for (Map<String, Object> row : result) {
            String dt = row.get("dt").toString();
            Integer orderAmount = ((Number) row.get("order_amount")).intValue();

            labels.add(dt);
            values.add(orderAmount);
        }

        Map<String, Object> data = new HashMap<>();
        data.put("labels", labels);
        data.put("values", values);

        return data;
    }
}
验证接口:运行项目,浏览器访问http://localhost:8081/chart-data2
前端
<!DOCTYPE html>
<html>
<head>
  <meta charset="UTF-8">
  <title>折线图</title>
  <style>
    html, body {
      height: 100%;
      margin: 0;
      padding: 0;
    }
    #chart-container {
      width: 100%;
      height: 100%;
      min-height: 300px; /* 设置最小高度,防止内容过小时显示异常 */
    }
  </style>
</head>
<body>
<div id="chart-container"></div>

<script src="https://cdn.jsdelivr.net/npm/echarts@5.2.2/dist/echarts.min.js"></script>
<script src="https://code.jquery.com/jquery-3.6.0.min.js"></script>
<script src="https://cdn.jsdelivr.net/npm/axios/dist/axios.min.js"></script>
<script>
  // 使用 Axios 发送 AJAX 请求
  axios.get('/chart-data2')
          .then(function (response) {
            // 处理从后端返回的数据
            const data = response.data;

            // 提取 X 轴和 Y 轴数据
            const xData = data.labels;
            const yData = data.values;

            // 创建图表
            const chartContainer = document.getElementById('chart-container');
            const chart = echarts.init(chartContainer);

            // 监听窗口大小变化事件
            window.addEventListener('resize', function() {
              chart.resize(); // 调整图表大小
            });

            const option = {
              title: {
                text: '订单金额折线图'
              },
              xAxis: {
                type: 'category',
                data: xData
              },
              yAxis: {
                type: 'value'
              },
              series: [{
                type: 'line',
                data: yData,
                areaStyle: {
                  color: 'rgba(0, 128, 255, 0.3)' // 设置背景颜色
                }
              }]
            };

            // 渲染图表
            chart.setOption(option);

          })
          .catch(function (error) {
            console.log(error);
          });
</script>
</body>
</html>
验证页面:运行项目,浏览器访问http://localhost:8081/big2.html
利润情况信息
前端
<!DOCTYPE html>
<html>
<head>
    <meta charset="utf-8">
    <title>利润情况信息</title>
    <!-- 引入 echarts.js -->
    <script src="/js/echarts.min.js"></script>
    <script src="/js/jquery-3.5.1.min.js"></script>
    <style>
        html, body {
            height: 100%;
            margin: 0;
            padding: 0;
        }
        #main {
            width: 100%;
            height: 100%;
            min-height: 300px; /* 设置最小高度,防止内容过小时显示异常 */
        }
    </style>
</head>
<body>
<!-- 为ECharts准备一个具备大小(宽高)的Dom -->
<div id="main"></div>
<script type="text/javascript">
    var chartDom = document.getElementById('main');
    var myChart = echarts.init(chartDom);
    var option;

    // 监听窗口大小变化事件
    window.addEventListener('resize', function() {
        myChart.resize(); // 调整图表大小
    });

    option = {
        title: {
            text: '利润情况信息',
            textStyle: {
                textAlign: 'center'
            }
        },
        tooltip: {
            trigger: 'axis',
            axisPointer: {
                type: 'shadow'
            }
        },
        legend: {
            data: ['利润', '费用', '收入']
        },
        grid: {
            left: '3%',
            right: '4%',
            bottom: '3%',
            containLabel: true
        },
        xAxis: [
            {
                type: 'value'
            }
        ],
        yAxis: [
            {
                type: 'category',
                axisTick: {
                    show: false
                },
                data: ['Mon', 'Tue', 'Wed', 'Thu', 'Fri', 'Sat', 'Sun']
            }
        ],
        series: [
            {
                name: 'Profit',
                type: 'bar',
                label: {
                    show: true,
                    position: 'inside'
                },
                emphasis: {
                    focus: 'series'
                },
                data: [200, 170, 240, 244, 200, 220, 210]
            },
            {
                name: 'Income',
                type: 'bar',
                stack: 'Total',
                label: {
                    show: true
                },
                emphasis: {
                    focus: 'series'
                },
                itemStyle: {
                    emphasis: {
                        shadowBlur: 10,
                        shadowOffsetX: 0,
                        shadowColor: 'rgba(0, 0, 0, 0.5)'
                    },
                    normal:{
                        color:function(params) {
                            //自定义颜色
                            var colorList = ['#00FFFF', '#00FF00', '#FFFF00', '#FF8C00', '#FF0000', '#FE8463','#6495ed','#ff69b4','#00FFFF', '#00FF00', '#FFFF00', '#FF8C00', '#FF0000', '#FE8463','#6495ed','#ff69b4'];
                            return colorList[params.dataIndex]
                        }
                    }
                },
                data: [320, 302, 341, 374, 390, 450, 420]
            },
            {
                name: 'Expenses',
                type: 'bar',
                stack: 'Total',
                label: {
                    show: true,
                    position: 'left'
                },
                emphasis: {
                    focus: 'series'
                },
                itemStyle: {
                    emphasis: {
                        shadowBlur: 10,
                        shadowOffsetX: 0,
                        shadowColor: 'rgba(0, 0, 0, 0.5)'
                    },
                    normal:{
                        color:function(params) {
                            //自定义颜色
                            var colorList = ['#00FFFF', '#00FF00', '#FFFF00', '#FF8C00', '#FF0000', '#FE8463','#6495ed','#ff69b4','#00FFFF', '#00FF00', '#FFFF00', '#FF8C00', '#FF0000', '#FE8463','#6495ed','#ff69b4'];
                            return colorList[params.dataIndex]
                        }
                    }
                },
                data: [-120, -132, -101, -134, -190, -230, -210]
            }
        ]
    };

    option && myChart.setOption(option);

</script>
</body>
验证页面:运行项目,浏览器访问http://localhost:8081/negative.html
虚拟柱状图
前端
<!DOCTYPE html>
<html>
<head>
    <meta charset="utf-8">
    <title>虚拟柱状图</title>
    <script src="/js/echarts.min.js"></script>
    <script src="/js/jquery-3.5.1.min.js"></script>
    <style>
        html, body {
            height: 100%;
            margin: 0;
            padding: 0;
        }
        #main {
            width: 100%;
            height: 100%;
            min-height: 300px; /* 设置最小高度,防止内容过小时显示异常 */
        }
    </style>
</head>
<body>
<div id="main"></div>
<script type="text/javascript">
    var chartDom = document.getElementById('main');
    var myChart = echarts.init(chartDom);
    var option;

    // 监听窗口大小变化事件
    window.addEventListener('resize', function() {
        myChart.resize(); // 调整图表大小
    });

    // Generate data
    let category = [];
    let dottedBase = +new Date();
    let lineData = [];
    let barData = [];
    for (let i = 0; i < 20; i++) {
        let date = new Date((dottedBase += 3600 * 24 * 1000));
        category.push(
            [date.getFullYear(), date.getMonth() + 1, date.getDate()].join('-')
        );
        let b = Math.random() * 200;
        let d = Math.random() * 200;
        barData.push(b);
        lineData.push(d + b);
    }
    // option
    option = {
        title: {
            text: '虚拟柱状',
            textStyle: {
                textAlign: 'center'
            }
        },
        backgroundColor: '',
        tooltip: {
            trigger: 'axis',
            axisPointer: {
                type: 'shadow'
            }
        },
        legend: {
            data: ['line', 'bar'],
            textStyle: {
                color: '#ccc'
            }
        },
        xAxis: {
            data: category,
            axisLine: {
                lineStyle: {
                    color: '#ccc'
                }
            }
        },
        yAxis: {
            splitLine: { show: false },
            axisLine: {
                lineStyle: {
                    color: '#ccc'
                }
            }
        },
        series: [
            {
                name: 'line',
                type: 'line',
                smooth: true,
                showAllSymbol: true,
                symbol: 'emptyCircle',
                symbolSize: 5,
                data: lineData
            },
            {
                name: 'bar',
                type: 'bar',
                barWidth: 10,
                itemStyle: {
                    borderRadius: 5,
                    color: new echarts.graphic.LinearGradient(0, 0, 0, 1, [
                        { offset: 0, color: '#14c8d4' },
                        { offset: 1, color: '#43eec6' }
                    ])
                },
                data: barData
            },
            {
                name: 'line',
                type: 'bar',
                barGap: '-100%',
                barWidth: 10,
                itemStyle: {
                    color: new echarts.graphic.LinearGradient(0, 0, 0, 1, [
                        { offset: 0, color: 'rgba(20,200,212,0.5)' },
                        { offset: 0.2, color: 'rgba(20,200,212,0.2)' },
                        { offset: 1, color: 'rgba(20,200,212,0)' }
                    ])
                },
                z: -12,
                data: lineData
            },
            {
                name: 'dotted',
                type: 'pictorialBar',
                symbol: 'rect',
                itemStyle: {
                    color: '#0f375f'
                },
                symbolRepeat: true,
                symbolSize: [12, 4],
                symbolMargin: 1,
                z: -10,
                data: lineData
            }
        ]
    };

    option && myChart.setOption(option);

</script>
</body>
验证页面:运行项目,浏览器访问http://localhost:8081/histogram.html
平均支付时间统计
后端
import org.springframework.beans.factory.annotation.Autowired;
import org.springframework.jdbc.core.JdbcTemplate;
import org.springframework.web.bind.annotation.GetMapping;
import org.springframework.web.bind.annotation.RestController;

import java.util.ArrayList;
import java.util.HashMap;
import java.util.List;
import java.util.Map;

@RestController
public class Big3Controller {

    private final JdbcTemplate jdbcTemplate;

    @Autowired
    public Big3Controller(JdbcTemplate jdbcTemplate) {
        this.jdbcTemplate = jdbcTemplate;
    }

    @GetMapping("/chart-data3")
    public Map<String, Object> getChartData() {
        String query = "SELECT dt, payment_avg_time FROM ads_payment_daycount";
        List<Map<String, Object>> result = jdbcTemplate.queryForList(query);

        List<String> labels = new ArrayList<>();
        List<Integer> values = new ArrayList<>();

        for (Map<String, Object> row : result) {
            String dt = row.get("dt").toString();
            Integer paymentAvgTime = ((Number) row.get("payment_avg_time")).intValue();

            labels.add(dt);
            values.add(paymentAvgTime);
        }

        Map<String, Object> data = new HashMap<>();
        data.put("labels", labels);
        data.put("values", values);

        return data;
    }
}
验证接口:运行项目,浏览器访问http://localhost:8081/chart-data3
前端
<!DOCTYPE html>
<html>
<head>
  <title>平均支付时间统计</title>
  <meta charset="UTF-8">
  <script src="https://cdn.jsdelivr.net/npm/echarts@5.2.2/dist/echarts.min.js"></script>
  <script src="https://code.jquery.com/jquery-3.6.0.min.js"></script>
  <style>
    html, body {
      height: 100%;
      margin: 0;
      padding: 0;
    }
    #chart {
      width: 100%;
      height: 100%;
      min-height: 300px; /* 设置最小高度,防止内容过小时显示异常 */
    }
  </style>
</head>
<body>
<div id="chart"></div>
<script type="text/javascript">
  var chart = echarts.init(document.getElementById('chart'));

  // 监听窗口大小变化事件
  window.addEventListener('resize', function() {
    chart.resize(); // 调整图表大小
  });

  // 使用Ajax异步获取数据
  $.ajax({
    url: '/chart-data3',
    type: 'GET',
    dataType: 'json',
    success: function(data) {
      var option = {
        title: {
          text: '平均支付时间统计',
          textStyle: {
            textAlign: 'center'
          }
        },
        tooltip: {},
        angleAxis: {},
        radiusAxis: {
          type: 'category',
          data: data.labels
        },
        polar: {},
        series: [{
          name: 'Avg Time',
          type: 'bar',
          data: data.values,
          coordinateSystem: 'polar',
          itemStyle: {
            color: function(params) {
              // 设置背景颜色
              var colorList = ['#C1232B', '#B5C334', '#FCCE10', '#E87C25', '#27727B', '#FE8463', '#9BCA63', '#FAD860', '#F3A43B', '#60C0DD'];
              return colorList[params.dataIndex % colorList.length];
            }
          }
        }]
      };
      chart.setOption(option);
    }
  });
</script>
</body>
</html>验证页面:运行项目,浏览器访问http://localhost:8081/big3.html
订单金额统计
后端
import org.springframework.beans.factory.annotation.Autowired;
import org.springframework.jdbc.core.JdbcTemplate;
import org.springframework.web.bind.annotation.GetMapping;
import org.springframework.web.bind.annotation.RestController;

import java.util.ArrayList;
import java.util.HashMap;
import java.util.List;
import java.util.Map;

@RestController
public class Big4Controller {

    private final JdbcTemplate jdbcTemplate;

    @Autowired
    public Big4Controller(JdbcTemplate jdbcTemplate) {
        this.jdbcTemplate = jdbcTemplate;
    }

    @GetMapping("/chart-data4")
    public Map<String, Object> getChartData() {
        String query = "SELECT dt, order_amount FROM ads_payment_daycount";
        List<Map<String, Object>> result = jdbcTemplate.queryForList(query);

        List<String> labels = new ArrayList<>();
        List<Integer> values = new ArrayList<>();

        for (Map<String, Object> row : result) {
            String dt = row.get("dt").toString();
            Integer orderAmount = ((Number) row.get("order_amount")).intValue();

            labels.add(dt);
            values.add(orderAmount);
        }

        Map<String, Object> data = new HashMap<>();
        data.put("labels", labels);
        data.put("values", values);

        return data;
    }
}验证接口:运行项目,浏览器访问http://localhost:8081/chart-data4
前端
<!DOCTYPE html>
<html>
<head>
  <title>订单金额统计</title>
  <meta charset="UTF-8">
  <script src="https://cdn.jsdelivr.net/npm/echarts@5.2.2/dist/echarts.min.js"></script>
  <script src="https://code.jquery.com/jquery-3.6.0.min.js"></script>
  <style>
    html, body {
      height: 100%;
      margin: 0;
      padding: 0;
    }
    #chart {
      width: 100%;
      height: 100%;
      min-height: 300px;
    }
  </style>
</head>
<body>
<div id="chart"></div>
<script type="text/javascript">
  var chart = echarts.init(document.getElementById('chart'));

  // 监听窗口大小变化事件
  window.addEventListener('resize', function() {
    chart.resize(); // 调整图表大小
  });

  // 使用Ajax异步获取数据
  $.ajax({
    url: '/chart-data4',
    type: 'GET',
    dataType: 'json',
    success: function(data) {
      var option = {
        title: {
          text: '订单金额统计',
          textStyle: {
            textAlign: 'center'
          }
        },
        tooltip: {
          trigger: 'item',
          formatter: '{b}: {c} ({d}%)'
        },
        series: [{
          name: '订单金额',
          type: 'pie',
          radius: '50%',
          data: data.values.map(function(value, index) {
            return {
              name: data.labels[index],
              value: value
            };
          })
        }]
      };
      chart.setOption(option);
    }
  });
</script>
</body>
</html>验证页面:运行项目,浏览器访问http://localhost:8081/big4.html
旭日图
前端
<!DOCTYPE html>
<html>
<head>
  <meta charset="utf-8">
  <title>旭日图</title>
  <!-- 引入 echarts.js 和 jQuery(CDN引用) -->
  <script src="https://cdn.jsdelivr.net/npm/echarts@5.2.2/dist/echarts.min.js"></script>
  <script src="https://code.jquery.com/jquery-3.6.0.min.js"></script>
  <style>
    html, body {
      height: 100%;
      margin: 0;
      padding: 0;
    }
    #main {
      width: 100%;
      height: 100%;
      min-height: 300px; /* 设置最小高度,防止内容过小时显示异常 */
    }
  </style>
</head>
<body>
<!-- 为ECharts准备一个具备大小(宽高)的Dom -->
<div id="main"></div>
<script type="text/javascript">

  var chartDom = document.getElementById('main');
  var myChart = echarts.init(chartDom);
  var option;

  option = {
    title: {
      text: '旭日图',
      textStyle: {
        textAlign: 'center'
      }
    },
    silent: true,
    series: [
      {
        radius: ['15%', '80%'],
        type: 'sunburst',
        sort: undefined,
        emphasis: {
          focus: 'ancestor'
        },
        data: [
          {
            value: 8,
            children: [
              {
                value: 4,
                children: [
                  {
                    value: 2
                  },
                  {
                    value: 1
                  },
                  {
                    value: 1
                  },
                  {
                    value: 0.5
                  }
                ]
              },
              {
                value: 2
              }
            ]
          },
          {
            value: 4,
            children: [
              {
                children: [
                  {
                    value: 2
                  }
                ]
              }
            ]
          },
          {
            value: 4,
            children: [
              {
                children: [
                  {
                    value: 2
                  }
                ]
              }
            ]
          },
          {
            value: 3,
            children: [
              {
                children: [
                  {
                    value: 1
                  }
                ]
              }
            ]
          }
        ],
        label: {
          color: '#000',
          textBorderColor: '#fff',
          textBorderWidth: 2,
          formatter: function (param) {
            var depth = param.treePathInfo.length;
            if (depth === 2) {
              return 'radial';
            } else if (depth === 3) {
              return 'tangential';
            } else if (depth === 4) {
              return '0';
            }
            return '';
          }
        },
        levels: [
          {},
          {
            itemStyle: {
              color: '#CD4949'
            },
            label: {
              rotate: 'radial'
            }
          },
          {
            itemStyle: {
              color: '#F47251'
            },
            label: {
              rotate: 'tangential'
            }
          },
          {
            itemStyle: {
              color: '#FFC75F'
            },
            label: {
              rotate: 0
            }
          }
        ]
      }
    ]
  };

  option && myChart.setOption(option);

</script>
</body>
</html>
五、大屏编写
前端
<!DOCTYPE html>
<html>
<head>
    <meta charset="UTF-8">
    <title>大屏可视化6</title>
    <style>
        /* CSS样式 */
        body, html {
            height: 100%;
            margin: 0;
            padding: 0;
            background-color: cornflowerblue;
        }
        #header {
            width: 100%;
            height: 8%;
            display: flex;
            justify-content: center;
            align-items: center;
            background-color: cyan;
            font-size: 24px;
            font-weight: bold;
        }
        #content {
            width: 100%;
            height: 90%;
            display: flex;
            flex-wrap: wrap;
            justify-content: space-around;
            align-items: center;
        }
        .chart-container {
            width: 32%;
            height: 48%;
            background-color: aquamarine;
            margin-bottom: 20px;
            box-shadow: 0px 0px 5px rgba(0, 0, 0, 0.2);
        }
    </style>
</head>
<body>
    <div id="header">电商数据情况大屏</div>

    <div id="content">
        <div class="chart-container" id="chart1">
            <iframe src="negative.html" style="width: 100%; height: 100%; border: none;"></iframe>
        </div>
        <div class="chart-container" id="chart2">
            <iframe src="big2.html" style="width: 100%; height: 100%; border: none;"></iframe>
        </div>
        <div class="chart-container" id="chart3">
            <iframe src="histogram.html" style="width: 100%; height: 100%; border: none;"></iframe>
        </div>
        <div class="chart-container" id="chart4">
            <iframe src="big3.html" style="width: 100%; height: 100%; border: none;"></iframe>
        </div>
        <div class="chart-container" id="chart5">
            <iframe src="big4.html" style="width: 100%; height: 100%; border: none;"></iframe>
        </div>
        <div class="chart-container" id="chart6">
            <iframe src="yun.html" style="width: 100%; height: 100%; border: none;"></iframe>
        </div>
    </div>

    <script src="https://cdn.jsdelivr.net/npm/d3@7.0.0/dist/d3.min.js"></script>
    <script>
    </script>
</body>
</html>运行项目,浏览器访问http://localhost:8081/yun.html
注:http://localhost:8080/加上HTML的文件名都能够查看相应的图!
要码源的私聊/评论留下邮箱号,压缩包包括项目源码、数据sql文件,readme.txt。
声明:作品仅可作学习使用。