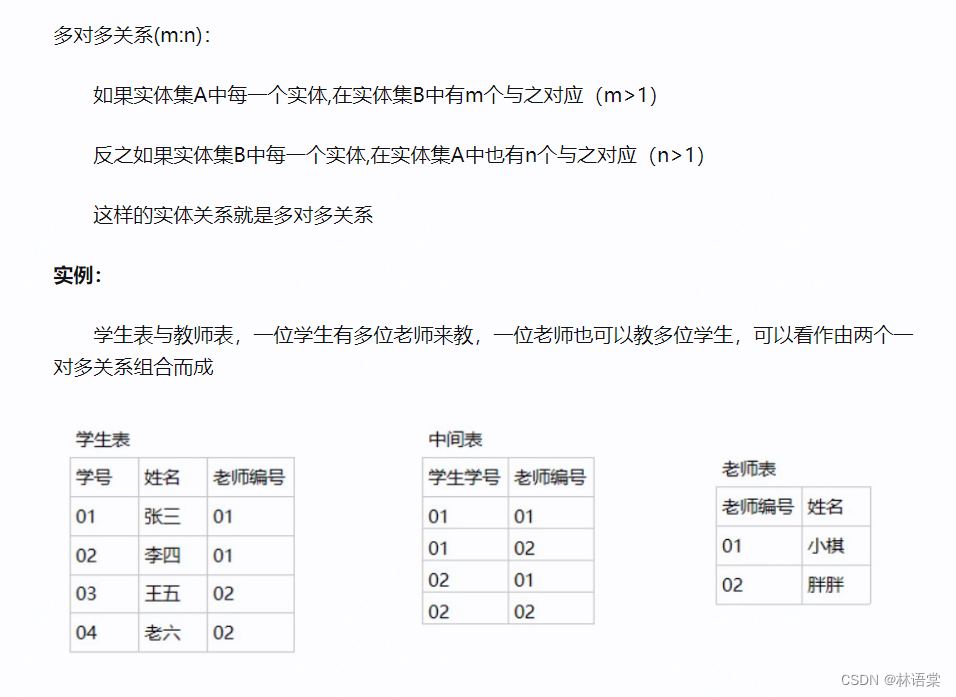
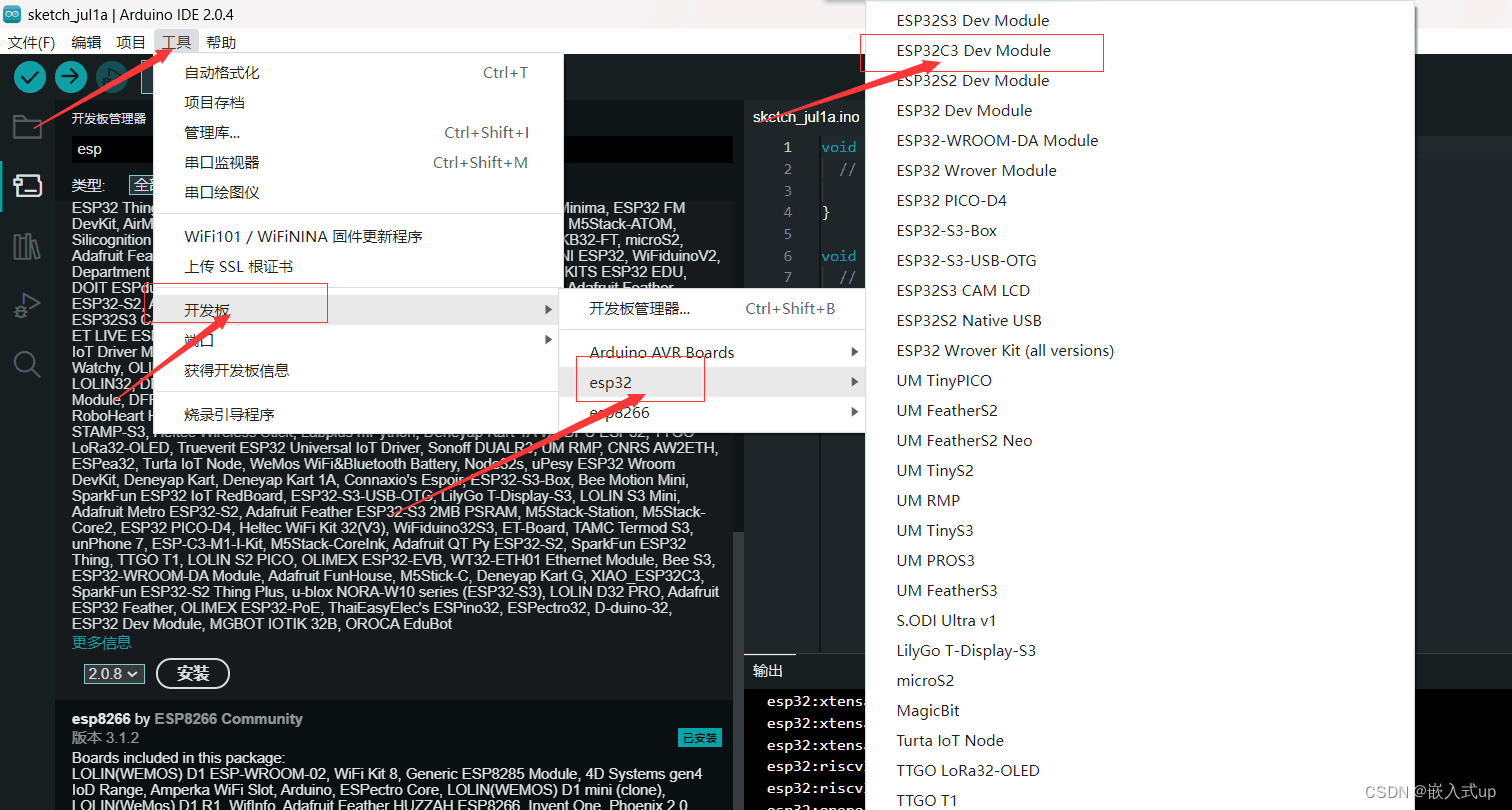
vue+leaflet笔记之地图网格
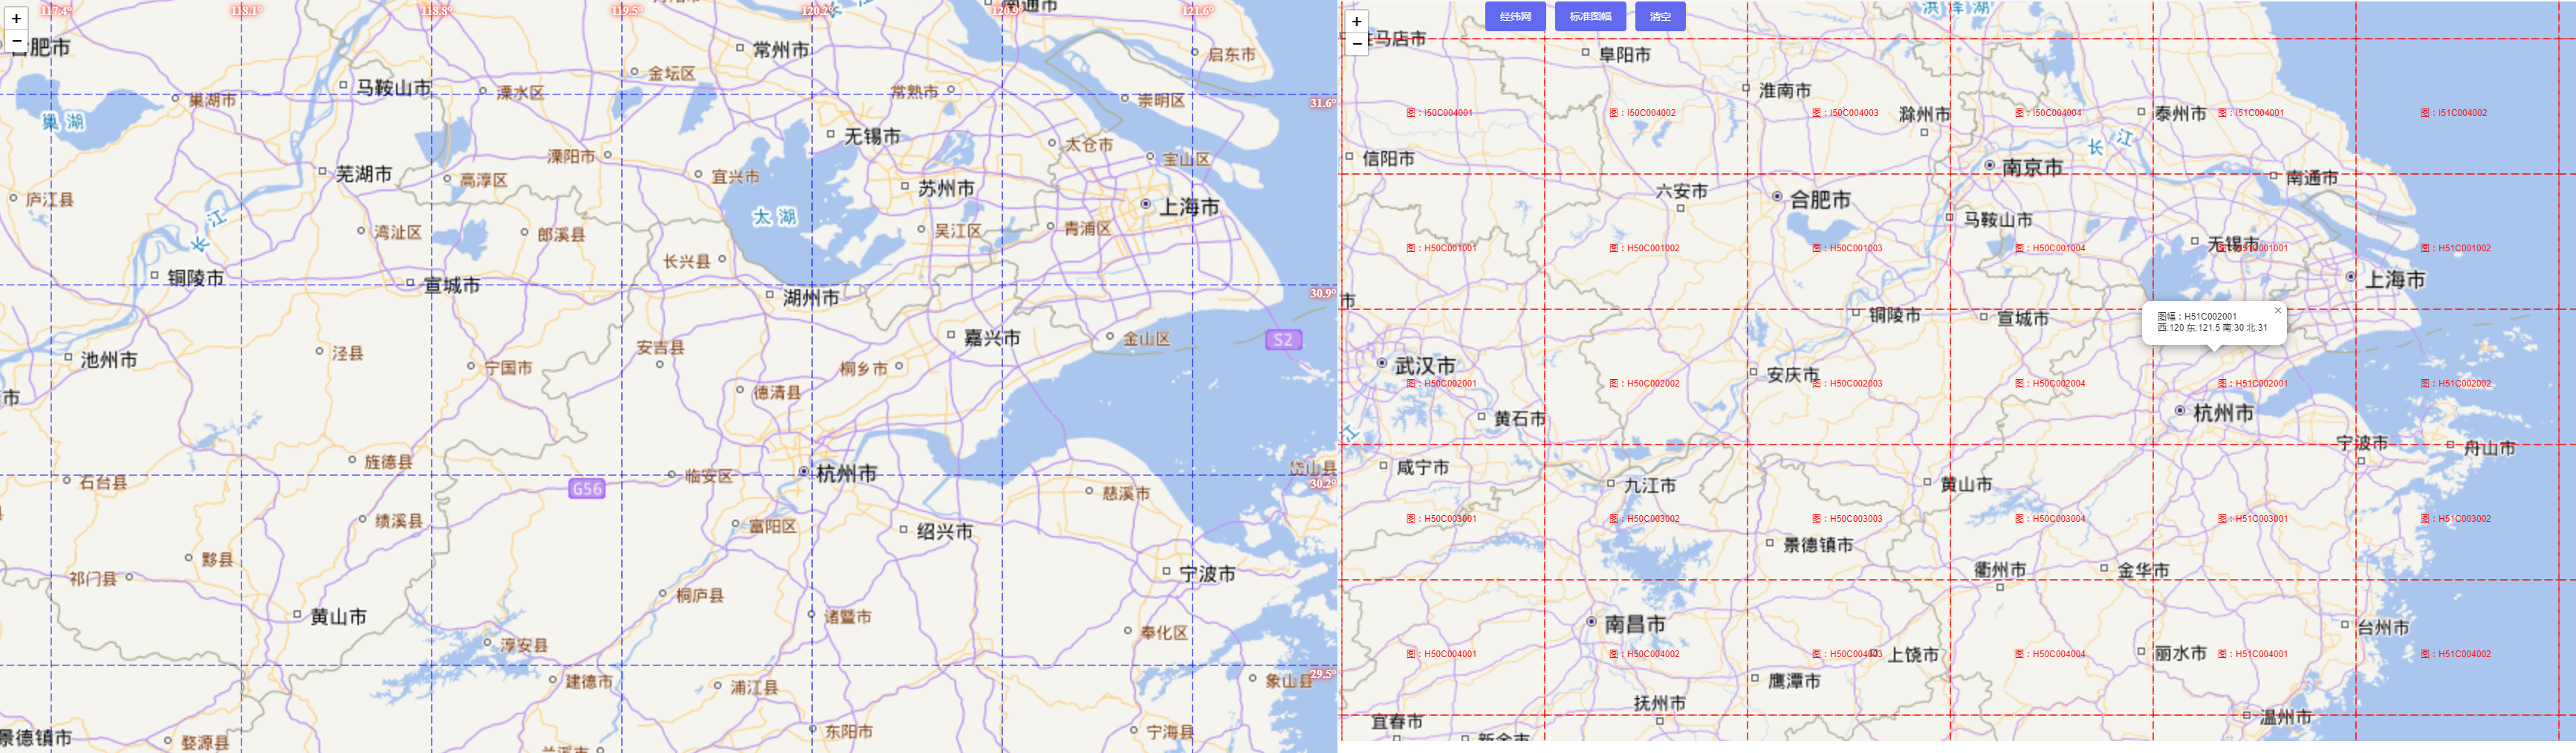
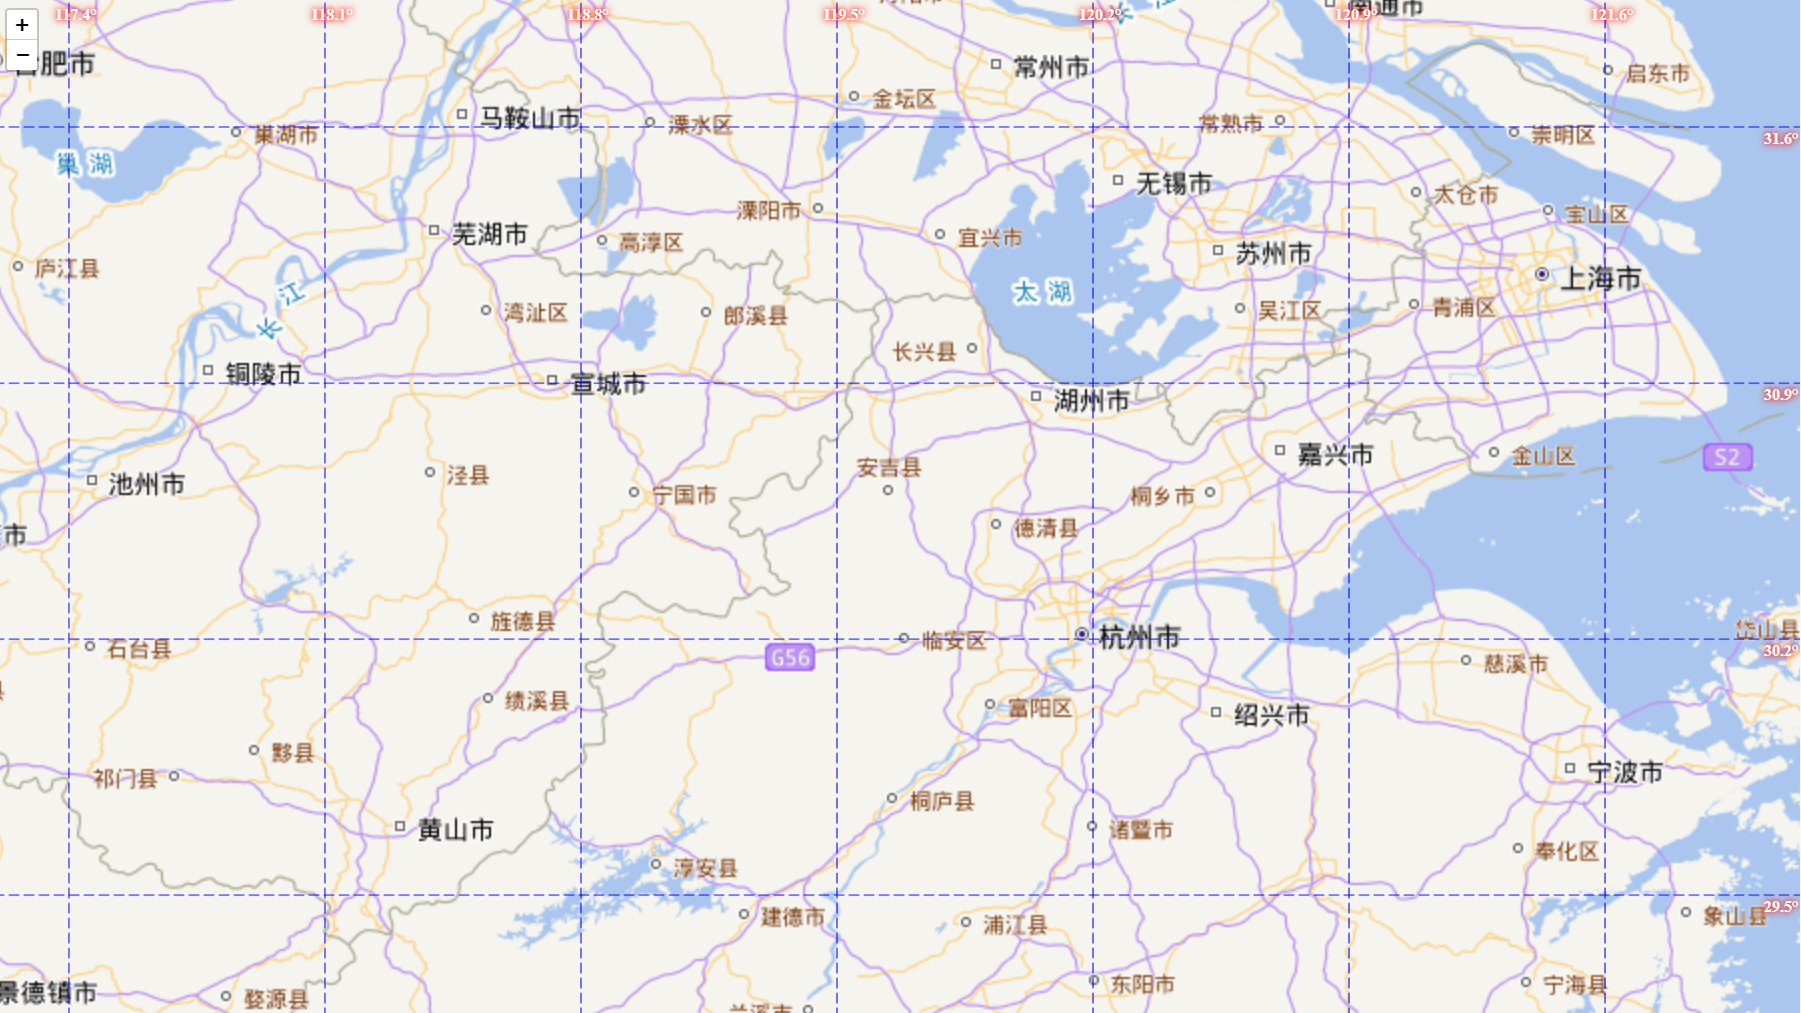
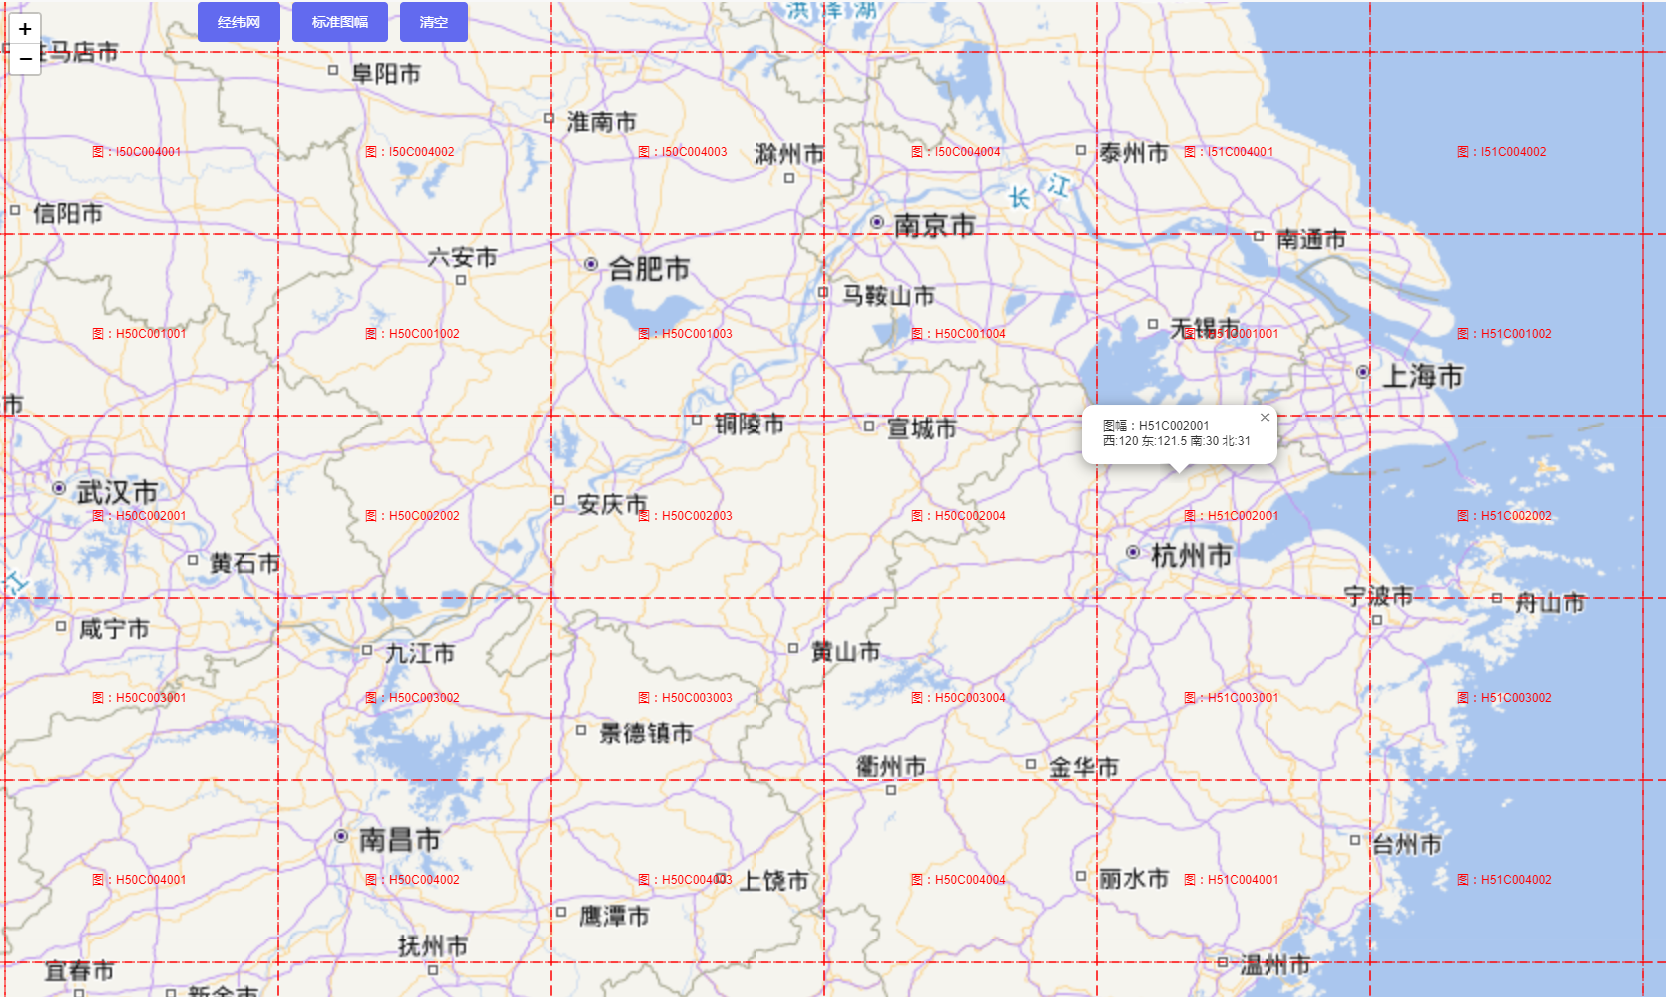
本文介绍了Web端使用Leaflet开发库显示地图经纬网和标准图幅网格的方法 (底图来源:天地图), 地图格网是由间隔均匀的横向线和纵向线组成的网络,用于在地图上识别各个位置。 经纬网通过在地图上描绘纬度和经度格网,用于表示地图的地理坐标;标准图幅网格通过在地图上展示不同比例尺下的网格图幅号与点击查询地图范围,用于描绘地图的位置、比例尺等信息,示例效果如下图所示。
开发环境
Vue开发库:3.2.37 & Leaflet开发库:1.9.3
主要插件:turf
使用教程
实现方式
首先,获取到当前地图map,通过map.getBounds() 、map.getZoom()获取到当前地图范围和当前地图缩放级别 ,利用地图范围和缩放级别按照对应的规则进行计算,生成地图经纬网或标准图幅网格要素,然后添加到图层组(地图)中。
核心代码
经纬网
经纬网是由表示地球东西位置的经线和表示地球南北位置的子午线构成,由于大家日常接触较多,这里不再赘述。
效果图
核心代码
// 获取当前地图缩放级别
let zoom = map.getZoom();
if (zoom > 2 || zoom < 20) {
    let bounds = map.getBounds(); // 获取到当前地图范围
    let north = bounds.getNorth(); // 当前视口最北点经度
    let east = bounds.getEast(); // 当前视口最东点纬度
    // 经线网格
    for (let index = -180; index <= 360; index += degree) {
        // 判断是否在当前视野内
        if (bounds.contains([north, index])) {
            // 绘制经线
            let lonLine = L.polyline([[-90, index], [90, index],],
                                     { weight: 1, dashArray: '10, 5', color: gridLineLatLng.color } // 线样式
                                    );
            // 添加到图层组中
            gridLineLatLng.currentFeatureLayerGroup.addLayer(lonLine);
            // 文字标注
            let text = index.toFixed(1) + "°";
            // 动态计算小数位数
            if (zoom > 10) {
                text = index.toFixed((zoom - 8) / 2) + "°";
            }
            let divIcon = L.divIcon({
                html: `<span style="white-space: nowrap;color:#fff;font-size:14px;font-family:Times New Roman;font-weight:700;text-shadow: 0 0 5px #ff1200, 0 0 10px #ff1200;">${text}</span>`,
                className: 'grid-text-icon', // 取消白色的方形显示
                iconAnchor: [14, -5],
            });
            let textMarker = L.marker([north, index], { icon: divIcon });
            gridLineLatLng.currentFeatureLayerGroup.addLayer(textMarker);
        }
    }
    if (degree > 90) degree = 90;
    // 纬线网格处理代码

}
// 注册地图鼠标移动事件,动态生成网格
gridLineLatLng.currentMap.on('mousemove', gridLineLatLng.mousemove);
标准图幅网格
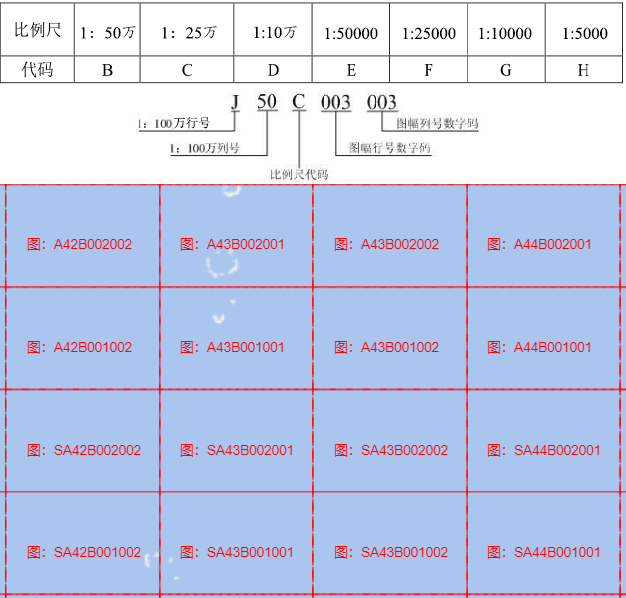
我国把 1:1 万、1:2.5 万、1:5 万、1:10 万、1:25 万、1:50 万、1:100 万 7 种比例尺作为国家基本地图的比例尺系列。根据国家标准GB/13989-92 《国家基本比例尺地形图分幅和编号》规定,我国基本比例尺地形图均1:100 万地形图为基础,按规定的经差和纬差划分图幅。下表为地形图的经纬差、行列数及图幅数。

由于南北两半球的经度相同,规定在南半球的图号前加一个 S,北半球的图号前不加任何符号。如南、北半球经纬度度数相同的情况下北半球图幅号为 F50B001001 ,而南半球则为SF50B001001。比例尺代码含义如下图所示。
效果图
核心代码
计算方法参考leaflet 叠加新标准分幅网格
let features = []; // 存储生成的面要素
let coordinates = [] // 存储生成的面要素坐标对
// 计算标准分幅网格行列范围
const millionRowCode = 'ABCDEFGHIJKLMNOPQRSTUV';
const col0 = parseInt((x0 - GridX0) / lngDiff);
const col1 = parseInt((x1 - GridX0) / lngDiff);
const row0 = parseInt((y0 - GridY0) / latDiff);
const row1 = parseInt((y1 - GridY0) / latDiff);
for (let row = row0; row <= row1; row++) {
    let gy0 = GridY0 + row * latDiff;
    let gy1 = gy0 + latDiff;
    let gcy = (gy0 + gy1) * 0.5;    // 分幅中心点 y 坐标
    let millionRow = parseInt((gy0 - 0) / 4); // 1:100分幅行号
    let Hemisphere = '';   // 北半球标志
    if (millionRow < 0) {
        millionRow = -1 - millionRow;
        Hemisphere = 'S'; // 南半球标志
    }
    for (let col = col0; col <= col1; col++) {
        let gx0 = GridX0 + col * lngDiff;
        let gx1 = gx0 + lngDiff;
        let gcx = (gx0 + gx1) * 0.5;    // 分幅中心点 x 坐标
        let millionCol = parseInt((gcx - GridX0) / 6) + 1;  // 1:100分幅列号(从1开始)
        coordinates = [[[gx0, gy0], [gx1, gy0], [gx1, gy1], [gx0, gy1], [gx0, gy0]]];
        millionCol = (millionCol < 10) ? ('0' + millionCol) : millionCol;
        let gridID = Hemisphere + millionRowCode[millionRow] + millionCol;
        if (scaleCode != '') {
            // 计算当前分幅在 1:100万 分幅内的行列号(注意,这里行列号从左向右,从北向南,从1开始编号)
            let colID = parseInt((fractional((gcx - GridX0) / 6) * 6) / lngDiff) + 1;
            let rowID = parseInt((fractional((GridY1 - gcy) / 4) * 4) / latDiff) + 1;
            gridID += scaleCode + formatInt(rowID, 3) + formatInt(colID, 3);
        }
        // 生成矢量要素(几何信息+属性信息)
        let feature = {
            type: "Feature",
            geometry: {
                type: "Polygon",
                coordinates: coordinates
            },
            properties: {
                ID: gridID,
                extend: '西:' + gx0 + ' 东:' + gx1 + ' 南:' + gy0 + ' 北:' + gy1
            }
        };
        features.push(feature);
    }
}
详细源码(Vue3)
主文件index.vue
<template>
  <div class="app-contain">
    <!-- leaflet 地图容器 -->
    <div id="myMap"></div>
    <div class="controls">
      <el-button color="#626aef" @click="mapGridLonLat">经纬网</el-button>
      <el-button color="#626aef" @click="mapGridStandard">标准图幅</el-button>
      <el-button color="#626aef" @click="clearMapGrid()">清空</el-button>
    </div>
  </div>
</template>

<script setup>
import { gridLineLatLng, gridLineStandard } from './store/mapGrids.js'
// 引入样式
import L from 'leaflet';
import 'leaflet/dist/leaflet.css'
import { onMounted } from 'vue'

let map = null;
let gridLineLayer = null;
// 天地图TK
let tdtKey = 'YOURS_TK'
const initMap = () => {
  // 天地图-矢量注记服务
  const vector_cva =
    new L.TileLayer(`http://t0.tianditu.gov.cn/cva_c/wmts?layer=cva&style=default&tilematrixset=c&Service=WMTS&Request=GetTile&Version=1.0.0&Format=tiles&TileMatrix={z}&TileCol={x}&TileRow={y}&tk=${tdtKey}`,
      {
        tileSize: 512,
        noWrap: true,
        bounds: [[-90, -180], [90, 180]]
      })
  // 天地图-矢量地图服务
  const vector_vec =
    new L.TileLayer(`http://t0.tianditu.com/vec_c/wmts?layer=vec&style=default&tilematrixset=c&Service=WMTS&Request=GetTile&Version=1.0.0&Format=tiles&TileMatrix={z}&TileCol={x}&TileRow={y}&tk=${tdtKey}`,
      {
        tileSize: 512,
        noWrap: true,
        bounds: [[-90, -180], [90, 180]]
      })

  const layers = L.layerGroup([vector_vec, vector_cva])

  map = L.map('myMap', {  //需绑定地图容器div的id
    attributionControl: false,
    zoomControl: true, // 显示缩放控件
    center: [39.56, 116.20], //初始地图中心
    crs: L.CRS.EPSG4326,
    // 最小显示等级
    minZoom: 1,
    // 最大显示等级
    maxZoom: 18,
    scrollWheelZoom: true, //默认开启鼠标滚轮缩放
    // 限制显示地理范围
    maxBounds: L.latLngBounds(L.latLng(-90, -180), L.latLng(90, 180)),
    layers: [layers],// 图层
  }).setView([28.907459, 120.003576], 6)

  /** 网格生成 */

  // 创建图层组
  gridLineLayer = L.featureGroup().addTo(map).bringToFront();
}

// 经纬网
const mapGridLonLat = () => {
  // 若存在,则移除标准图幅网格
  if (gridLineStandard.currentMap != null) {
    gridLineStandard.destory()
  }
  gridLineLatLng.currentMap = map;
  gridLineLatLng.currentFeatureLayerGroup = gridLineLayer
  // 间隔度数
  gridLineLatLng.degree = 1;
  // 网格颜色
  gridLineLatLng.color = '#6666ff'
  gridLineLatLng.init()
}
// 标准图幅网格
const mapGridStandard = () => {
  // 若存在,则移除标准图幅网格
  if (gridLineStandard.currentMap != null) {
    gridLineLatLng.destory()
  }
  gridLineStandard.currentMap = map;
  gridLineStandard.currentFeatureLayerGroup = gridLineLayer
  gridLineStandard.init()
}
// 网格清空
const clearMapGrid = () => {
  // 若存在,则移除标准图幅网格
  if (gridLineStandard.currentMap != null) {
    gridLineLatLng.destory()
  }
  // 若存在,则移除标准图幅网格
  if (gridLineStandard.currentMap != null) {
    gridLineStandard.destory()
  }
}

onMounted(() => {
  initMap()
})
</script>

<style scoped>
#myMap {
  width: 94vw;
  height: 96vh;
}
.grid-text-icon {
  font-size: 16px;
}
.controls {
  position: absolute;
  top: 0px;
  left: 200px;
  padding: 15px;
  z-index: 1000;
}
</style>
mapGrids.js
/**
 * 地图网格工具js
 *
 * @author fungis@163.com
 * @date 2023-05-18
 */

// 本地资源数据
import { makeStandardMapGrids } from './standardMapGrids.js'
// 引入turf
import * as turf from '@turf/turf'

export {
    gridLineLatLng, gridLineStandard
}

/** 地图经纬网格网 */
let gridLineLatLng = {
    currentMap: null,
    currentFeatureLayerGroup: null,
    color: "blue",
    degree: 2,
    init: function () {
        // 清理图层
        gridLineLatLng.currentFeatureLayerGroup.clearLayers();
        // 经纬度间隔
        let map = gridLineLatLng.currentMap;
        let degree = gridLineLatLng.degree;
        // 小于0.01时按0.01计算(数值越小,计算事件越长)
        if (degree < 0.01) {
            degree = 0.01
        }
        let zoom = map.getZoom(); // 获取当前地图缩放级别
        if (zoom > 2 || zoom < 20) {
            let bounds = map.getBounds(); // 获取到当前地图范围
            let north = bounds.getNorth(); // 当前视口最北点经度
            let east = bounds.getEast(); // 当前视口最东点纬度
            // 经线网格
            for (let index = -180; index <= 360; index += degree) {
                // 判断是否在当前视野内
                if (bounds.contains([north, index])) {
                    // 绘制经线
                    let lonLine = L.polyline([[-90, index], [90, index],],
                        { weight: 1, dashArray: '10, 5', color: gridLineLatLng.color } // 线样式
                    );
                    // 添加到图层组中
                    gridLineLatLng.currentFeatureLayerGroup.addLayer(lonLine);
                    // 文字标注
                    let text = index.toFixed(1) + "°";
                    // 动态计算小数位数
                    if (zoom > 10) {
                        text = index.toFixed((zoom - 8) / 2) + "°";
                    }
                    let divIcon = L.divIcon({
                        html: `<span style="white-space: nowrap;color:#fff;font-size:14px;font-family:Times New Roman;font-weight:700;text-shadow: 0 0 5px #ff1200, 0 0 10px #ff1200;">${text}</span>`,
                        className: 'grid-text-icon', // 取消白色的方形显示
                        iconAnchor: [14, -5],
                    });
                    let textMarker = L.marker([north, index], { icon: divIcon });
                    gridLineLatLng.currentFeatureLayerGroup.addLayer(textMarker);
                }
            }
            if (degree > 90) degree = 90;
            // 纬线网格
            for (let index = -90; index <= 90; index += degree) {
                if (bounds.contains([index, east])) {
                    let lonLine = L.polyline([[index, -180], [index, 360],],
                        { weight: 1, dashArray: '10, 5', color: gridLineLatLng.color } // 线样式
                    );
                    gridLineLatLng.currentFeatureLayerGroup.addLayer(lonLine);
                    // 标注
                    let text = index.toFixed(1) + "°";
                    if (zoom > 10) {
                        text = index.toFixed((zoom - 8) / 2) + "°";
                    }
                    let divIcon = L.divIcon({
                        html: `<span style="white-space: nowrap;color:#fff;font-size:14px;font-family:Times New Roman;font-weight:700;text-shadow: 0 0 5px #ff1200, 0 0 10px #ff1200;">${text}</span>`,
                        className: 'grid-text-icon', // 取消白色的方形显示
                        iconAnchor: [(text.length + 1) * 6, 0],
                    });
                    let textMarker = L.marker([index, east], { icon: divIcon });
                    gridLineLatLng.currentFeatureLayerGroup.addLayer(textMarker);
                }
            }
        }
        // 注册地图鼠标移动事件,动态生成网格
        gridLineLatLng.currentMap.on('mousemove', gridLineLatLng.mousemove);
    },
    mousemove: function () {
        gridLineLatLng.init();
    },
    destory: function () {
        // 移除地图事件
        gridLineLatLng.currentMap.off('mousemove', gridLineLatLng.mousemove);
        // 清理图层
        gridLineLatLng.currentFeatureLayerGroup.clearLayers();
    }
}

/** 地图标准图幅格网 */
let gridLineStandard = {
    currentMap: null,
    currentFeatureLayerGroup: null,
    color: "red",
    init: function () {
        // 清理图层
        gridLineStandard.currentFeatureLayerGroup.clearLayers();
        // 经纬度间隔
        let map = gridLineStandard.currentMap;
        // 重新添加网格图层
        let gridLineLayer = gridLineStandard.currentFeatureLayerGroup;
        // 生成网格
        let bounds = map.getBounds();
        const zoom = map.getZoom();
        let scale = 1000000;
        if (zoom > 11) {
            scale = 5000;
        } else if (zoom > 10) {
            scale = 10000;
        } else if (zoom > 9) {
            scale = 25000;
        } else if (zoom > 8) {
            scale = 50000;
        } else if (zoom > 7) {
            scale = 100000;
        } else if (zoom > 6) {
            scale = 250000;
        } else if (zoom > 4) {
            scale = 500000;
        }
        let grids = makeStandardMapGrids(bounds.getWest(), bounds.getSouth(), bounds.getEast(), bounds.getNorth(), scale);
        if (grids == null) {
            return;
        }
        let lineLayer = L.geoJSON(grids, {
            style: function (feature) {
                return {
                    color: gridLineStandard.color,
                    weight: 1,
                    fillColor: 'green',
                    dashArray: '10, 5',
                    fillOpacity: 0
                };
            }, onEachFeature(feature, layer) {
                // 显示文字
                let content = "图:" + feature.properties.ID + '<br>'
                // marker的icon文字
                let myIcon = L.divIcon({
                    html: `<div style="white-space: nowrap;color:red;">${content}</div>`,
                    iconAnchor: [50, 0],
                    className: 'my-div-icon',
                    iconSize: 120
                });
                // 中心点位
                let centerPoint = turf.center(feature);
                let featureCenter = L.latLng(centerPoint.geometry.coordinates[1], centerPoint.geometry.coordinates[0]);
                gridLineLayer.addLayer(L.marker(featureCenter, { icon: myIcon }));
            }
        }).bindPopup(function (layer) {
            return "图幅:" + layer.feature.properties.ID + '<br>' + layer.feature.properties.extend;
        });

        gridLineLayer.addLayer(lineLayer);
        gridLineStandard.currentMap.on('mousemove', gridLineStandard.mousemove);
    },
    mousemove: function () {
        gridLineStandard.init();
    },
    destory: function () {
        // 移除地图事件
        gridLineStandard.currentMap.off('mousemove', gridLineStandard.mousemove);
        // 清理图层
        gridLineStandard.currentFeatureLayerGroup.clearLayers();
    }
}
standardMapGrids.js
/**
 * 地图标准图幅计算要素生成工具js
 * https://www.cnblogs.com/oloroso/p/14129066.html
 *
 * @author ymwh@foxmail.com
 * @date 2020-12-13
 */
// 获取小数部分
const fractional = function (x) {
    x = Math.abs(x);
    return x - Math.floor(x);
}
const formatInt = function (x, len) {
    let result = '' + x;
    len = len - result.length;
    while (len > 0) {
        result = '0' + result;
        len--;
    }
    return result;
}

/**
 * 创建标准分幅网格
 * @param west,south,east,north 传入要创建的标准分幅网格的经纬度范围
 * @param scalem 表示比例尺的分母(例如 10000 表示 1:1万)
 * @returns 返回一个 geojson 对象
 * @author solym ymwh@foxmail.com 2020年12月13日
 */
export function makeStandardMapGrids(west, south, east, north, scalem) {
    let lngDiff = 0;
    let latDiff = 0;
    let scaleCode = '';
    switch (scalem) {
        case 1000000:
            lngDiff = 6;
            latDiff = 4;
            break;
        case 500000:
            lngDiff = 3;
            latDiff = 2;
            scaleCode = 'B';
            break;
        case 250000:
            lngDiff = 1.5;
            latDiff = 1;
            scaleCode = 'C';
            break;
        case 100000:
            lngDiff = 0.5;
            latDiff = 1 / 3;
            scaleCode = 'D';
            break;
        case 50000:
            lngDiff = 0.25;
            latDiff = 1 / 6;
            scaleCode = 'E';
            break;
        case 25000:
            lngDiff = 0.125;
            latDiff = 1 / 12;
            scaleCode = 'F';
            break;
        case 10000:
            lngDiff = 0.0625;
            latDiff = 1 / 24;
            scaleCode = 'G';
            break;
        case 5000:
            lngDiff = 0.03125;
            latDiff = 1 / 48;
            scaleCode = 'H';
            break;
        default:
            return null;
    }
    const GridX0 = -180;
    const GridX1 = 180;
    const GridY0 = -88;
    const GridY1 = 88;
    let x0 = Math.max(GridX0, west);
    let y0 = Math.max(GridY0, south);
    let x1 = Math.min(GridX1, east);
    let y1 = Math.min(GridY1, north);
    if (((x1 - x0) < lngDiff) || ((y1 - y0) < latDiff)) {
        return null;
    }

    let features = []; // 存储生成的面要素
    let coordinates = [] // 存储生成的面要素坐标对
    // 计算标准分幅网格行列范围
    const col0 = parseInt((x0 - GridX0) / lngDiff);
    const col1 = parseInt((x1 - GridX0) / lngDiff);
    const row0 = parseInt((y0 - GridY0) / latDiff);
    const row1 = parseInt((y1 - GridY0) / latDiff);
    const millionRowCode = 'ABCDEFGHIJKLMNOPQRSTUV';
    for (let row = row0; row <= row1; row++) {
        let gy0 = GridY0 + row * latDiff;
        let gy1 = gy0 + latDiff;
        let gcy = (gy0 + gy1) * 0.5;    // 分幅中心点 y 坐标
        let millionRow = parseInt((gy0 - 0) / 4); // 1:100分幅行号
        let Hemisphere = '';   // 北半球标志
        if (millionRow < 0) {
            millionRow = -1 - millionRow;
            Hemisphere = 'S'; // 南半球标志
        }
        for (let col = col0; col <= col1; col++) {
            let gx0 = GridX0 + col * lngDiff;
            let gx1 = gx0 + lngDiff;
            let gcx = (gx0 + gx1) * 0.5;    // 分幅中心点 x 坐标
            let millionCol = parseInt((gcx - GridX0) / 6) + 1;  // 1:100分幅列号(从1开始)
            coordinates = [[[gx0, gy0], [gx1, gy0], [gx1, gy1], [gx0, gy1], [gx0, gy0]]];
            millionCol = (millionCol < 10) ? ('0' + millionCol) : millionCol;
            let gridID = Hemisphere + millionRowCode[millionRow] + millionCol;
            if (scaleCode != '') {
                // 计算当前分幅在 1:100万 分幅内的行列号(注意,这里行列号从左向右,从北向南,从1开始编号)
                let colID = parseInt((fractional((gcx - GridX0) / 6) * 6) / lngDiff) + 1;
                let rowID = parseInt((fractional((GridY1 - gcy) / 4) * 4) / latDiff) + 1;
                gridID += scaleCode + formatInt(rowID, 3) + formatInt(colID, 3);
            }
            // 生成矢量要素(几何信息+属性信息)
            let feature = {
                type: "Feature",
                geometry: {
                    type: "Polygon",
                    coordinates: coordinates
                },
                properties: {
                    ID: gridID,
                    extend: '西:' + gx0 + ' 东:' + gx1 + ' 南:' + gy0 + ' 北:' + gy1
                }
            };
            features.push(feature);
        }
    }
    return {
        type: "FeatureCollection",
        features: features
    };
}