轮廓检测
一、实验介绍
1. 实验内容
本实验将学习轮廓检测及功能。
2. 实验要点
- 生成二进制图像来查找轮廓
- 找到并画出轮廓
- 轮廓特征
- 边界矩形
3. 实验环境
- Python 3.6.6
- numpy
- matplotlib
- cv2
二、实验步骤
1 导入资源并显示图像
import numpy as np
import matplotlib.pyplot as plt
import cv2

%matplotlib inline

# 读入图像
image = cv2.imread('images/thumbs_up_down.jpg')

# 将颜色更改为RGB(从BGR)
image = cv2.cvtColor(image, cv2.COLOR_BGR2RGB)

plt.imshow(image)
<matplotlib.image.AxesImage at 0x22f6bc229c8>

2 生成二进制图像来查找轮廓
# 转换为灰度
gray = cv2.cvtColor(image,cv2.COLOR_RGB2GRAY)

# 创建一个二进制阈值图像
retval, binary = cv2.threshold(gray, 225, 255, cv2.THRESH_BINARY_INV)

plt.imshow(binary, cmap='gray')
<matplotlib.image.AxesImage at 0x22f6bcf3608>

3 找到并画出轮廓
# 从带阈值的二进制图像中查找轮廓

retval,contours, hierarchy = cv2.findContours(binary, cv2.RETR_TREE, cv2.CHAIN_APPROX_SIMPLE)

# 在原始图像的副本上绘制所有轮廓
contours_image = np.copy(image)
contours_image = cv2.drawContours(contours_image, contours, -1, (0,255,0), 3)

plt.imshow(contours_image)
<matplotlib.image.AxesImage at 0x22f6bd6a208>

三、实验任务
任务一:轮廓特征
每个轮廓都有许多可以计算的特征,包括轮廓的面积,它的方向(大部分轮廓指向的方向),它的周长,以及OpenCV documentation, here中概述的许多其他属性。
在下一个单元格中,要求标识左右轮廓的方向。明确手的方向,让你知道哪只手的拇指向上,哪只手的拇指向下!
方向:
对象的方向是对象指向的角度。 要找到轮廓的角度,首先应找到适合轮廓的椭圆,然后从该形状中提取角度。
# Fit an ellipse to a contour and extract the angle from that ellipse
(x,y), (MA,ma), angle = cv2.fitEllipse(selected_contour)
方向值
这些取向值以度为单位,从x轴测量。 值为零表示平直线,值为90表示轮廓指向直线!
因此,每个轮廓计算的方向角应该能够告诉我们关于手的一般位置的信息。 用拇指向上的手应该比用拇指向下的手更高(接近90度)。
练习一: 找到每个轮廓的方向
## TODO: 完成此功能,以便
## 返回轮廓列表的方向
## 列表应与轮廓顺序相同
## 即第一个角度应该是第一个轮廓的方向
def orientations(contours):
    """
    方向
    :参数轮廓: 轮廓列表
    :返回值: 角度,轮廓的方向
    """

    # 创建一个空列表以存储角度
    # 提示:使用angles.append(value)将值添加到此列表中
    angles = []

    return angles


# ---------------------------------------------------------- #
# 打印方向值
angles = orientations(contours)
print('Angles of each contour (in degrees): ' + str(angles))
任务二:边界矩形
在下一个单元格中,系统将要求您在* left *手轮廓周围找到边界矩形,该轮廓已将其拇指向上,然后使用该边界矩形裁剪图像并更好地集中在那只手上!
# 查找选定轮廓的边界矩形
x,y,w,h = cv2.boundingRect(selected_contour)

# 将边界矩形绘制为紫色框
box_image = cv2.rectangle(contours_image, (x,y), (x+w,y+h), (200,0,200),2)
要裁剪图像,请选择要包含的图像的正确宽度和高度。
# 使用边界矩形(x,y,w,h)的尺寸进行裁剪
cropped_image = image[y: y + h, x: x + w]
练习二: 围绕轮廓裁剪图像
## TODO: 完成此功能,以便
## 它会返回原始图像的新裁剪版本
def left_hand_crop(image, selected_contour):
    """
    Left hand crop
    :参数图像:原始图像
    :参数selectec_contour:将用于裁剪的轮廓
    :返回值: cropped_image, 左手周围的裁剪图像
    """

    ## TODO: 检测左手轮廓的边界矩形

    ## TODO: 使用边界矩形的尺寸裁剪图像
    # 复制图像进行裁剪

    cropped_image = np.copy(image)

    return cropped_image


## TODO: 从列表中选择左侧轮廓
## 替换此值
selected_contour = contours[1]


# ---------------------------------------------------------- #
# 如果选择了轮廓
if(selected_contour is not None):
    # 调用带有该轮廓的裁剪函数作为参数
    cropped_image = left_hand_crop(image, selected_contour)
    plt.imshow(cropped_image)

高斯模糊
一、实验介绍
1. 实验内容
本实验将学习高斯模糊。
2. 实验要点
- 高斯模糊图像
- 使用高通滤波器测试性能
3. 实验环境
- Python 3.6.6
- numpy
- matplotlib
- cv2
二、实验步骤
1 导入资源并显示图像
import numpy as np
import matplotlib.pyplot as plt
import cv2

%matplotlib inline

# 读入图像
image = cv2.imread('images/brain_MR.jpg')

# 制作图像副本
image_copy = np.copy(image)

# 将颜色更改为RGB(从BGR)
image_copy = cv2.cvtColor(image_copy, cv2.COLOR_BGR2RGB)

plt.imshow(image_copy)
<matplotlib.image.AxesImage at 0x7ff2ed79cf28>

2 高斯模糊图像
# 转换为灰度用于过滤
gray = cv2.cvtColor(image_copy, cv2.COLOR_RGB2GRAY)

# 创建高斯模糊图像
gray_blur = cv2.GaussianBlur(gray, (9, 9), 0)

f, (ax1, ax2) = plt.subplots(1, 2, figsize=(20,10))

ax1.set_title('original gray')
ax1.imshow(gray, cmap='gray')

ax2.set_title('blurred image')
ax2.imshow(gray_blur, cmap='gray')
<matplotlib.image.AxesImage at 0x7ff2b02cbbe0>

3 使用高通滤波器测试性能
# 高通滤波器

# 3x3 Sobel滤波器用于边缘检测
sobel_x = np.array([[ -1, 0, 1],
                   [ -2, 0, 2],
                   [ -1, 0, 1]])


sobel_y = np.array([[ -1, -2, -1],
                   [ 0, 0, 0],
                   [ 1, 2, 1]])


# 使用filter2D过滤原始和模糊的灰度图像
filtered = cv2.filter2D(gray, -1, sobel_x)

filtered_blurred = cv2.filter2D(gray_blur, -1, sobel_y)
f, (ax1, ax2) = plt.subplots(1, 2, figsize=(20,10))

ax1.set_title('original gray')
ax1.imshow(filtered, cmap='gray')

ax2.set_title('blurred image')
ax2.imshow(filtered_blurred, cmap='gray')
<matplotlib.image.AxesImage at 0x7ff2b0216518>

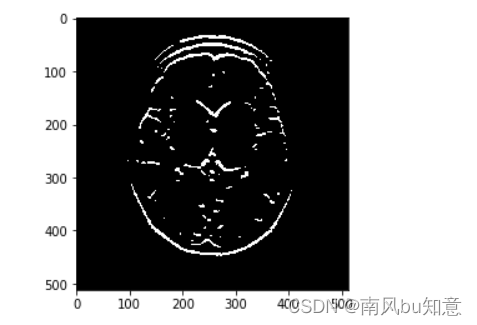
# 创建一个阈值,将所有过滤的像素设置为白色
# 在一定的阈值之上

retval, binary_image = cv2.threshold(filtered_blurred, 50, 255, cv2.THRESH_BINARY)

plt.imshow(binary_image, cmap='gray')
<matplotlib.image.AxesImage at 0x7ff2b018be10>
