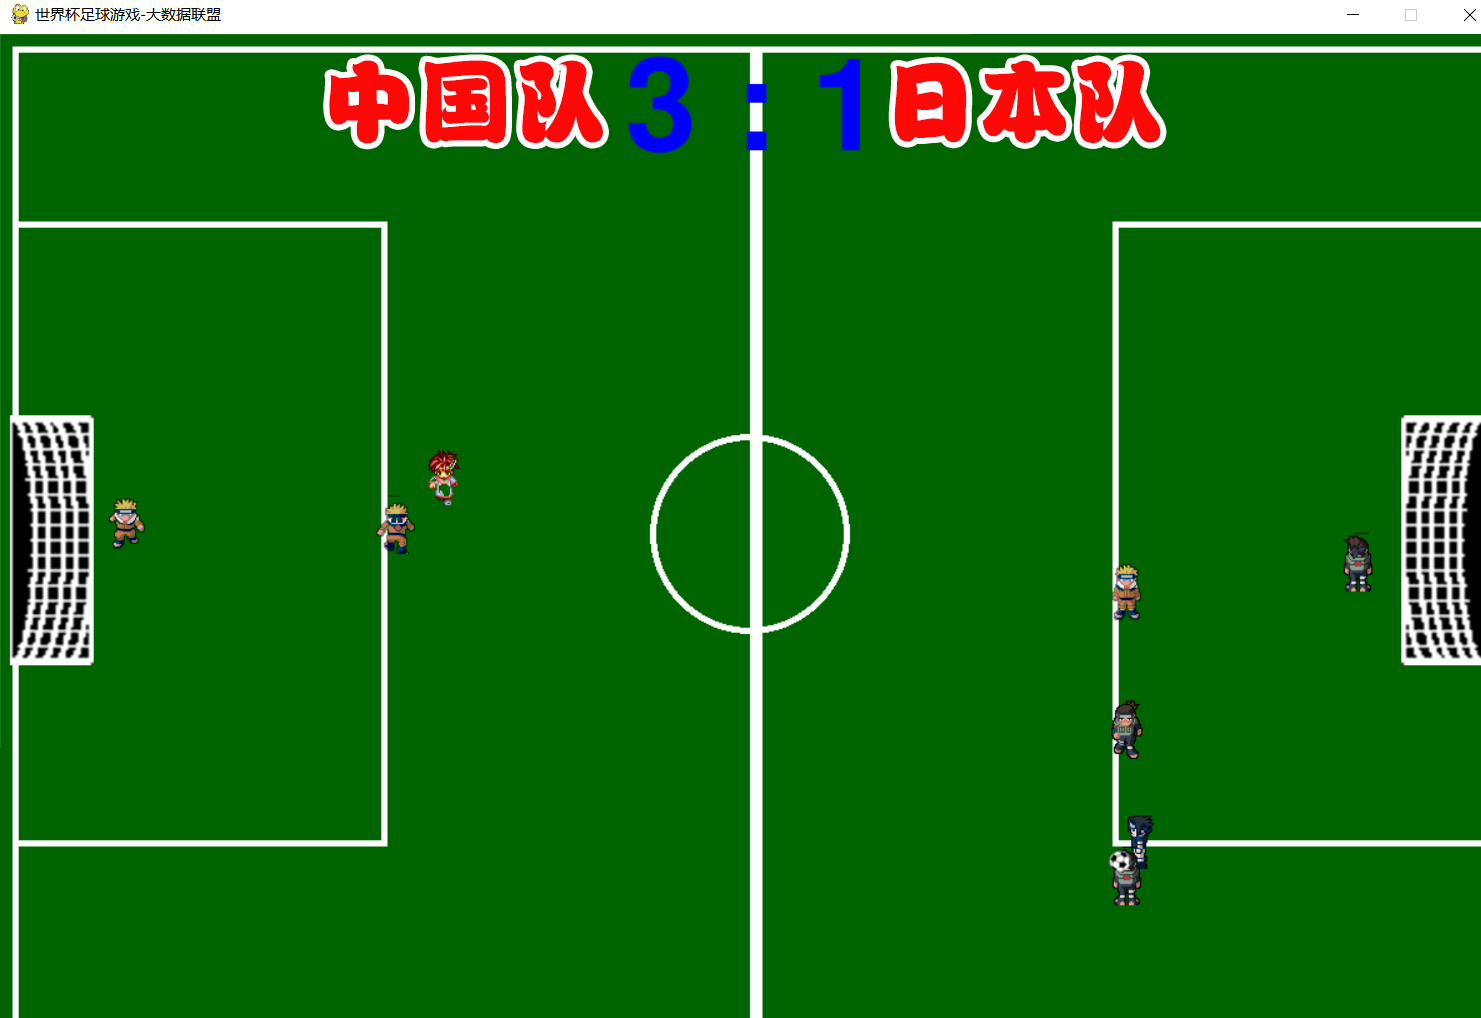
卡塔尔世界杯赛程近半,朋友圈都在晒中奖的体育彩票,而我在搬砖🧱。
今天我将介绍如何使用Python Matplotlib创建一个足球场,本文设计球场尺寸为105×68。
首先导入所需的依赖包:
import pandas as pd
import numpy as np

import matplotlib.pyplot as plt
from matplotlib.patches import Arc
其实看似复杂的足球场一旦将其分解成各个组成部分,就不是什么特别复杂的事情了。足球场只是线条和形状的集合,下面我将一步步实现其包含的各个元素并在最后将它们全部封装在一个函数中。
首先,设置一些会频繁用到的全局变量。
# 足球场的边界长宽
x_min = 0
x_max = 105
y_min = 0
y_max = 68

line_color = "grey"
line_thickness = 1.5
background = "w" # w表示white
point_size = 20

arc_angle = 0
first = 0
second = 1
接下来创建列表pitch_x、pitch_y标记球场上各个元素的坐标。
pitch_x = [0,5.8,11.5,17,50,83,88.5,94.2,100] # pitch x markings

"""
[goal line, six yard box, penalty spot, edge of box,
 halfway line, edge of box, penalty spot, six yard box, goal line]
"""

pitch_y = [0, 21.1, 36.6, 50, 63.2, 78.9, 100]

"""
[sideline, edge of box, six yard box, centre of pitch,
 six yard box, edge of box, sideline ]
"""

goal_y = [45.2, 54.8] # goal posts
上述定义的x、y为100x100, 需要对球场进行同比例转换为105x68,当然球场元素坐标也会同比例变化:
x_conversion = 105 / 100
y_conversion = 68 / 100

pitch_x = [item * x_conversion for item in pitch_x]
pitch_y = [item * y_conversion for item in pitch_y]
goal_y = [item * y_conversion for item in goal_y]
现在已经对元素的点坐标进行了转换,下面就可以通过 x 和 y 坐标列表来绘制足球场的各个元素了。例如,这是如何绘制球场边线的代码:
lx1 = [x_min, x_max, x_max, x_min, x_min]
ly1 = [y_min, y_min, y_max, y_max, y_min]

fig, ax = plt.subplots(figsize=(11,7))
ax.axis("off")
ax.plot(lx1,ly1, color=line_color, lw=line_thickness, zorder=-1)

plt.tight_layout()
plt.show()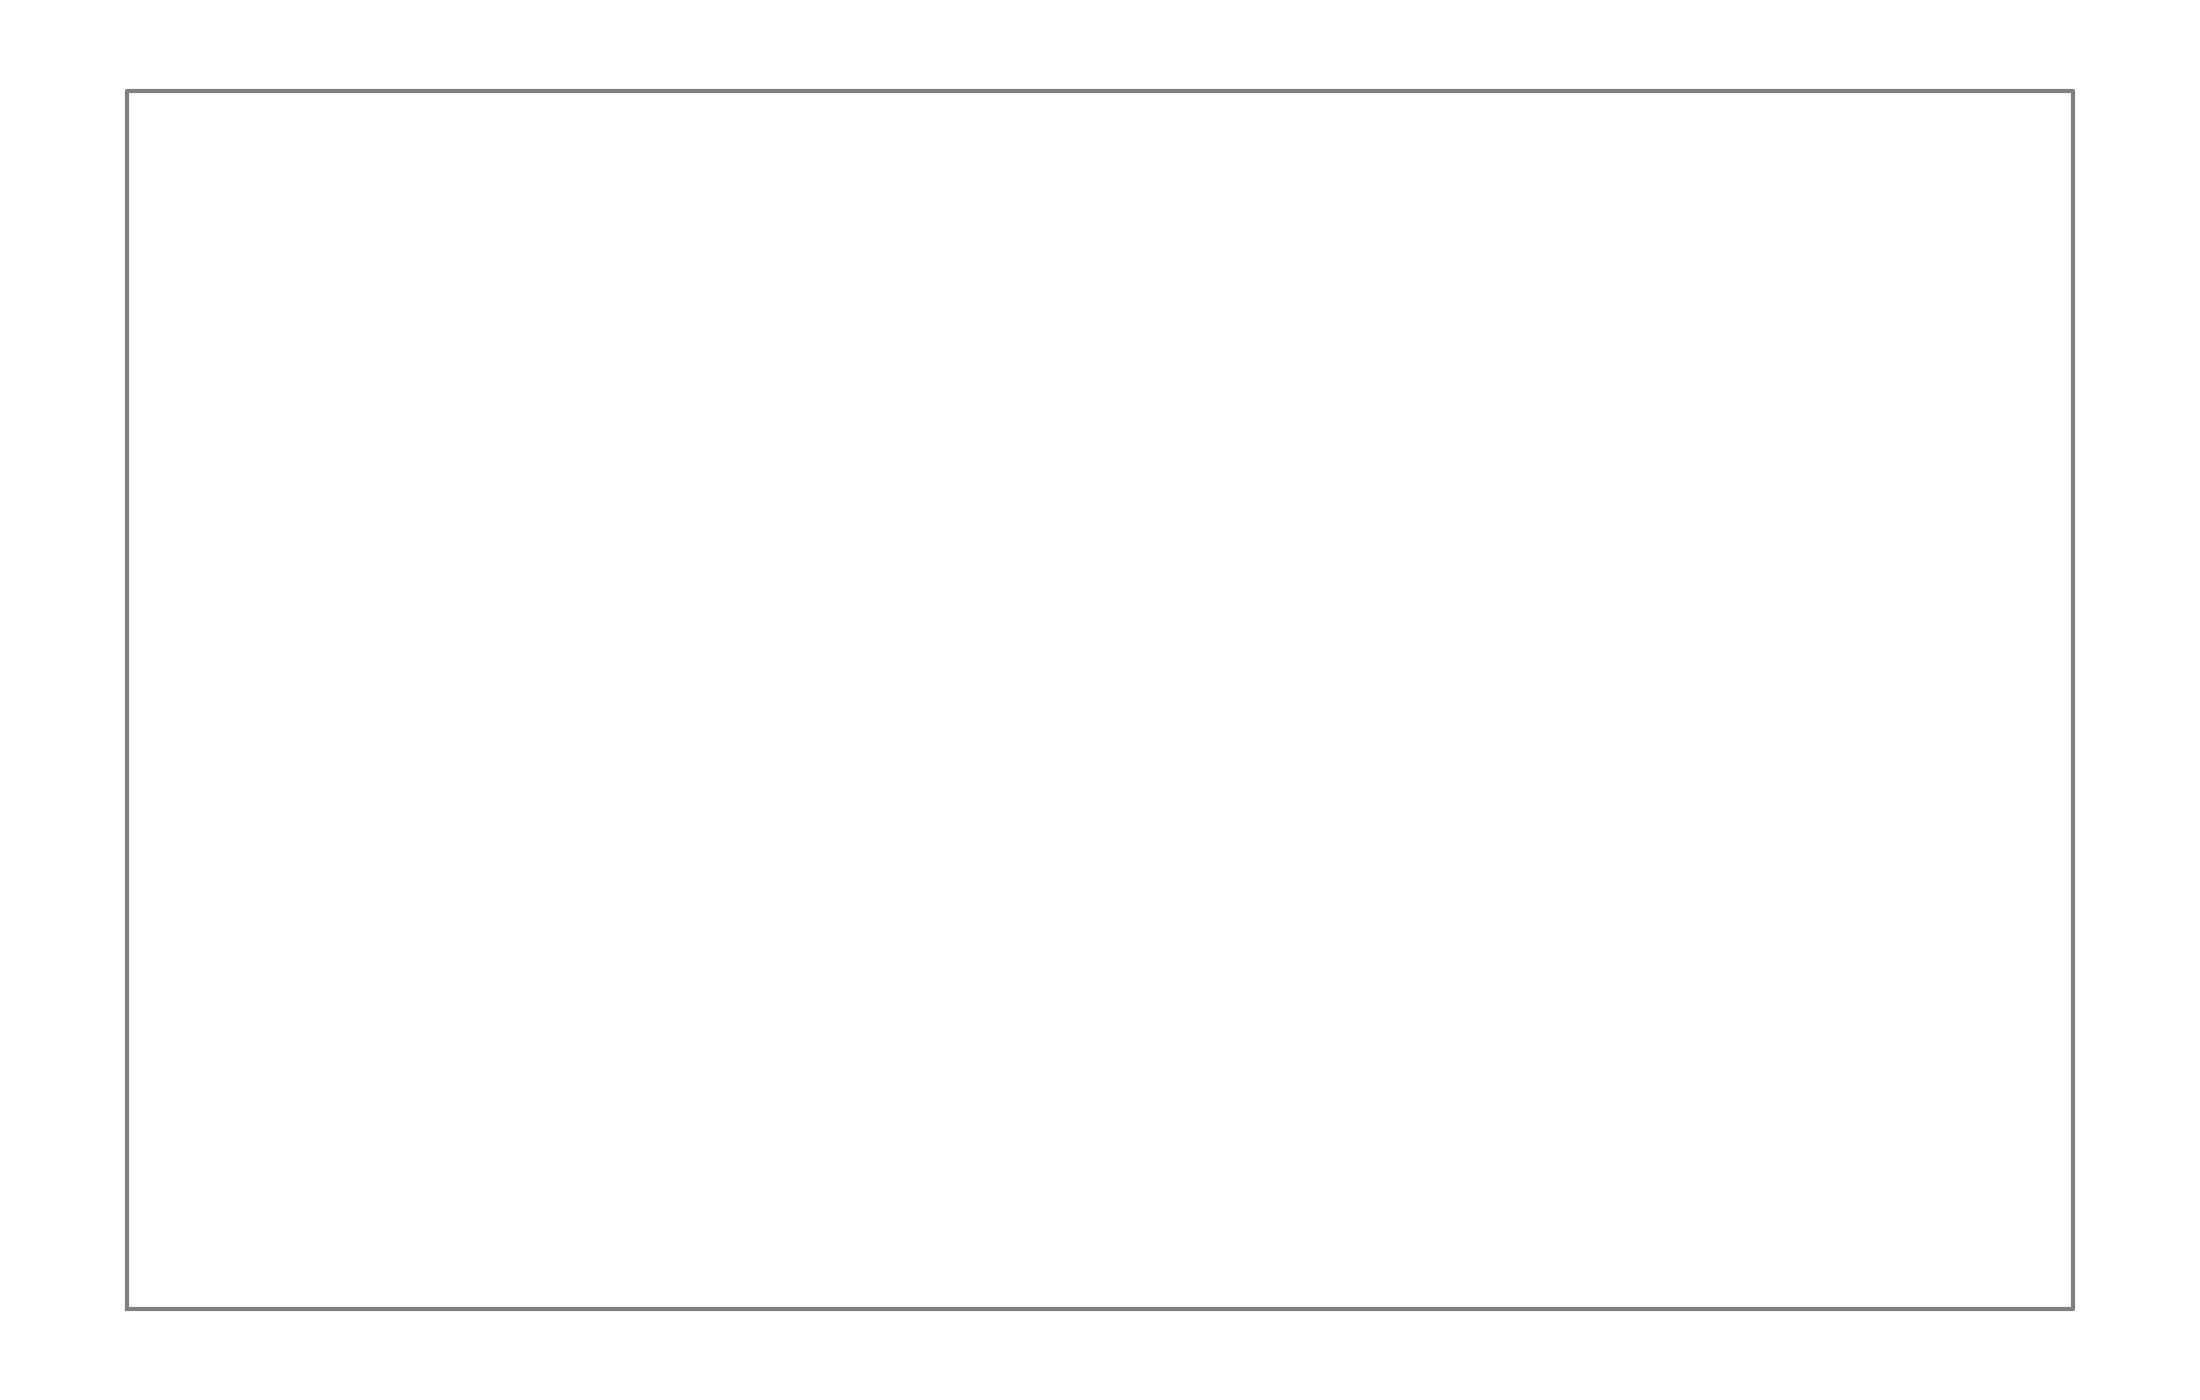
下面可以遍历每个元素的标记并将它们绘制成对应的球场元素。
# side and goal lines
lx1 = [x_min, x_max, x_max, x_min, x_min]
ly1 = [y_min, y_min, y_max, y_max, y_min]

ax.plot(lx1, ly1, color=line_color, lw=line_thickness, zorder=-1)

# outer boxed
lx2 = [x_max, pitch_x[5], pitch_x[5], x_max]
ly2 = [pitch_y[1], pitch_y[1], pitch_y[5], pitch_y[5]]

ax.plot(lx2, ly2, color=line_color, lw=line_thickness, zorder=-1)

lx3 = [0, pitch_x[3], pitch_x[3], 0]
ly3 = [pitch_y[1], pitch_y[1], pitch_y[5], pitch_y[5]]

ax.plot(lx3, ly3, color=line_color, lw=line_thickness, zorder=-1)

# .....
当然这不是最好的方法,因为这意味着如果我想绘制垂直方向足球场,我需要调整每一项数据。与其一一绘制,不如构建坐标列表并将它们添加到主列表中:
# side and goal lines
lx1 = [x_min, x_max, x_max, x_min, x_min]
ly1 = [y_min, y_min, y_max, y_max, y_min]

# outer boxed
lx2 = [x_max, pitch_x[5], pitch_x[5], x_max]
ly2 = [pitch_y[1], pitch_y[1], pitch_y[5], pitch_y[5]]

lx3 = [0, pitch_x[3], pitch_x[3], 0]
ly3 = [pitch_y[1], pitch_y[1], pitch_y[5], pitch_y[5]]

# goals
lx4 = [x_max, x_max+2, x_max+2, x_max]
ly4 = [goal_y[0], goal_y[0], goal_y[1], goal_y[1]]

lx5 = [0, -2, -2, 0]
ly5 = [goal_y[0], goal_y[0], goal_y[1], goal_y[1]]

# 6 yard boxes
lx6 = [x_max, pitch_x[7], pitch_x[7], x_max]
ly6 = [pitch_y[2], pitch_y[2], pitch_y[4], pitch_y[4]]

lx7 = [0, pitch_x[1], pitch_x[1], 0]
ly7 = [pitch_y[2], pitch_y[2], pitch_y[4], pitch_y[4]]

# Halfway line, penalty spots, and kickoff spot
lx8 = [pitch_x[4], pitch_x[4]]
ly8 = [0, y_max]

lines = [
    [lx1, ly1],
    [lx2, ly2],
    [lx3, ly3],
    [lx4, ly4],
    [lx5, ly5],
    [lx6, ly6],
    [lx7, ly7],
    [lx8, ly8],
    ]
通过循环遍历lines列表来绘制上面的图:
fig, ax = plt.subplots(figsize=(11,7))
ax.axis("off")

for line in lines:
    ax.plot(line[0], line[1],
            color=line_color,
            lw=line_thickness,
            zorder=-1)

plt.tight_layout()
plt.show()
这样绘图代码看起来更清晰,以同样的方式绘制开球点和罚球点:
points = [
    [pitch_x[6], pitch_y[3]],
    [pitch_x[2], pitch_y[3]],
    [pitch_x[4], pitch_y[3]]
    ]
然后遍历绘图代码中的点:
fig, ax = plt.subplots(figsize=(11,7))
ax.axis("off")

for line in lines:
    ax.plot(line[0], line[1],
            color=line_color,
            lw=line_thickness,
            zorder=-1)

for point in points:
    ax.scatter(point[0], point[1],
               color=line_color,
               s=point_size,
               zorder=-1)

plt.tight_layout()
plt.show()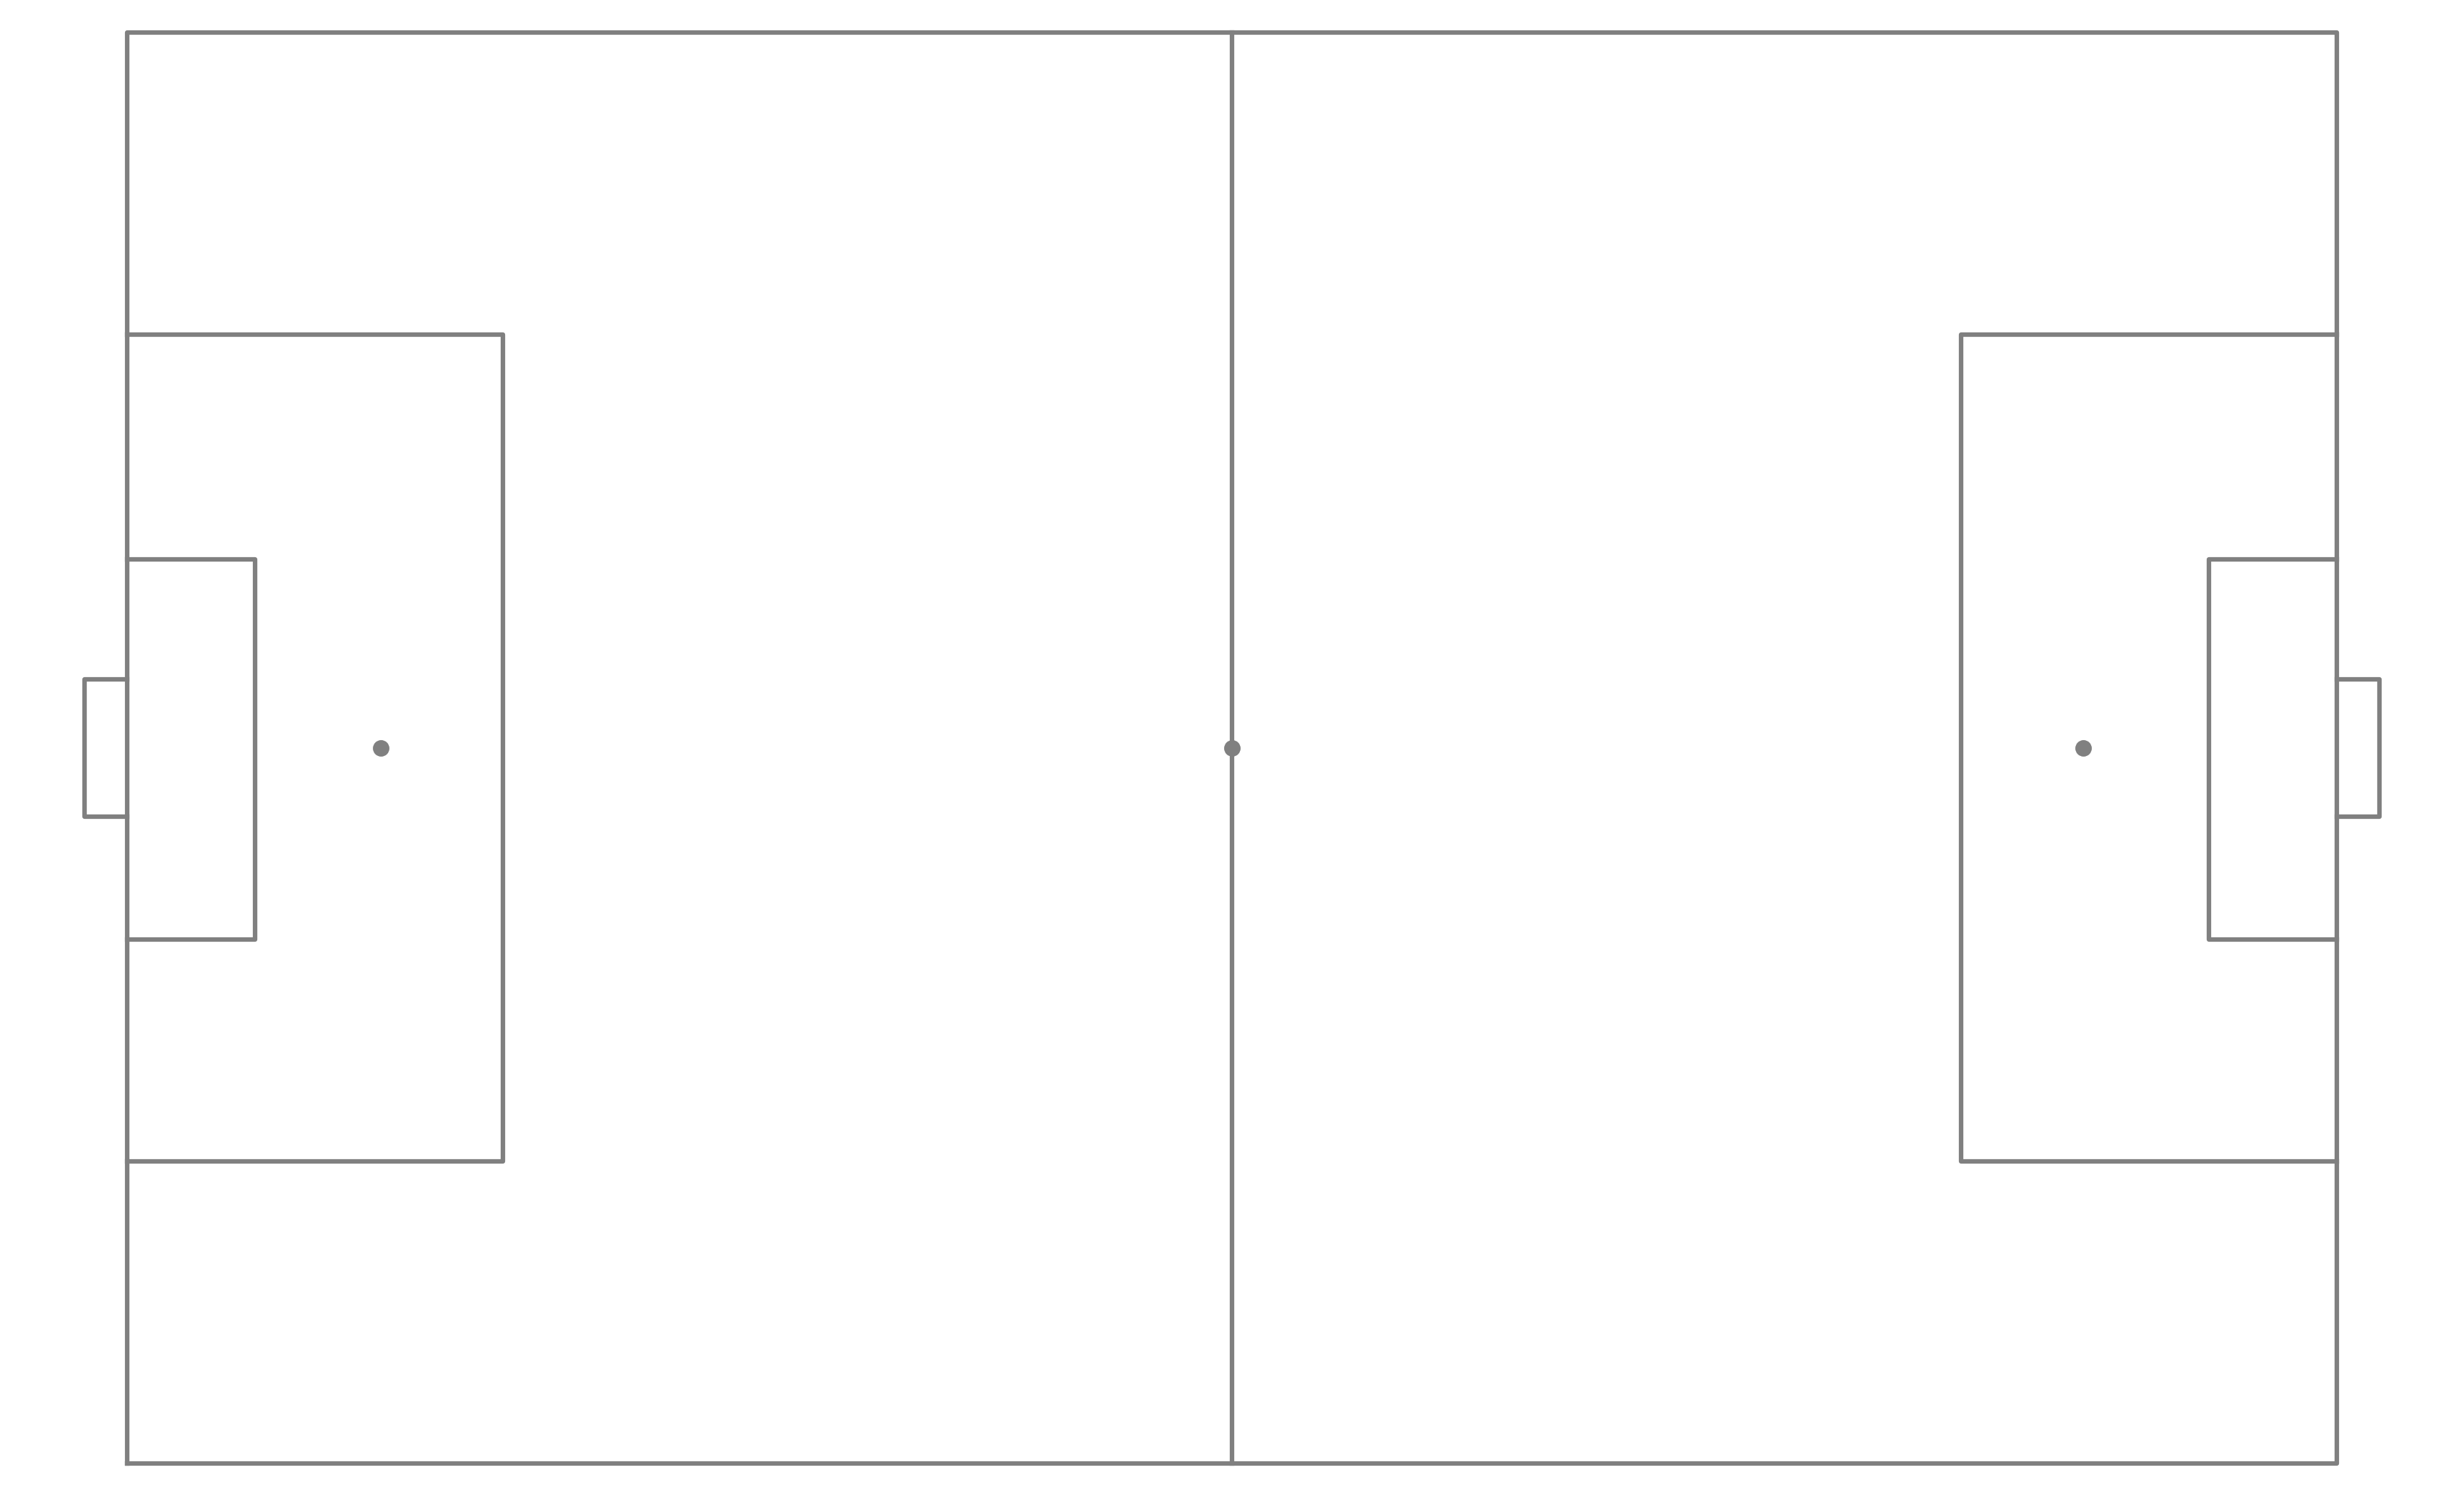
在每个"box"上添加中心圆。
circle_points = [pitch_x[4], pitch_y[3]]
arc_points1 = [pitch_x[6], pitch_y[3]]
arc_points2 = [pitch_x[2], pitch_y[3]]
fig, ax = plt.subplots(figsize=(11,7))
ax.axis("off")
for line in lines:
    ax.plot(line[0], line[1],
            color=line_color,
            lw=line_thickness,
            zorder=-1)

for point in points:
    ax.scatter(point[0], point[1],
               color=line_color,
               s=point_size,
               zorder=-1)

circle = plt.Circle((circle_points[0], circle_points[1]),
                     x_max * 0.088,
                     lw=line_thickness,
                     color=line_color,
                     fill=False,
                     zorder=-1)

ax.add_artist(circle)

arc1 = Arc((arc_points1[0], arc_points1[1]),
           height=x_max * 0.088 * 2,
           width=x_max * 0.088 * 2,
           angle=arc_angle,
           theta1=128.75,
           theta2=231.25,
           color=line_color,
           lw=line_thickness,
           zorder=-1)

ax.add_artist(arc1)

arc2 = Arc((arc_points2[0], arc_points2[1]),
           height=x_max * 0.088 * 2,
           width=x_max * 0.088 * 2,
           angle=arc_angle,
           theta1=308.75,
           theta2=51.25,
           color=line_color,
           lw=line_thickness,
           zorder=-1)

ax.add_artist(arc2)

ax.set_aspect("equal")
plt.tight_layout()
plt.show()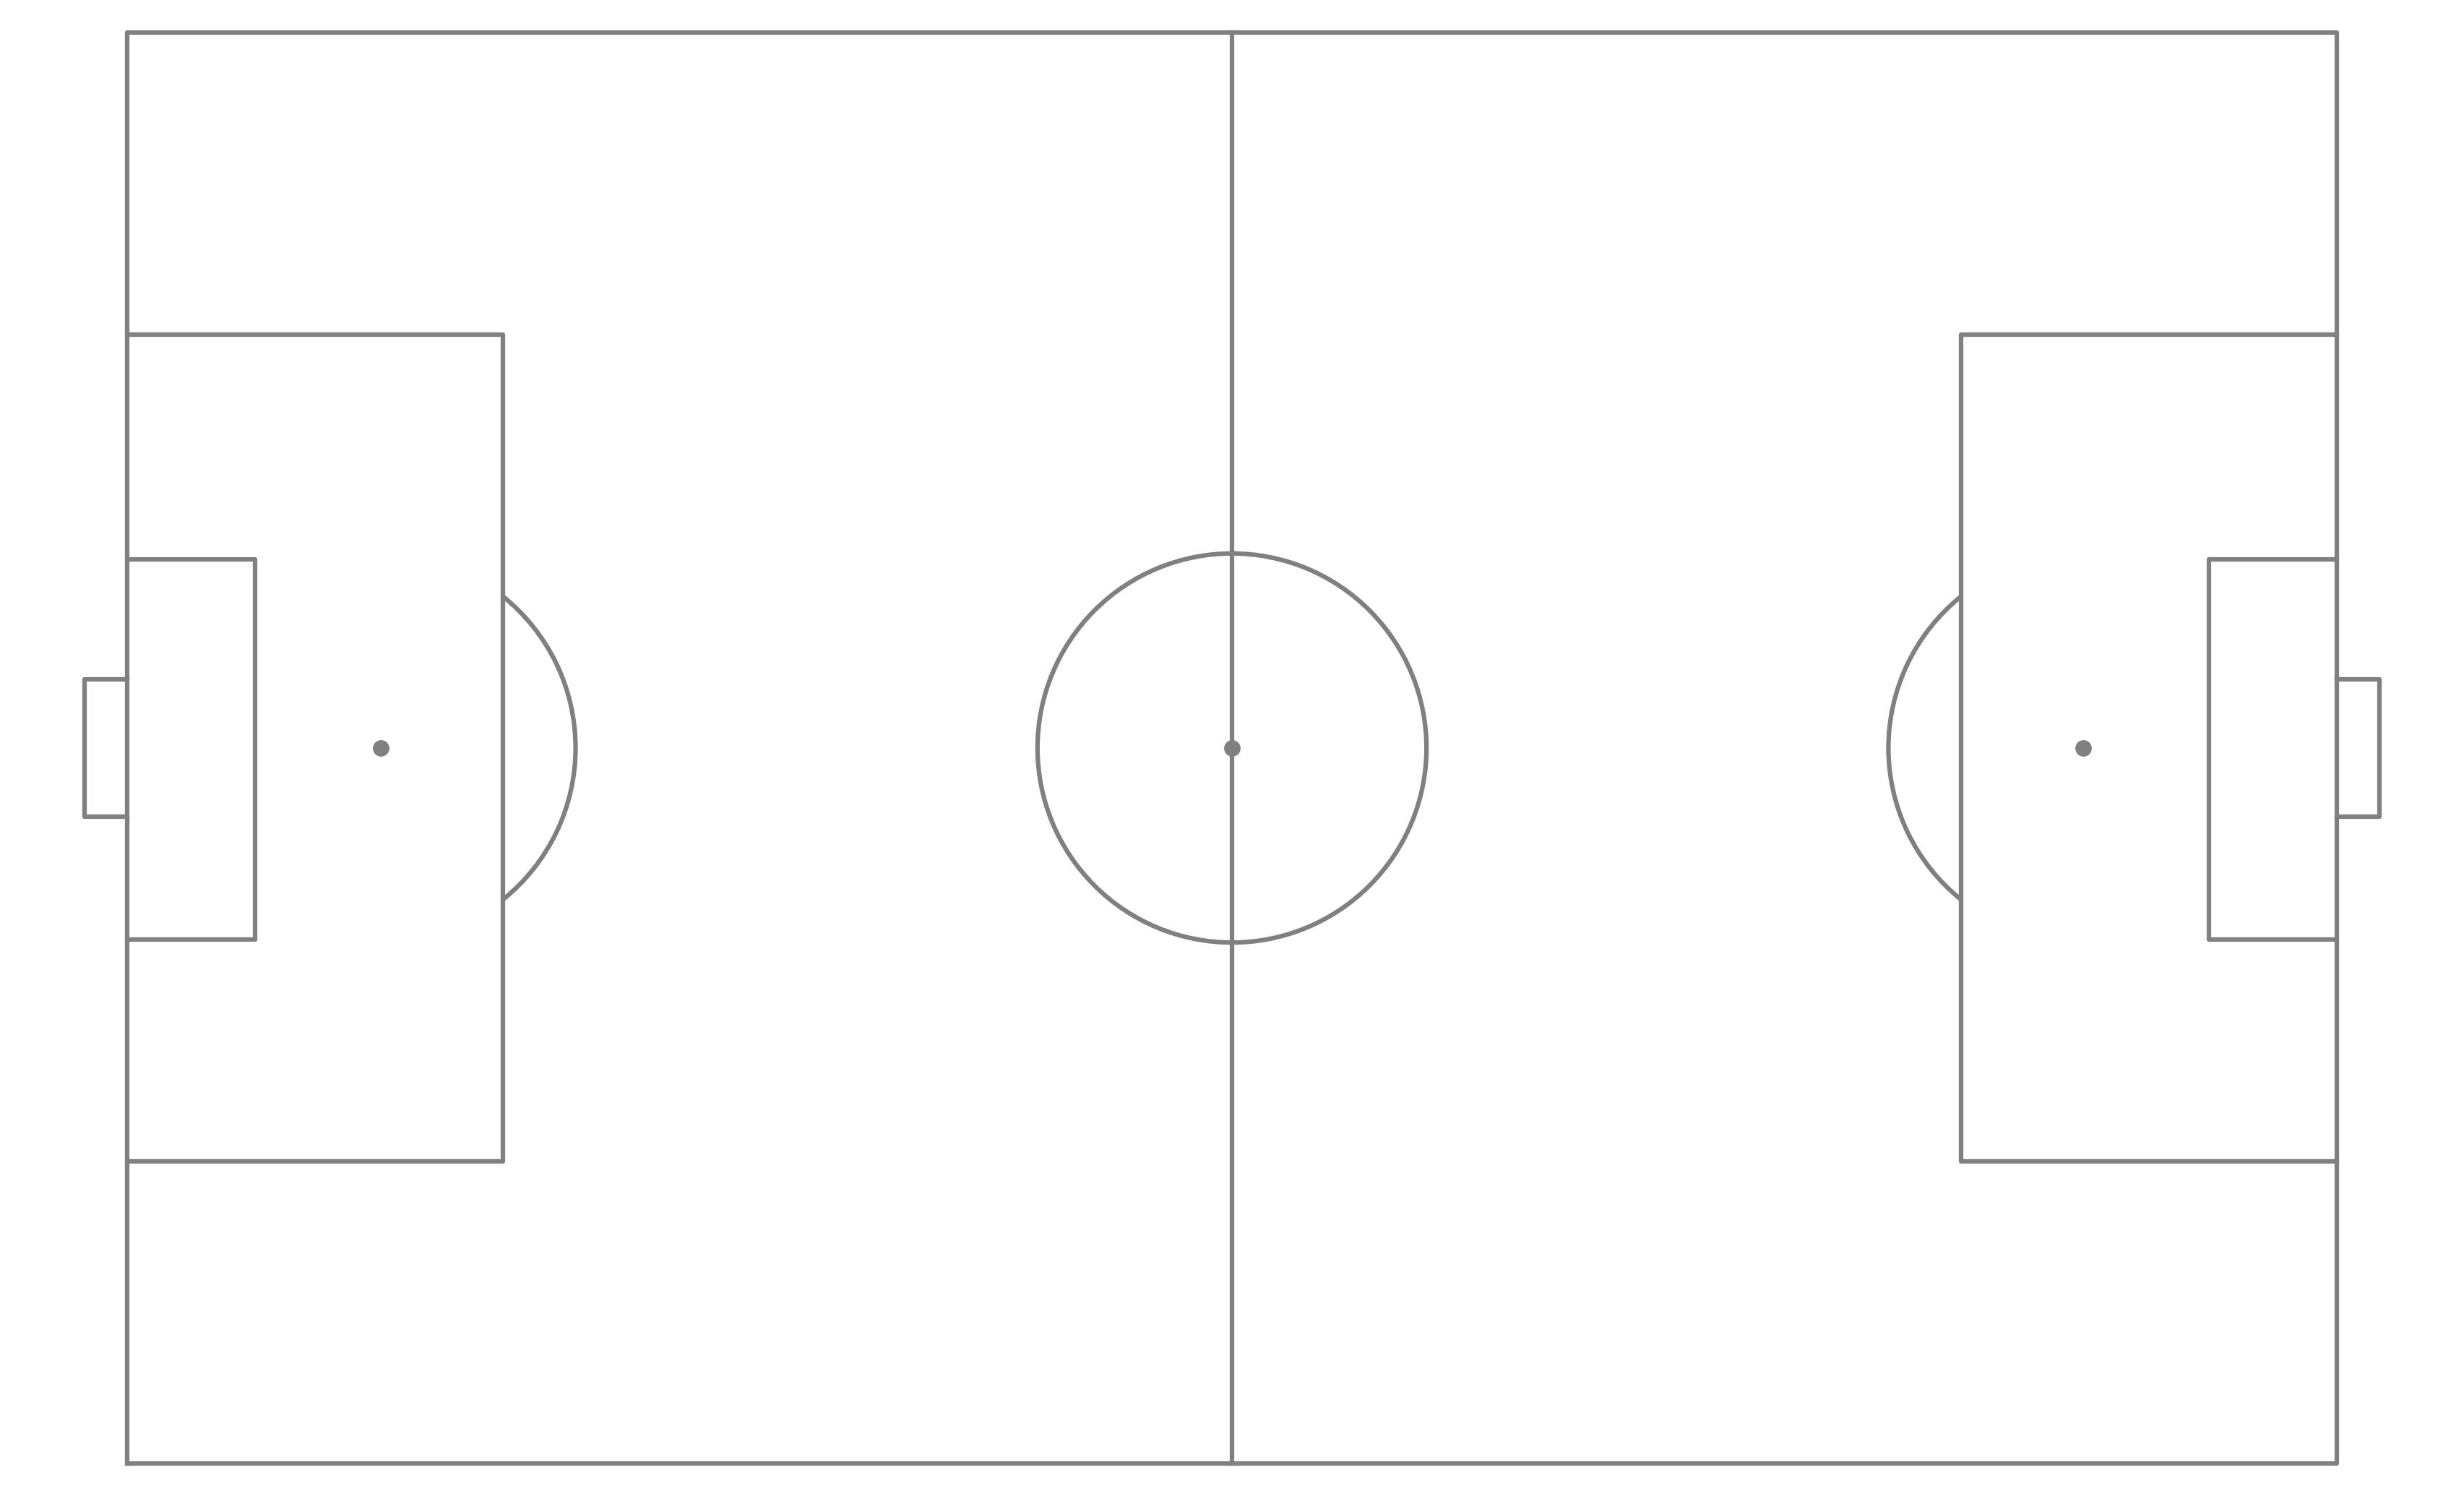
这就是创建足球场的整个过程!然而,这还没有结束。我添加了几个变量并调整了代码以绘制逻辑更加灵活。
fig, ax = plt.subplots(figsize=(11,7))
ax.axis("off")

for line in lines:
    ax.plot(line[first], line[second],
            color=line_color,
            lw=line_thickness,
            zorder=-1)

for point in points:
    ax.scatter(point[first], point[second],
               color=line_color,
               s=point_size,
               zorder=-1)

circle = plt.Circle((circle_points[first], circle_points[second]),
                     x_max * 0.088,
                     lw=line_thickness,
                     color=line_color,
                     fill=False,
                     zorder=-1)

ax.add_artist(circle)

arc1 = Arc((arc_points1[first], arc_points1[second]),
           height=x_max * 0.088 * 2,
           width=x_max * 0.088 * 2,
           angle=arc_angle,
           theta1=128.75,
           theta2=231.25,
           color=line_color,
           lw=line_thickness,
           zorder=-1)

ax.add_artist(arc1)

arc2 = Arc((arc_points2[first], arc_points2[second]),
           height=x_max * 0.088 * 2,
           width=x_max * 0.088 * 2,
           angle=arc_angle,
           theta1=308.75,
           theta2=51.25,
           color=line_color,
           lw=line_thickness,
           zorder=-1)

ax.add_artist(arc2)

ax.set_aspect("equal")
plt.tight_layout()
plt.show()
还记得文章开头设置的几个变量吧:arc_angle = 0、first = 0 和 second = 1。通过将这些设置为变量而不是硬编码,我们可以修改这几个变量为first = 1、second = 0和arc_angle = 90,这样就可以绘制一个垂直方向的足球场了。
first = 1
second = 0
arc_angle = 90

fig, ax = plt.subplots(figsize=(7,11))
ax.axis("off")

for line in lines:
    ax.plot(line[first], line[second],
            color=line_color,
            lw=line_thickness,
            zorder=-1)

for point in points:
    ax.scatter(point[first], point[second],
               color=line_color,
               s=point_size,
               zorder=-1)

circle = plt.Circle((circle_points[first], circle_points[second]),
                     x_max * 0.088,
                     lw=line_thickness,
                     color=line_color,
                     fill=False,
                     zorder=-1)

ax.add_artist(circle)

arc1 = Arc((arc_points1[first], arc_points1[second]),
           height=x_max * 0.088 * 2,
           width=x_max * 0.088 * 2,
           angle=arc_angle,
           theta1=128.75,
           theta2=231.25,
           color=line_color,
           lw=line_thickness,
           zorder=-1)

ax.add_artist(arc1)

arc2 = Arc((arc_points2[first], arc_points2[second]),
           height=x_max * 0.088 * 2,
           width=x_max * 0.088 * 2,
           angle=arc_angle,
           theta1=308.75,
           theta2=51.25,
           color=line_color,
           lw=line_thickness,
           zorder=-1)

ax.add_artist(arc2)

ax.set_aspect("equal")
plt.tight_layout()
plt.show()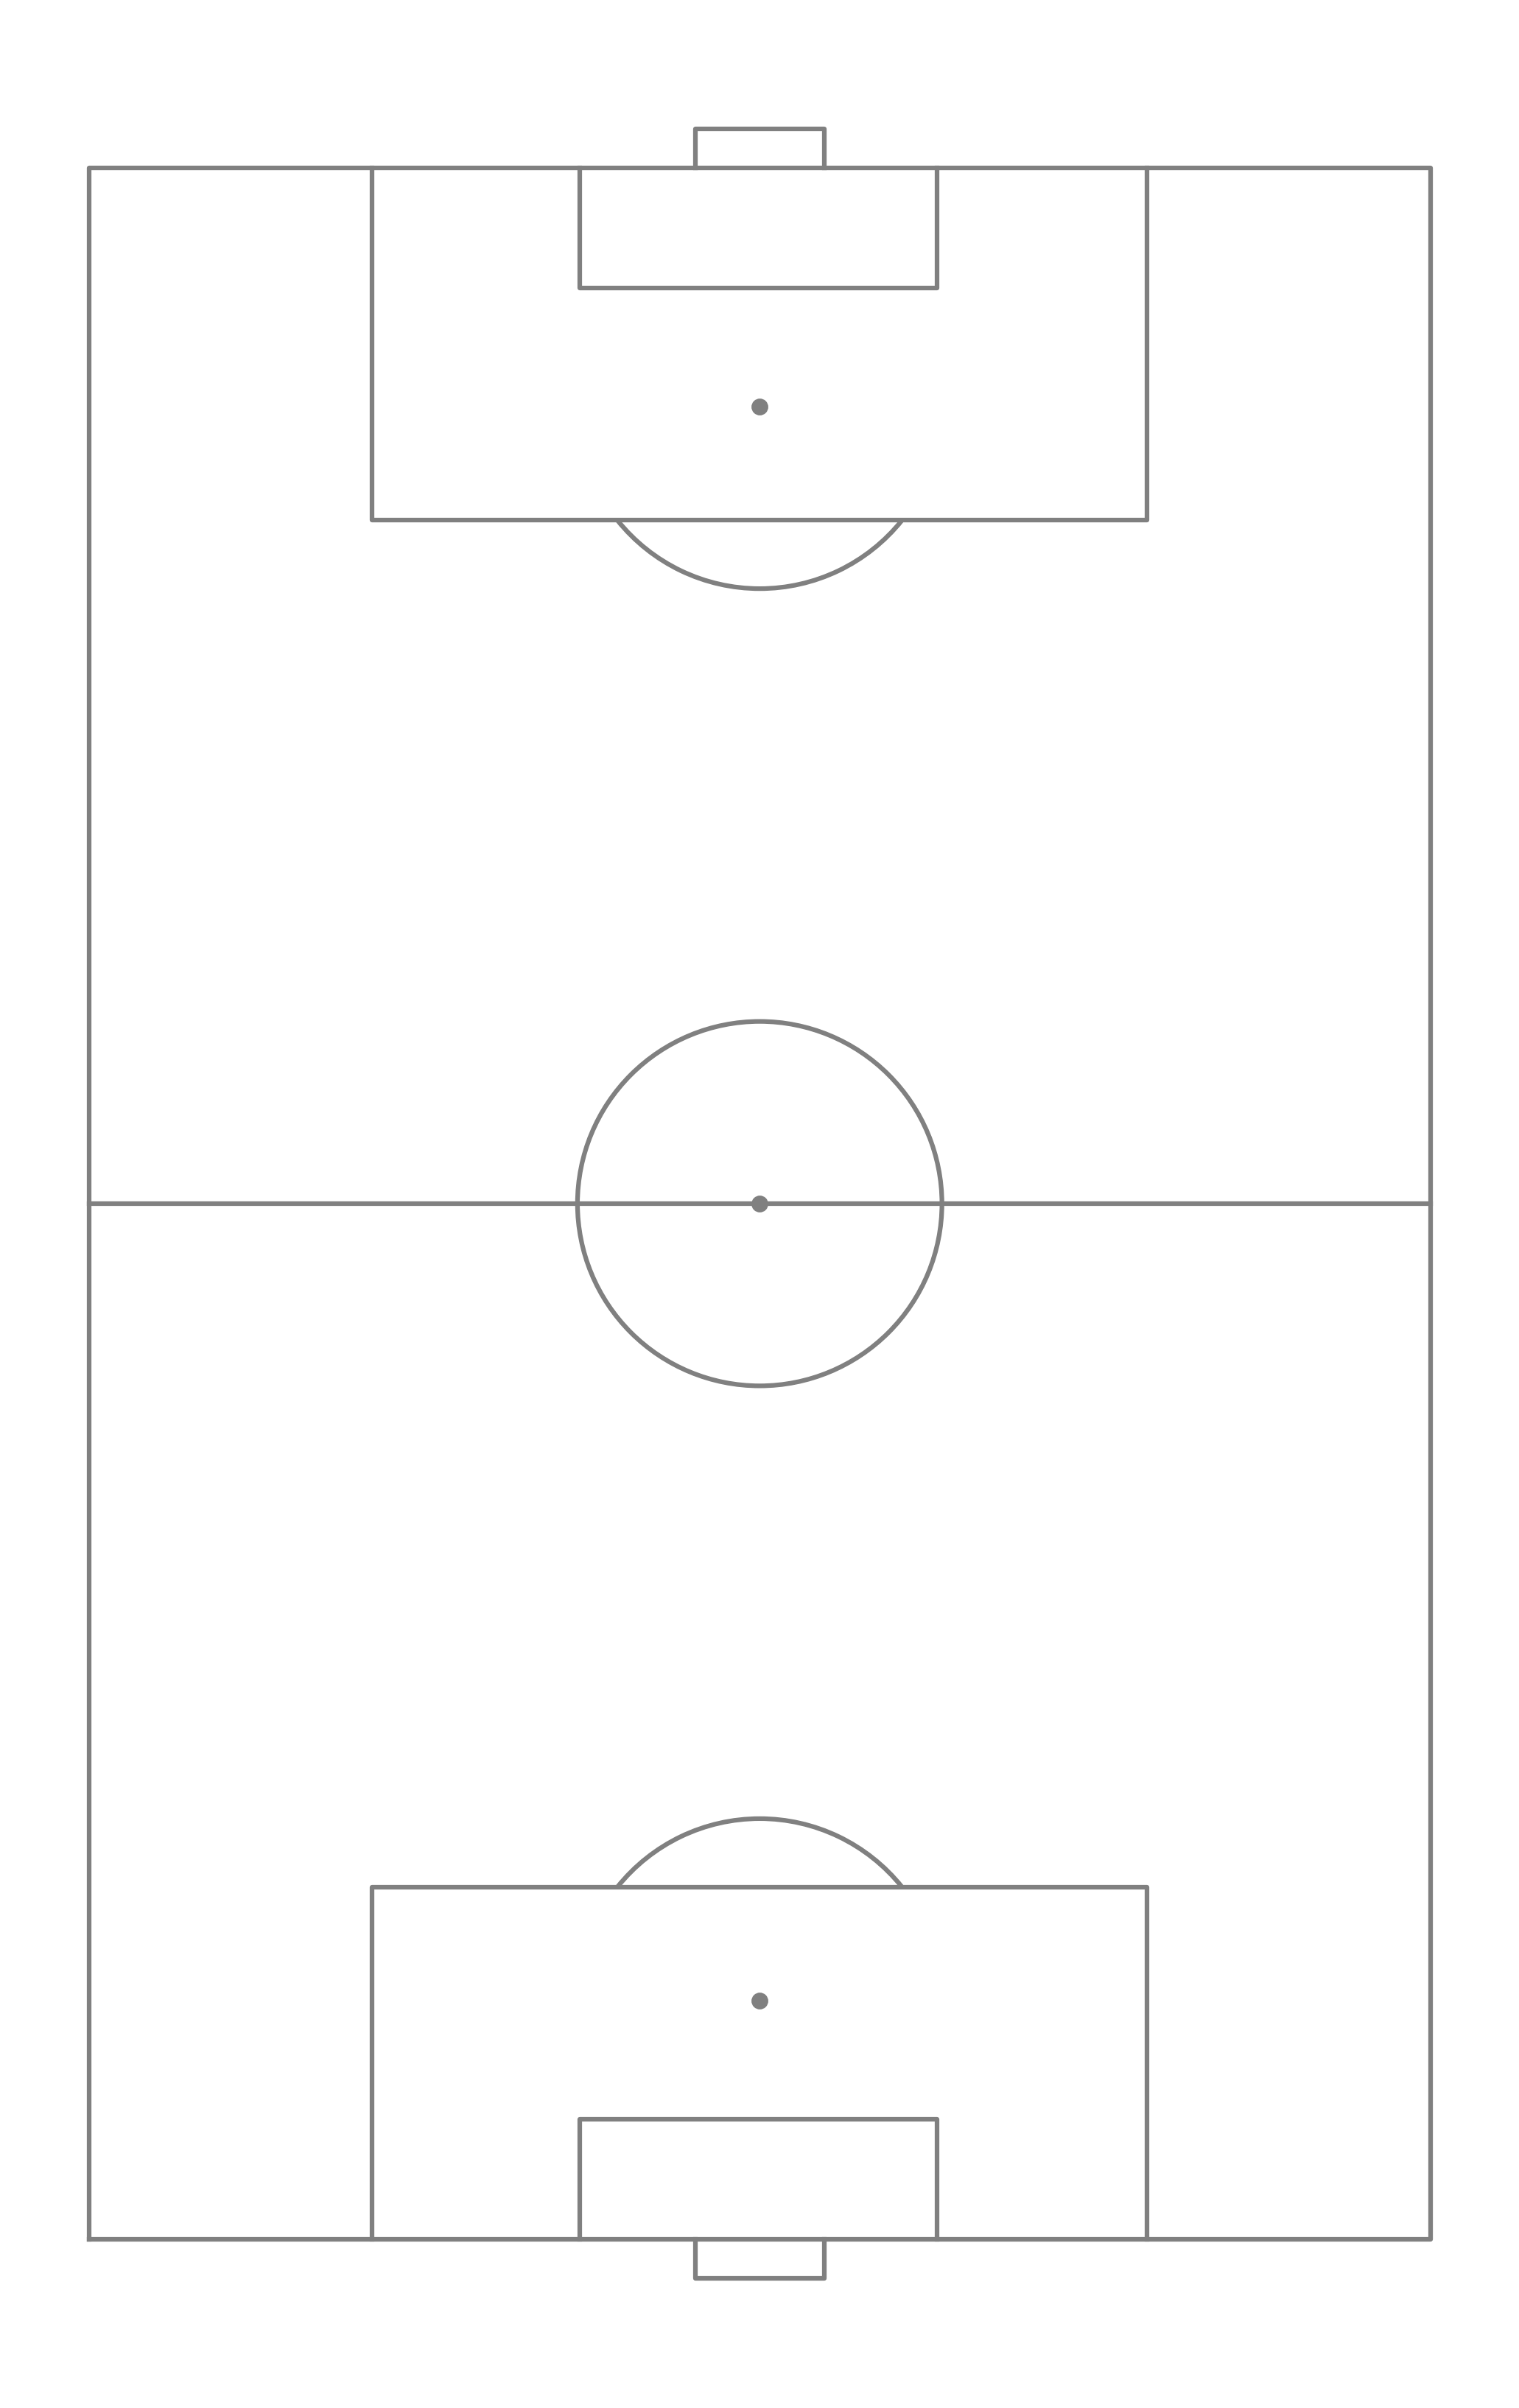
代码封装
下面将上面零散的代码封装成函数。
def draw_pitch(x_min=0, x_max=105,
               y_min=0, y_max=68,
               pitch_color="w",
               line_color="grey",
               line_thickness=1.5,
               point_size=20,
               orientation="horizontal",
               aspect="full",
               ax=None
               ):

    if not ax:
        raise TypeError("This function is intended to be used with an existing fig and ax in order to allow flexibility in plotting of various sizes and in subplots.")


    if orientation.lower().startswith("h"):
        first = 0
        second = 1
        arc_angle = 0

        if aspect == "half":
            ax.set_xlim(x_max / 2, x_max + 5)

    elif orientation.lower().startswith("v"):
        first = 1
        second = 0
        arc_angle = 90

        if aspect == "half":
            ax.set_ylim(x_max / 2, x_max + 5)


    else:
        raise NameError("You must choose one of horizontal or vertical")


    ax.axis("off")

    rect = plt.Rectangle((x_min, y_min),
                         x_max, y_max,
                         facecolor=pitch_color,
                         edgecolor="none",
                         zorder=-2)

    ax.add_artist(rect)

    x_conversion = x_max / 100
    y_conversion = y_max / 100

    pitch_x = [0,5.8,11.5,17,50,83,88.5,94.2,100] # pitch x markings
    pitch_x = [x * x_conversion for x in pitch_x]

    pitch_y = [0, 21.1, 36.6, 50, 63.2, 78.9, 100] # pitch y markings
    pitch_y = [x * y_conversion for x in pitch_y]

    goal_y = [45.2, 54.8] # goal posts
    goal_y = [x * y_conversion for x in goal_y]

    # side and goal lines
    lx1 = [x_min, x_max, x_max, x_min, x_min]
    ly1 = [y_min, y_min, y_max, y_max, y_min]

    # outer boxed
    lx2 = [x_max, pitch_x[5], pitch_x[5], x_max]
    ly2 = [pitch_y[1], pitch_y[1], pitch_y[5], pitch_y[5]]

    lx3 = [0, pitch_x[3], pitch_x[3], 0]
    ly3 = [pitch_y[1], pitch_y[1], pitch_y[5], pitch_y[5]]

    # goals
    lx4 = [x_max, x_max+2, x_max+2, x_max]
    ly4 = [goal_y[0], goal_y[0], goal_y[1], goal_y[1]]

    lx5 = [0, -2, -2, 0]
    ly5 = [goal_y[0], goal_y[0], goal_y[1], goal_y[1]]

    # 6 yard boxes
    lx6 = [x_max, pitch_x[7], pitch_x[7], x_max]
    ly6 = [pitch_y[2],pitch_y[2], pitch_y[4], pitch_y[4]]

    lx7 = [0, pitch_x[1], pitch_x[1], 0]
    ly7 = [pitch_y[2],pitch_y[2], pitch_y[4], pitch_y[4]]


    # Halfway line, penalty spots, and kickoff spot
    lx8 = [pitch_x[4], pitch_x[4]]
    ly8 = [0, y_max]

    lines = [
        [lx1, ly1],
        [lx2, ly2],
        [lx3, ly3],
        [lx4, ly4],
        [lx5, ly5],
        [lx6, ly6],
        [lx7, ly7],
        [lx8, ly8],
        ]

    points = [
        [pitch_x[6], pitch_y[3]],
        [pitch_x[2], pitch_y[3]],
        [pitch_x[4], pitch_y[3]]
        ]

    circle_points = [pitch_x[4], pitch_y[3]]
    arc_points1 = [pitch_x[6], pitch_y[3]]
    arc_points2 = [pitch_x[2], pitch_y[3]]


    for line in lines:
        ax.plot(line[first], line[second],
                color=line_color,
                lw=line_thickness,
                zorder=-1)

    for point in points:
        ax.scatter(point[first], point[second],
                   color=line_color,
                   s=point_size,
                   zorder=-1)

    circle = plt.Circle((circle_points[first], circle_points[second]),
                        x_max * 0.088,
                        lw=line_thickness,
                        color=line_color,
                        fill=False,
                        zorder=-1)

    ax.add_artist(circle)

    arc1 = Arc((arc_points1[first], arc_points1[second]),
               height=x_max * 0.088 * 2,
               width=x_max * 0.088 * 2,
               angle=arc_angle,
               theta1=128.75,
               theta2=231.25,
               color=line_color,
               lw=line_thickness,
               zorder=-1)

    ax.add_artist(arc1)

    arc2 = Arc((arc_points2[first], arc_points2[second]),
               height=x_max * 0.088 * 2,
               width=x_max * 0.088 * 2,
               angle=arc_angle,
               theta1=308.75,
               theta2=51.25,
               color=line_color,
               lw=line_thickness,
               zorder=-1)

    ax.add_artist(arc2)

    ax.set_aspect("equal")

    return ax
现在只需要调用函数来绘制想要的足球场!
background = "#09b309"

fig, ax = plt.subplots(figsize=(11, 7))
fig.set_facecolor(background)

draw_pitch(orientation="h",
           aspect="full",
           pitch_color=background,
           line_color="lightgrey",
           ax=ax)

plt.tight_layout()
plt.show()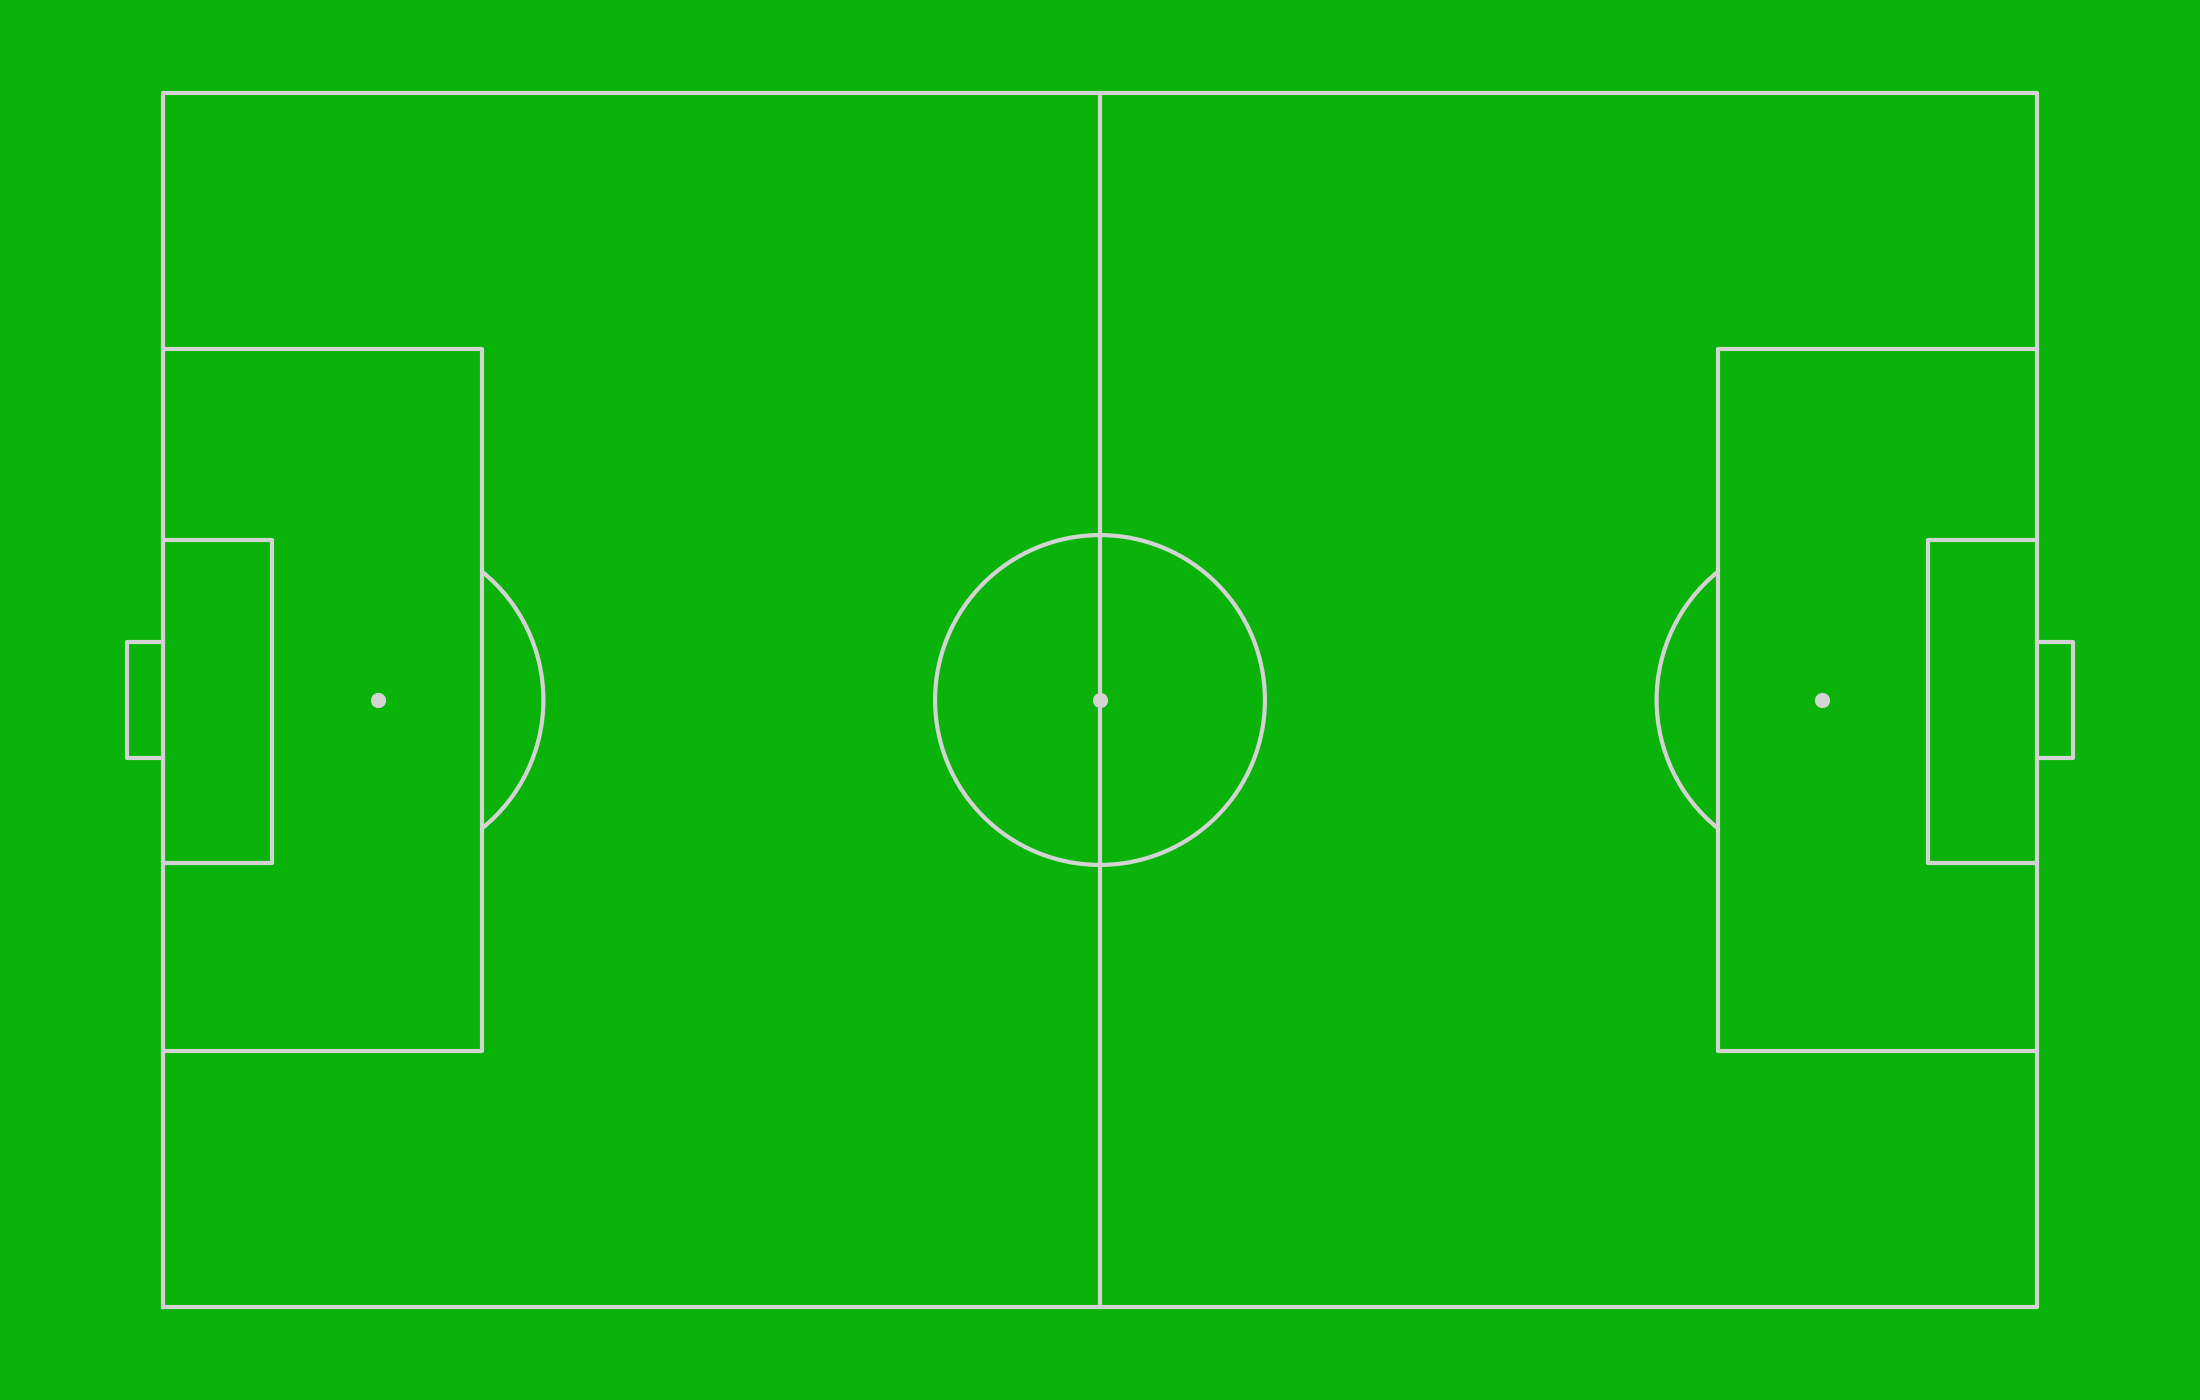
下面这张图是绘制过程gif。

代码仓库:How-To-Python: 人生苦短,我用Python


![[附源码]计算机毕业设计二次元信息分享平台的设计及实现](https://img-blog.csdnimg.cn/a368dfa3bf2842058df943b87303bf0d.png)