在之前文章《S形曲线规划方式汇总》 介绍过贝塞尔曲线方式,并且在Marlin开源工程中也有贝塞尔曲线步进系统的实现方式。本篇介绍伺服系统中基于时间分割法实现的贝塞尔S曲线。
1 贝塞尔曲线路程规划
上文中推导过贝塞尔曲线,本文直接用结论:
对于初速度为V0,末速度为Ve,总加速时间为T的加速过程,其在x*T(0<=x<=1)时刻的6点式贝塞尔曲线速度可以表示为:
v(t)=A*x^5 + B*x^4 + C*x^3 + F
其中:A=6*(Ve-V0) B=15*(V0-Ve) C=10*(Ve-V0) F=V0
则从0试刻走到x*T时刻的总路程S为:

2 Python算法仿真
import matplotlib.pyplot as plt
import math

a = 200000 #加速度
d = 200000 #减速度

#T型速度规划函数
def move_line(len,speed):
    max_speed = speed
    acc_steps = max_speed*max_speed/(2*a)
    dec_steps = max_speed*max_speed/(2*d)
    p = len-acc_steps-dec_steps
    if p<0:
        acc_steps = len*d/(d+a)
        p = 0
        max_speed = math.sqrt(2*a*acc_steps)
    acc_time = float(max_speed)/a
    dec_time = float(max_speed)/d
    cru_time = float(p)/max_speed
    acc_until = acc_steps
    acc_after = acc_steps + p
    return acc_time,dec_time,cru_time,acc_until,acc_after,max_speed

acc_time,dec_time,cru_time,acc_until,acc_after,vm = move_line(8000,20000)

t = 0
Ta = acc_time
Tb = acc_time+cru_time
Tc = acc_time+dec_time+cru_time

#T型速度规划
timeArr = []
posArr = []
speedArr=[]
posPre = 0
while t<Tc:
    t = t+0.001
    if t<Ta:
        pos = 0.5*a*t*t
    elif t < Tb:
        pos = acc_until+vm*(t-Ta)
    else:
        pos = acc_after+vm*(t-Tb)-0.5*d*(t-Tb)*(t-Tb)
    speed = (pos-posPre)*1000
    posPre = pos
    timeArr.append(t)
    posArr.append(pos)
    speedArr.append(speed)

#Bezier曲线规划
#加速阶段贝塞尔曲线参数
v0 = 0
ve = vm
A1 = 6*(ve-v0)/6
B1 = 15*(v0-ve)/5
C1 = 10*(ve-v0)/4
F1 = v0

#减速阶段贝塞尔曲线参数
v0 = vm
ve = 0
A2 = 6*(ve-v0)/6
B2 = 15*(v0-ve)/5
C2 = 10*(ve-v0)/4
F2 = v0

t = 0
posPre = 0
timeArr2 = []
posArr2 = []
speedArr2 = []
while t<Tc:
    t = t+0.001
    if t<Ta:#加速阶段
        x = t/Ta
        pos = Ta*(A1*math.pow(x,6)+B1*math.pow(x,5)+C1*math.pow(x,4)+F1*x)
    elif t<Tb:#匀速阶段
        pos = acc_until+vm*(t-Ta)
    else:#减速阶段
        x = (t-Tb)/(Tc-Tb)
        pos = acc_after+(Tc-Tb)*(A2*math.pow(x,6)+B2*math.pow(x,5)+C2*math.pow(x,4)+F2*x)
    speed = (pos-posPre)*1000
    posPre = pos
    timeArr2.append(t)
    posArr2.append(pos)
    speedArr2.append(speed)

fig1 = plt.figure()
fig1.suptitle('Bezier-pos')
plt.plot(timeArr,posArr)
plt.plot(timeArr2,posArr2,'r')

fig4 = plt.figure()
fig4.suptitle('Bezier-speed')
plt.plot(timeArr,speedArr)
plt.plot(timeArr2,speedArr2,'r')

plt.show()
运行结果:
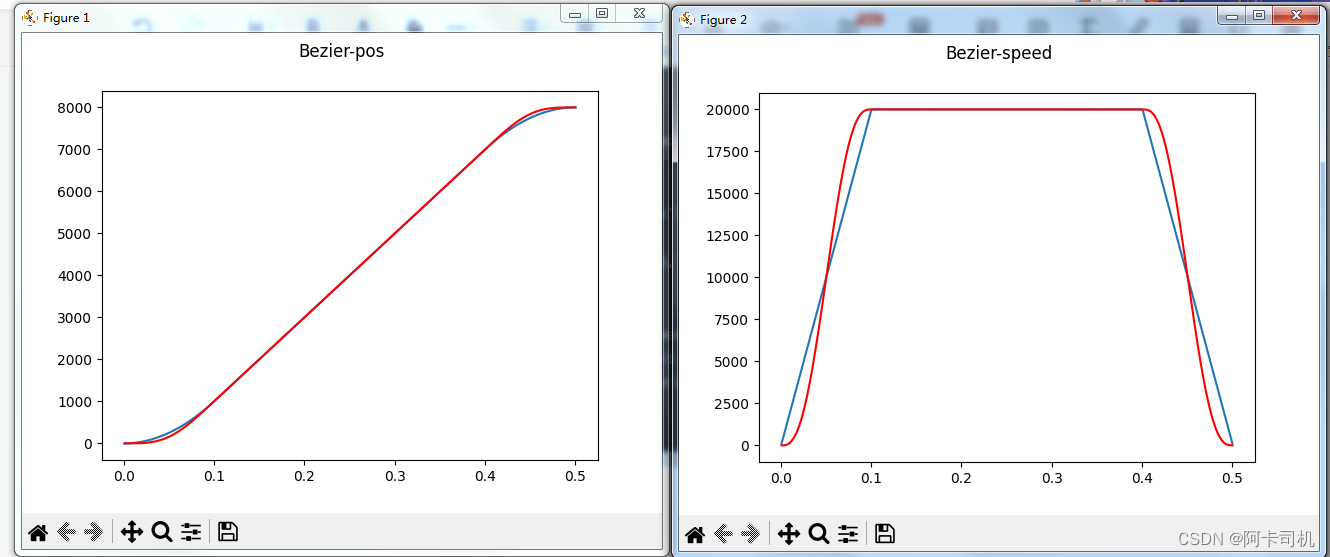
可以看到在加减速阶段Bezier规划的速度曲线相比T型曲线更柔和。

