文章目录
- 一、前言
- 二、实现方法
一、前言
- 任务目标:根据统计在csv中的房屋属性相关数据,预测房屋最终成交价格
- 数据集:《住宅属性数据集》,自取https://download.csdn.net/download/weixin_43721000/87785277
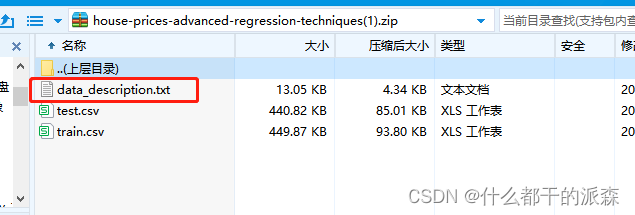
3.数据集字段解释:
这个文件中有字段详细说明
二、实现方法
# 导包
import numpy as np
import pandas as pd
from pandas import DataFrame
import matplotlib.pyplot as plt
import torch
import torch.nn as nn
import os


# 清洗数据 -------------------------------------------------------------------------
def clean_num(numeric_data):
    '''
    # 定义数字清洗方法
    :param numeric_data: 待清洗的数据
    :param means_dict: 归一化的参数记录
    :param maxs_dict: 归一化的参数记录
    :param mins_dict: 归一化的参数记录
    :return:
    '''

    numeric_data.describe()
    print(numeric_data.describe())
    #         MSSubClass        LotArea  ...  GarageYrBlt      SalePrice
    # count  1460.000000    1460.000000  ...  1379.000000    1460.000000
    # mean     56.897260   10516.828082  ...  1978.506164  180921.195890
    # std      42.300571    9981.264932  ...    24.689725   79442.502883
    # min      20.000000    1300.000000  ...  1900.000000   34900.000000
    # 25%      20.000000    7553.500000  ...  1961.000000  129975.000000
    # 50%      50.000000    9478.500000  ...  1980.000000  163000.000000
    # 75%      70.000000   11601.500000  ...  2002.000000  214000.000000
    # max     190.000000  215245.000000  ...  2010.000000  755000.000000
    #
    # [8 rows x 37 columns]
    numeric_data.head(10)
    print(numeric_data.head(10))
    #    MSSubClass  LotArea  OverallQual  ...  MasVnrArea  GarageYrBlt  SalePrice
    # 0          60     8450            7  ...       196.0       2003.0     208500
    # 1          20     9600            6  ...         0.0       1976.0     181500
    # 2          60    11250            7  ...       162.0       2001.0     223500
    # 3          70     9550            7  ...         0.0       1998.0     140000
    # 4          60    14260            8  ...       350.0       2000.0     250000
    # 5          50    14115            5  ...         0.0       1993.0     143000
    # 6          20    10084            8  ...       186.0       2004.0     307000
    # 7          60    10382            7  ...       240.0       1973.0     200000
    # 8          50     6120            7  ...         0.0       1931.0     129900
    # 9         190     7420            5  ...         0.0       1939.0     118000
    #
    # [10 rows x 37 columns]
    #
    # Process finished with exit code 0


    # 找出包含 nan 值的列
    nan_columns = np.any(pd.isna(numeric_data), axis = 0)
    nan_columns = list(nan_columns[nan_columns == True].index)

    # 将 nan 替换为 0
    for col in nan_columns:
        numeric_data[col] = numeric_data[col].fillna(0)


    return numeric_data


def clean_text(non_numeric_data):
    '''
    # 定义数字清洗方法
    :param non_numeric_data: 待清洗的数据
    :param means_dict: 归一化的参数记录
    :param maxs_dict: 归一化的参数记录
    :param mins_dict: 归一化的参数记录
    :return:
    '''

    print(non_numeric_data.describe())
    #        MSZoning Street Alley LotShape  ...  Fence MiscFeature SaleType SaleCondition
    # count      1460   1460    91     1460  ...    281          54     1460          1460
    # unique        5      2     2        4  ...      4           4        9             6
    # top          RL   Pave  Grvl      Reg  ...  MnPrv        Shed       WD        Normal
    # freq       1151   1454    50      925  ...    157          49     1267          1198
    #
    # [4 rows x 43 columns]


    # 将所有非数字列的 nan,替换为字符串 ‘N/A’
    nan_columns = np.any(pd.isna(non_numeric_data), axis=0)
    nan_columns = list(nan_columns[nan_columns == True].index)
    print(nan_columns)

    for col in nan_columns:
        non_numeric_data[col] = non_numeric_data[col].fillna('N/A')

    # # 检查一下还有没有nan值
    # nan_columns = np.any(pd.isna(non_numeric_data), axis = 0)
    # nan_columns = list(nan_columns[nan_columns == True].index)
    # print(nan_columns)
    # # []


    # 将字符串标签全部换成数字
    mapping_table = dict()

    for col in non_numeric_columns:
        curr_mapping_table = dict()

        unique_values = pd.unique(non_numeric_data[col])
        for inx, v in enumerate(unique_values):
            curr_mapping_table[v] = inx + 1
            non_numeric_data[col] = non_numeric_data[col].replace(v, inx + 1)

        mapping_table[col] = curr_mapping_table

    print(non_numeric_data.head())
    #    MSZoning  Street  Alley  ...  MiscFeature  SaleType  SaleCondition
    # 0         1       1      1  ...            1         1              1
    # 1         1       1      1  ...            1         1              1
    # 2         1       1      1  ...            1         1              1
    # 3         1       1      1  ...            1         1              2
    # 4         1       1      1  ...            1         1              1
    #
    # [5 rows x 43 columns]


    return non_numeric_data


# 定义网络 ---------------------------------------------
class Net(nn.Module):
    def __init__(self, D_in, H1, H2, H3, D_out):
        super(Net, self).__init__()

        self.linear1 = nn.Linear(D_in, H1)
        self.linear2 = nn.Linear(H1, H2)
        self.linear3 = nn.Linear(H2, H3)
        self.linear4 = nn.Linear(H3, D_out)

    def forward(self, x):
        y_pred = self.linear1(x).clamp(min=0)
        y_pred = self.linear2(y_pred).clamp(min=0)
        y_pred = self.linear3(y_pred).clamp(min=0)
        y_pred = self.linear4(y_pred)
        return y_pred


def draw_losses(loss_list):
    # 绘制损失值变化趋势
    plt.figure(figsize=(6, 4))
    plt.plot(range(len(loss_list)), losses, label='loss_value')

    plt.legend(loc='upper right')
    plt.show()


if __name__ == '__main__':

    # 训练部分 ========================================================================
    print(os.listdir("./data"))
    # ['data_description.txt', 'test.csv', 'train.csv']

    # 加载训练数据 ----------------------------------------------------
    raw_data = pd.read_csv('./data/train.csv')
    raw_data.describe()
    print(raw_data.describe())
    #                 Id   MSSubClass  ...       YrSold      SalePrice
    # count  1460.000000  1460.000000  ...  1460.000000    1460.000000
    # mean    730.500000    56.897260  ...  2007.815753  180921.195890
    # std     421.610009    42.300571  ...     1.328095   79442.502883
    # min       1.000000    20.000000  ...  2006.000000   34900.000000
    # 25%     365.750000    20.000000  ...  2007.000000  129975.000000
    # 50%     730.500000    50.000000  ...  2008.000000  163000.000000
    # 75%    1095.250000    70.000000  ...  2009.000000  214000.000000
    # max    1460.000000   190.000000  ...  2010.000000  755000.000000
    #
    # [8 rows x 38 columns]
    raw_data.head(10)
    print(raw_data.head(10))
    #    Id  MSSubClass MSZoning  ...  SaleType  SaleCondition SalePrice
    # 0   1          60       RL  ...        WD         Normal    208500
    # 1   2          20       RL  ...        WD         Normal    181500
    # 2   3          60       RL  ...        WD         Normal    223500
    # 3   4          70       RL  ...        WD        Abnorml    140000
    # 4   5          60       RL  ...        WD         Normal    250000
    # 5   6          50       RL  ...        WD         Normal    143000
    # 6   7          20       RL  ...        WD         Normal    307000
    # 7   8          60       RL  ...        WD         Normal    200000
    # 8   9          50       RM  ...        WD        Abnorml    129900
    # 9  10         190       RL  ...        WD         Normal    118000
    #
    # [10 rows x 81 columns]
    #
    # Process finished with exit code 0


    # 分离数字样本列、非数字样本列、标签列 -----------------------------------------------------------
    # numeric_colmuns、non_numeric_columns、label_column
    label_column = 'SalePrice'
    numeric_colmuns = []
    numeric_colmuns.extend(list(raw_data.dtypes[raw_data.dtypes == np.int64].index))
    numeric_colmuns.extend(list(raw_data.dtypes[raw_data.dtypes == np.float64].index))
    numeric_colmuns.remove(label_column)    # 删除售价列
    numeric_colmuns.remove('Id')            # 删除id列

    non_numeric_columns = [col for col in list(raw_data.columns) if col not in numeric_colmuns]
    non_numeric_columns.remove(label_column)    # 删除售价列
    non_numeric_columns.remove('Id')        # 删除id列
    # -------------------------------------------------------------------------------------------


    # 清洗数字样本、非数字样本、标签 ------------------------------------------
    # 用于记录归一化参数的字典
    means_dict, maxs_dict, mins_dict = dict(), dict(), dict()


    numeric_data = DataFrame(raw_data, columns=numeric_colmuns)
    numeric_data = clean_num(numeric_data)

    non_numeric_data = DataFrame(raw_data, columns=non_numeric_columns)
    non_numeric_data = clean_text(non_numeric_data)

    y_data = DataFrame(raw_data, columns=[label_column])
    y_data = clean_num(y_data)
    # --------------------------------------------------------------------

    # 合并pandas
    x_df = DataFrame(pd.concat([numeric_data, non_numeric_data], axis=1), columns=numeric_colmuns+non_numeric_columns)
    # 记录归一化的参数
    for col in x_df:
        means_dict[col] = x_df[col].mean()
        maxs_dict[col] = x_df[col].max()
        mins_dict[col] = x_df[col].min()
    # 归一化到 [-1,1]之间
    for col in x_df:
        x_df[col] = (x_df[col] - means_dict[col]) / (maxs_dict[col] - mins_dict[col])
    print(x_df.head())
    #    MSSubClass   LotArea  OverallQual  ...  MiscFeature  SaleType  SaleCondition
    # 0    0.018251 -0.009661     0.100076  ...    -0.010788 -0.029366          -0.07
    # 1   -0.217043 -0.004285    -0.011035  ...    -0.010788 -0.029366          -0.07
    # 2    0.018251  0.003427     0.100076  ...    -0.010788 -0.029366          -0.07
    # 3    0.077075 -0.004519     0.100076  ...    -0.010788 -0.029366           0.13
    # 4    0.018251  0.017496     0.211187  ...    -0.010788 -0.029366          -0.07

    y_df = DataFrame(y_data, columns=[label_column])
    # 记录归一化的参数
    for col in y_df:
        means_dict[col] = y_df[col].mean()
        maxs_dict[col] = y_df[col].max()
        mins_dict[col] = y_df[col].min()
    # 归一化到 [-1,1]之间
    for col in y_df:
        y_df[col] = (y_df[col] - means_dict[col]) / (maxs_dict[col] - mins_dict[col])
    print(y_df.head())
    #    SalePrice
    # 0   0.038299
    # 1   0.000804
    # 2   0.059129
    # 3  -0.056827
    # 4   0.095929

    # 转 tensor
    x_tensor = torch.tensor(x_df.values, dtype=torch.float)
    y_tensor = torch.tensor(y_df.values, dtype=torch.float)

    print(x_tensor.shape, y_tensor.shape)
    # torch.Size([1460, 79]) torch.Size([1460, 1])


    # 定义输入、输出层维度
    D_in, D_out = x_tensor.shape[1], y_tensor.shape[1]
    # 定义中间层网络维度
    H1, H2, H3 = 500, 1000, 200

    # 初始化网络
    model = Net(D_in, H1, H2, H3, D_out)
    # 定义损失函数(均方误差)
    criterion = nn.MSELoss(reduction='sum')
    # 定义优化器、学习率
    optimizer = torch.optim.Adam(model.parameters(), lr=1e-4 * 2)

    # 训练
    losses = []
    for t in range(500):
        y_pred = model(x_tensor)                # 前向传播

        loss = criterion(y_pred, y_tensor)      # 计算损失
        print(t, loss.item())
        losses.append(loss.item())              # 记录损失

        # 遇到nan值就终止训练(之前清洗过nan值了,此处应该不会出现nan)
        if torch.isnan(loss):
            break

        optimizer.zero_grad()                   # 梯度清零
        loss.backward()                         # 反向传播
        optimizer.step()                        # 更新梯度

    # 绘制损失值变化图像 ------------
    draw_losses(loss_list=losses)
    # ---------------------------


    # 预测部分 ===============================================================================
    # 加载预测数据
    raw_test_data = pd.read_csv('./data/test.csv')
    print(raw_test_data.describe())
    #                 Id   MSSubClass  ...       MoSold       YrSold
    # count  1459.000000  1459.000000  ...  1459.000000  1459.000000
    # mean   2190.000000    57.378341  ...     6.104181  2007.769705
    # std     421.321334    42.746880  ...     2.722432     1.301740
    # min    1461.000000    20.000000  ...     1.000000  2006.000000
    # 25%    1825.500000    20.000000  ...     4.000000  2007.000000
    # 50%    2190.000000    50.000000  ...     6.000000  2008.000000
    # 75%    2554.500000    70.000000  ...     8.000000  2009.000000
    # max    2919.000000   190.000000  ...    12.000000  2010.000000
    #
    # [8 rows x 37 columns]
    print(raw_test_data.describe())
    #         MSSubClass       LotArea  ...   MasVnrArea  GarageYrBlt
    # count  1459.000000   1459.000000  ...  1444.000000  1381.000000
    # mean     57.378341   9819.161069  ...   100.709141  1977.721217
    # std      42.746880   4955.517327  ...   177.625900    26.431175
    # min      20.000000   1470.000000  ...     0.000000  1895.000000
    # 25%      20.000000   7391.000000  ...     0.000000  1959.000000
    # 50%      50.000000   9399.000000  ...     0.000000  1979.000000
    # 75%      70.000000  11517.500000  ...   164.000000  2002.000000
    # max     190.000000  56600.000000  ...  1290.000000  2207.000000

    # 清洗数字样本、非数字样本 ------------------------------------------
    numeric_data = DataFrame(raw_test_data, columns=numeric_colmuns)
    numeric_data = clean_num(numeric_data)

    non_numeric_data = DataFrame(raw_test_data, columns=non_numeric_columns)
    non_numeric_data = clean_text(non_numeric_data)
    # --------------------------------------------------------------------

    # 合并pandas
    x_df = DataFrame(pd.concat([numeric_data, non_numeric_data], axis=1), columns=numeric_colmuns+non_numeric_columns)
    # 归一化
    for col in x_df.columns:
        x_df[col] = (x_df[col] - means_dict[col]) / (maxs_dict[col] - mins_dict[col])

    print(x_df.head())
    #    MSSubClass   LotArea  OverallQual  ...  MiscFeature  SaleType  SaleCondition
    # 0   -0.338813 -0.178109    -0.688743  ...    -0.010788 -0.029366          -0.07
    # 1   -0.338813 -0.178108    -0.676398  ...     0.239212 -0.029366          -0.07
    # 2   -0.337429 -0.178108    -0.688743  ...    -0.010788 -0.029366          -0.07
    # 3   -0.337429 -0.178109    -0.676398  ...    -0.010788 -0.029366          -0.07
    # 4   -0.335353 -0.178111    -0.651706  ...    -0.010788 -0.029366          -0.07
    #
    # [5 rows x 79 columns]

    # 转 tensor
    x_tensor = torch.tensor(x_df.values, dtype=torch.float)

    print(x_tensor.shape)
    # torch.Size([1459, 79])

    test_y = model(x_tensor)
    print(test_y)

    # 转pandas
    result = DataFrame(test_y.data.numpy(), columns=[label_column])
    result[label_column] = result[label_column].fillna(0)

    # 归一化数据还原
    result[label_column] = result[label_column] * (maxs_dict[label_column] - mins_dict[label_column]) + means_dict[label_column]

    # 加入id列
    result['Id'] = np.array(result.index)

    # 调整列顺序
    result = DataFrame(result, columns=['Id', label_column])

    # 打印预测结果
    print(result)
    #         Id      SalePrice
    # 0        0  125925.795535
    # 1        1  159832.054257
    # 2        2  170479.123832
    # 3        3  181463.404637
    # 4        4  177941.813524
    # ...    ...            ...
    # 1454  1454  104792.782963
    # 1455  1455  107778.539142
    # 1456  1456  173118.472892
    # 1457  1457  125831.143327
    # 1458  1458  237642.311684
    #
    # [1459 rows x 2 columns]
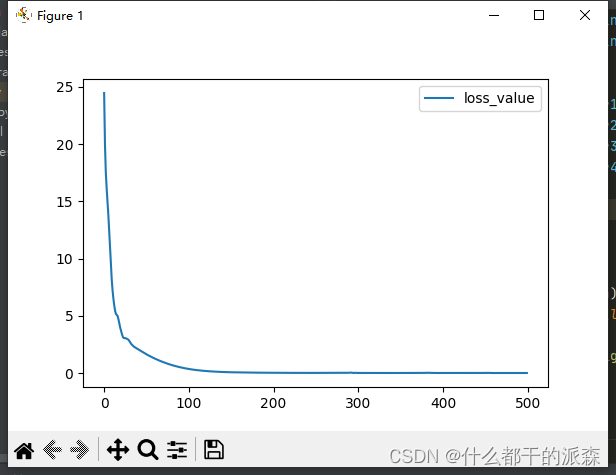
损失图像↓

![[PyTorch][chapter 35][Batch Normalize]](https://img-blog.csdnimg.cn/32f6c77a462e465e98644bf6de4f38fa.png)

