机器学习——线性回归
文章目录
- 机器学习——线性回归
- @[toc]
- 1 模型设定
- 2 训练模型
- 3 模型预测
- 4 交叉验证
文章目录
- 机器学习——线性回归
- @[toc]
- 1 模型设定
- 2 训练模型
- 3 模型预测
- 4 交叉验证
基于Python实现线性回归、预测和建模评估。
1 模型设定
以Boston数据集为例,其中MEDV是标签,其余均为特征变量
- CRIM per capita crime rate by town
- ZN proportion of residential land zoned for lots over 25,000 sq.ft.
- INDUS proportion of non-retail business acres per town
- CHAS Charles River dummy variable (= 1 if tract bounds river; 0 otherwise)
- NOX nitric oxides concentration (parts per 10 million)
- RM average number of rooms per dwelling
- AGE proportion of owner-occupied units built prior to 1940
- DIS weighted distances to five Boston employment centres
- RAD index of accessibility to radial highways
- TAX full-value property-tax rate per $10,000
- PTRATIO pupil-teacher ratio by town
- B 1000(Bk - 0.63)^2 where Bk is the proportion of blacks by town
- LSTAT % lower status of the population
- MEDV Median value of owner-occupied homes in $1000’s
为实现对MEDV的预测,构建如下线性回归模型
M
E
D
V
=
a
0
+
a
1
C
R
I
M
+
a
2
Z
N
+
⋯
+
a
13
L
S
T
A
T
+
u
MEDV = a_0+a_1CRIM +a_2ZN +\dots+ a_{13}LSTAT+u
MEDV=a0+a1CRIM+a2ZN+⋯+a13LSTAT+u
其中
u
u
u为扰动项。与计量经济学相区别,这里无需对
u
u
u的特征做出假定。
2 训练模型
import statsmodels.api as sm
import statsmodels.formula.api as smf
import seaborn as sns
import pandas as pd
import numpy as np
import matplotlib.pyplot as plt
from sklearn.model_selection import train_test_split
from sklearn.linear_model import LinearRegression
from sklearn.metrics import mean_squared_error, r2_score

data = pd.read_csv('boston.csv')
# 标签
y = data['MEDV']
# 特征变量
x = data.iloc[0:506, 0:13]
# 训练集、测试集分割
X_train, X_test, y_train, y_test = train_test_split(x, y, test_size=0.3, random_state=0)
# 基于训练集线性回归
model = LinearRegression()
model.fit(X_train, y_train)
# 回归系数
print(f'回归系数\n{model.coef_}\n')

# [-1.21310401e-01  4.44664254e-02  1.13416945e-02  2.51124642e+00
#  -1.62312529e+01  3.85906801e+00 -9.98516565e-03 -1.50026956e+00
#   2.42143466e-01 -1.10716124e-02 -1.01775264e+00  6.81446545e-03
#  -4.86738066e-01]
3 模型预测
# 基于测试集进行预测
pred = model.predict(X_test)
4 交叉验证
通常选择10折或5折交叉验证,评估模型的预测能力。当均方误差MSE越小表明预测效果越强。对全样本使用交叉验证:
from sklearn.model_selection import KFold
from sklearn.model_selection import cross_val_score
from sklearn.model_selection import LeaveOneOut
from sklearn.model_selection import RepeatedKFold
kfold = KFold(n_splits=10, shuffle=True, random_state=1)
scores_mse = -cross_val_score(model, x, y, cv=kfold, scoring='neg_mean_squared_error')
print('每次交叉差验证的回归损失:', scores_mse)
print('十折交叉验证MSE期望:', scores_mse.mean())
#每次鞅差验证的回归损失: [20.54427466 24.47650033  9.49619045 48.63290854 12.11906454 #18.14673907 17.53359386 38.67822303 34.22829546 13.73556966]
#折交叉验证MSE期望: 23.759135960073124
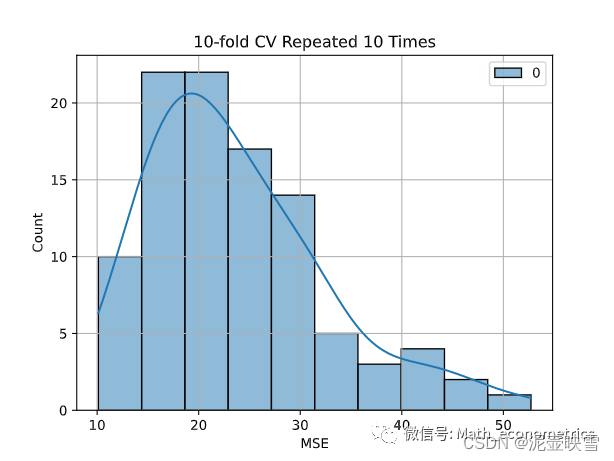
为保守起见,重复进行十折交叉验证,重复次数为M,共得到10M个MSE。
rkfold = RepeatedKFold(n_splits=10, n_repeats=10, random_state=1234567)
scores_mse = -cross_val_score(model, x, y, cv=rkfold, scoring='neg_mean_squared_error')
print('重复10次的10折交叉验证均值:\n',scores_mse.mean())
# 重复10次的10折交叉验证均值:\n 23.719695852306927
# 均方误差损失分布直方图
sns.histplot(pd.DataFrame(scores_mse), color='green',kde=True)
plt.xlabel('MSE')
plt.title('10-fold CV Repeated 10 Times')
plt.grid()
如果样本量较小,可使用留一法 LeaveOneOut
loo = LeaveOneOut()
scores_mse = -cross_val_score(model, x, y, cv=loo, scoring='neg_mean_squared_error')
print('留一法MSE期望:\n',scores_mse.mean() )
#留一法MSE期望:23.725745519476153
陈强,《机器学习及Python应用》高等教育出版社, 2021年3月
