文章目录
- brief
- 寻找差异基因部分
- 注释细胞部分
- 详细参数
brief
细胞注释大概分为两步:差异基因 --> marker genes —> map reference
差异基因可以是表达量上存在差异也可以是表达细胞占比上存在差异,通常二者兼顾考虑。
marker genes 个人理解为出现这个基因就可以认为是这种细胞,所以才称为marker gene,marker gene 不等于 difference expression gene,二者有区别和联系。
map reference就是与细胞系的表达谱进行比较,如果细胞相似那么表达谱也会很相似;或者是与上面提到的marker genes进行比较,如果出现了某些marker genes则可以认为其是某一类细胞,但是没有“识别到”marker gene不代表该细胞不属于特殊的类群,可能是没检测到。
singleR链接。
singleR官方链接。
寻找差异基因部分
- 数据准备阶段
library(dplyr)
library(Seurat)
library(patchwork)
library(sctransform)
library(ggplot2)
# devtools::install_github('satijalab/seurat-data')
library(SeuratData)


rm(list=ls())


# 获取测试数据集
# For convenience, we distribute this dataset through our SeuratData package.
# install dataset
InstallData("ifnb")
# load dataset
LoadData("ifnb")


# split the dataset into a list of two seurat objects (stim and CTRL)
ifnb.list <- SplitObject(ifnb, split.by = "stim")

# Performing integration on datasets normalized with logNormalization
# normalize and identify variable features for each dataset independently
ifnb.list <- lapply(X = ifnb.list, FUN = function(x) {
  x <- NormalizeData(x)
  x <- FindVariableFeatures(x, selection.method = "vst", nfeatures = 2000)
})


features <- SelectIntegrationFeatures(object.list = ifnb.list)

immune.anchors <- FindIntegrationAnchors(object.list = ifnb.list, anchor.features = features)

immune.combined <- IntegrateData(anchorset = immune.anchors)

str(immune.combined)
- 寻找差异基因
DefaultAssay(immune.combined) <- "integrated"
immune.combined <- ScaleData(immune.combined, verbose = FALSE)
immune.combined <- RunPCA(immune.combined, npcs = 30, verbose = FALSE)
immune.combined <- RunUMAP(immune.combined, reduction = "pca", dims = 1:30)
immune.combined <- FindNeighbors(immune.combined, reduction = "pca", dims = 1:30)
immune.combined <- FindClusters(immune.combined, resolution = 0.5)
head(immune.combined)
levels(immune.combined)
# 寻找差异基因
# Find differentially expressed features between seurat_clusters 0 and seurat_clusters 11
monocyte.de.markers <- FindMarkers(immune.combined, ident.1 = "0", ident.2 = "11",only.pos = TRUE)
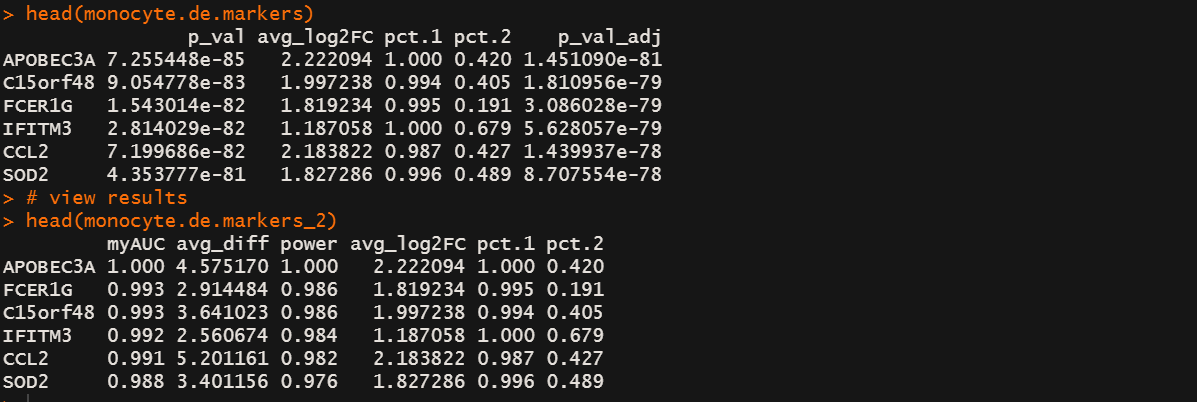
# view results
head(monocyte.de.markers)
# 寻找差异基因
# Find differentially expressed features between seurat_clusters 0 and seurat_clusters 11
monocyte.de.markers_2 <- FindMarkers(immune.combined, ident.1 = "0",
ident.2 = "11",only.pos = TRUE,test.use = "roc")
# view results
head(monocyte.de.markers_2)
x <- intersect(rownames(monocyte.de.markers),rownames(monocyte.de.markers_2))
length(rownames(monocyte.de.markers))
length(rownames(monocyte.de.markers_2))
length(x)
注释细胞部分
# 细胞注释
# cell cluster annotation using SingleR  <==================
library(SingleR)
library(SingleCellExperiment)
library(celldex)

# 获取reference
hpca.se <- HumanPrimaryCellAtlasData()

# 这里是用RNA下面的counts作为query与reference去比较
counts <- GetAssayData(immune.combined[["RNA"]], slot="counts")
pred.sce <- SingleR(test = counts, ref = hpca.se, labels = hpca.se$label.main,
                    clusters=immune.combined@meta.data$seurat_clusters)
write.table(pred.sce,"sce_singler_1.annotation.xls",sep="\t", quote=FALSE)

# 这里是用integrated下面的data作为query与reference去比较
counts <- GetAssayData(immune.combined[["integrated"]], slot="data")
pred.sce_2 <- SingleR(test = counts, ref = hpca.se, labels = hpca.se$label.main,
                    clusters=immune.combined@meta.data$seurat_clusters)
write.table(pred.sce_2,"sce_singler_2.annotation.xls",sep="\t", quote=FALSE)

pred.sce$labels
pred.sce_2$labels

# 更新cluster对应的细胞类群名称
new.cluster.ids <- pred.sce$labels
names(new.cluster.ids) <- levels(immune.combined)
immune.combined <- RenameIdents(immune.combined, new.cluster.ids)

##########################################################################################
# 对细胞子类进行DE查找和注释。这里以T细胞大类为演示对象   <======================

sce_T <- FindSubCluster(immune.combined, cluster="T_cells", graph.name="integrated_snn",
                         subcluster.name="T_sub", resolution = 0.5, algorithm = 1)

T_sub_clusters <- unique(sce_T$T_sub)[grep("T_cells", unique(sce_T$T_sub))]

for (i in T_sub_clusters){
  markers <- FindMarkers(immune.combined, ident.1 = i, only.pos=T, assay="RNA", group.by = "T_sub")
  write.table(markers, file=paste("T_sub/cluster_",i,"_pos.markers.xls", sep=""), sep="\t", quote=F)
}

# 手动指定细胞类群的名称
immune.combined@meta.data[immune.combined@meta.data$T_sub == "T_cells_0",]$cell_cluster_rename <- "CD8+ T cell"
immune.combined@meta.data[immune.combined@meta.data$T_sub == "T_cells_1",]$cell_cluster_rename <- "CD4+ T cell"
详细参数
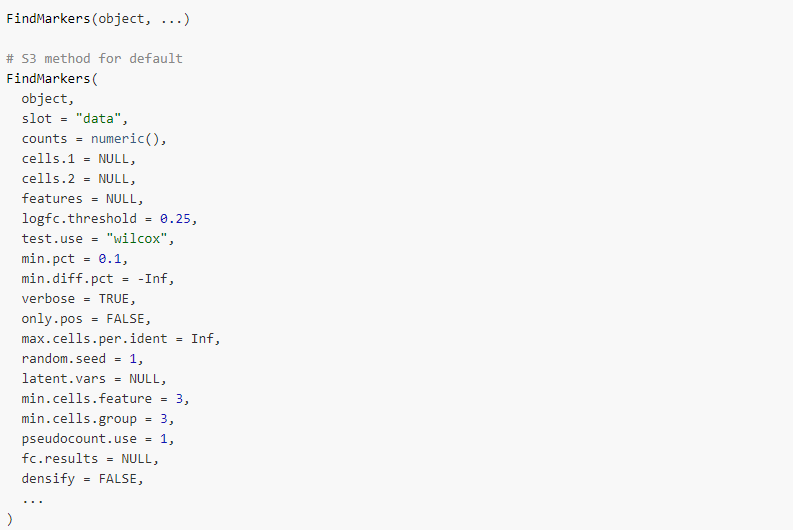
-
object
An object -
slot
Slot to pull data from; note that if test.use is “negbinom”, “poisson”, or “DESeq2”, slot will be set to “counts” -
counts
Count matrix if using scale.data for DE tests. This is used for computing pct.1 and pct.2 and for filtering features based on fraction expressing -
cells.1
Vector of cell names belonging to group 1 -
cells.2
Vector of cell names belonging to group 2 -
features
Genes to test. Default is to use all genes -
logfc.threshold
Limit testing to genes which show, on average, at least X-fold difference (log-scale) between the two groups of cells. Default is 0.25 Increasing logfc.threshold speeds up the function, but can miss weaker signals. -
test.use
Denotes which test to use. Available options are:-
“wilcox” : Identifies differentially expressed genes between two groups of cells using a Wilcoxon Rank Sum test (default)
-
“bimod” : Likelihood-ratio test for single cell gene expression, (McDavid et al., Bioinformatics, 2013)
-
“roc” : Identifies ‘markers’ of gene expression using ROC analysis. For each gene, evaluates (using AUC) a classifier built on that gene alone, to classify between two groups of cells. An AUC value of 1 means that expression values for this gene alone can perfectly classify the two groupings (i.e. Each of the cells in cells.1 exhibit a higher level than each of the cells in cells.2). An AUC value of 0 also means there is perfect classification, but in the other direction. A value of 0.5 implies that the gene has no predictive power to classify the two groups. Returns a ‘predictive power’ (abs(AUC-0.5) * 2) ranked matrix of putative differentially expressed genes.
-
“t” : Identify differentially expressed genes between two groups of cells using the Student’s t-test.
-
“negbinom” : Identifies differentially expressed genes between two groups of cells using a negative binomial generalized linear model. Use only for UMI-based datasets
-
“poisson” : Identifies differentially expressed genes between two groups of cells using a poisson generalized linear model. Use only for UMI-based datasets
-
“LR” : Uses a logistic regression framework to determine differentially expressed genes. Constructs a logistic regression model predicting group membership based on each feature individually and compares this to a null model with a likelihood ratio test.
-
“MAST” : Identifies differentially expressed genes between two groups of cells using a hurdle model tailored to scRNA-seq data. Utilizes the MAST package to run the DE testing.
-
“DESeq2” : Identifies differentially expressed genes between two groups of cells based on a model using DESeq2 which uses a negative binomial distribution (Love et al, Genome Biology, 2014).This test does not support pre-filtering of genes based on average difference (or percent detection rate) between cell groups. However, genes may be pre-filtered based on their minimum detection rate (min.pct) across both cell groups. To use this method, please install DESeq2, using the instructions at https://bioconductor.org/packages/release/bioc/html/DESeq2.html
-
-
min.pct
only test genes that are detected in a minimum fraction of min.pct cells in either of the two populations. Meant to speed up the function by not testing genes that are very infrequently expressed. Default is 0.1 -
min.diff.pct
only test genes that show a minimum difference in the fraction of detection between the two groups. Set to -Inf by default -
verbose
Print a progress bar once expression testing begins -
only.pos
Only return positive markers (FALSE by default) -
max.cells.per.ident
Down sample each identity class to a max number. Default is no downsampling. Not activated by default (set to Inf) -
random.seed
Random seed for downsampling -
latent.vars
Variables to test, used only when test.use is one of ‘LR’, ‘negbinom’, ‘poisson’, or ‘MAST’ -
min.cells.feature
Minimum number of cells expressing the feature in at least one of the two groups, currently only used for poisson and negative binomial tests -
min.cells.group
Minimum number of cells in one of the groups -
pseudocount.use
Pseudocount to add to averaged expression values when calculating logFC. 1 by default. -
fc.results
data.frame from FoldChange -
densify
Convert the sparse matrix to a dense form before running the DE test. This can provide speedups but might require higher memory; default is FALSE -
mean.fxn
Function to use for fold change or average difference calculation. If NULL, the appropriate function will be chose according to the slot used -
fc.name
Name of the fold change, average difference, or custom function column in the output data.frame. If NULL, the fold change column will be named according to the logarithm base (eg, “avg_log2FC”), or if using the scale.data slot “avg_diff”. -
base
The base with respect to which logarithms are computed. -
norm.method
Normalization method for fold change calculation when slot is “data” -
recorrect_umi
Recalculate corrected UMI counts using minimum of the median UMIs when performing DE using multiple SCT objects; default is TRUE -
ident.1
Identity class to define markers for; pass an object of class phylo or ‘clustertree’ to find markers for a node in a cluster tree; passing ‘clustertree’ requires BuildClusterTree to have been run -
ident.2
A second identity class for comparison; if NULL, use all other cells for comparison; if an object of class phylo or ‘clustertree’ is passed to ident.1, must pass a node to find markers for -
group.by
Regroup cells into a different identity class prior to performing differential expression (see example) -
subset.ident
Subset a particular identity class prior to regrouping. Only relevant if group.by is set (see example) -
assay
Assay to use in differential expression testing -
reduction
Reduction to use in differential expression testing - will test for DE on cell embeddings


![[工具]Pytorch-lightning的使用](https://img-blog.csdnimg.cn/d3001cffcd0b4da795f7d57e3b219fd1.png)
![shiro反序列化[cve_2016_4437]](https://img-blog.csdnimg.cn/b30d9e2b3d8a4a98b8a513349e20a234.png)