之前用HTML5 + JavaScript绘柱状图,可以直观显示各类型产品或品牌的所占比例大小。详见:
HTML5 + JavaScript绘柱状图+1
现在需要针对每年获得各类品牌数据进行对比,绘制柱状图会更直观。
首先我们定义二维数组aBrandType,存放品牌类型及其对应的颜色:
const aBrandType = new Array(
//0:品牌名称,1:颜色
 ["区域公用品牌",'purple'], //0
 ["农业企业品牌",'blue'], //1
 ["农产品品牌", '#ff9900'], //2
 ["广西农交会金奖", '#339933'], //3
 ["广西农交会银奖", '#cc0000'],//4
 ["中国国际农交会金奖",'#00cccc']//5
);
然后我们定义二维数组aBrands,存放每个年度获得各类品牌的数量:
var aBrands = new Array(
 //0:年份,1:品牌总数量,2:区域公用品牌数量,3:农业企业数量;4:农产品品牌数量;5:广西农交会金奖数量……
 [2018,7,2,1,4],
 [2019,11,3,4,4],
 [2020,3,0,2,1,2],
 [2021,7,0,4,3],
 [2022,6,1,4,1]
);
接着我们与绘制饼图时定义一个饼图对象相类似的,定义一个柱状图对象BarChart
BarChart.prototype = {
……
}//BarChart.prototype
柱状图对象BarChart具有如下公开属性:
var bcBarChart = new BarChart({
    ctx:    cbcCtx,    //画布
    width:    cbc.width,//画布宽度
    height:    cbc.height,//画布高度
    data:    aBrands,//柱状数据
    legend:    aBrandType,//图例
    title:    bcBarChartTitle //标题
  });
其中bcBarChartTitle是一个对象,包括以下属性:
var  bcBarChartTitle =
{
    text:'品牌时间分布', //标题文字
    marginTop:25, //标题与画布顶部间距
    fontSize:20    //标题字体大小
};
为了简便便起见,我们默认标题颜色为黑色,字体为微软雅黑,所以这里没有标题的颜色和字体属性。
在柱状图对象BarChart内部有几个方法。
第一个是初始化方法init
    init: function ()
    {
        this.scaleX = 60;    //横坐标刻度间距
        this.scaleY = 28;    //纵坐标刻度间距
    } //init
在初始化方法中,我们可以定义对象内部的一些属性。
第二个是绘制标题方法:
    //绘制标题
    drawTitle: function()
    {
        //如果标题属性已赋值且长度大于0,则输出标题文字
        if (typeof(this.title) != "undefined" && 0 < this.title.text.length)
        {
            this.ctx.font = "bolder " + this.title.fontSize + "px 微软雅黑";
            this.ctx.fillStyle = 'black';
            this.ctx.shadowBlur=20;
            this.ctx.shadowColor="gray";
            this.ctx.fillText(this.title.text, (this.width - this.title.text.length * this.title.fontSize)/2, this.title.marginTop);
        }//if
    },//drawTitle
第三个是绘制图例方法,包括绘制色块和对应的文字说明:
    //绘制图例
    drawLegend: function()
    {
        var maxLen = -1;
        var fontSize = 20;//字体大小
        var boxSize = 20;//色块尺寸
        var sb = 5; //间距Space between

        //取图例中文字说明字数的最大值
        this.legend.forEach(function (v)
        {
            if (v[1] > maxLen)
            {
                maxLen = v[1].length;
            }
        });

        taDbg.value += '\n maxLen=' + maxLen;

        // 文字说明的横坐标
        //boxX = this.width - maxLen * fontSize - legendBoxSize - sb;
        var textX = this.width - maxLen * fontSize - sb*2 - 200;

        //色块的的横坐标
        var boxX = textX - boxSize - sb;

        //纵坐标
        var y = this.title.marginTop + this.title.fontSize + sb;
        this.ctx.font = fontSize + "px 宋体";

        for (var i=0; i < this.legend.length; i++)
        {
            this.ctx.fillStyle = this.legend[i][1];
            this.ctx.fillRect(boxX, y, boxSize, boxSize);
            this.ctx.fillStyle = 'black';
            this.ctx.fillText(this.legend[i][0], textX, y + fontSize*3/4);
            y += sb*2 + boxSize;
        }//for
    },//drawLegend
第四个是绘制纵坐标方法:
    //绘制纵坐标
    drawOrdinate: function()
    {
        var fontSize = 20;
        var datumPointX = 30;//坐标原点x
        var datumPointY = this.height - 50;//坐标原点y

        //1、取纵坐标最大值
        var maxOrdinate = -1;
        this.data.forEach(function (v)
        {
            if (v[1] > maxOrdinate)
            {
                maxOrdinate = v[1];
            }
        });
        taDbg.value +=     '\n maxOrdinate=' + maxOrdinate;


        //画纵坐标轴
        this.ctx.moveTo(datumPointX, datumPointY);
        this.ctx.lineTo(datumPointX,  this.title.fontSize + this.title.marginTop + fontSize);
        this.ctx.stroke();

        //画纵坐标刻度
        for (var i=0; i <= maxOrdinate; i++)
        {
            var j =  datumPointY - i * this.scaleY;
            this.ctx.moveTo(datumPointX, j);
            //this.ctx.lineTo(this.width - 50 , j);
            this.ctx.lineTo(this.width - (this.data.length-1) * this.scaleX, j);
            this.ctx.stroke();
        }

        //绘制纵坐标刻度值
        //this.ctx.textAlign = "end";
        this.ctx.font = fontSize + "px 宋体";
        for (var i=1; i <= maxOrdinate; i++)
        {
            this.ctx.fillText(i, 0, datumPointY - i * this.scaleY + fontSize/3);
        }

        //输出纵坐标名称
        //this.ctx.fillText('数量', 0, datumPointY -  maxOrdinate * this.scaleY - fontSize);
        this.ctx.fillText('数量', 0, datumPointY -  maxOrdinate * this.scaleY - fontSize*2);

        //taDbg.value +=     '\n minOrdinate=' + minOrdinate + '  maxOrdinate=' + maxOrdinate;
    },//drawOrdinate
第五个是绘制横坐标方法:
    //绘制横坐标
    drawDiascissa: function()
    {
        var fontSize = 20;

        this.ctx.font = fontSize + "px 宋体";
        for (var i=0; i < this.data.length; i++)
        {
            this.ctx.fillText(this.data[i][0], (i+1) * this.scaleX , this.height - fontSize);
        }
        //this.ctx.fillText('年度',  this.width - 4*fontSize, this.height - 50 + fontSize/3);
        this.ctx.fillText('年度',  this.width - (this.data.length-1) * this.scaleX, this.height - fontSize);
    },//drawDiascissa
最后一个是绘制数据柱状条方法:
    //绘制数据柱状条
    drawBar: function()
    {
        var fontSize = 20;

        this.ctx.font = fontSize + "px 宋体";
        for (var i=0; i < this.data.length; i++)
        {

            var k = this.height - 50;
            for (var j=2; j < this.data[i].length; j++)
            {
                if ("undefined"!=this.data[i][j] && this.data[i][j] > 0)
                {
                    this.ctx.fillStyle = this.legend[j-2][1];
                    k -= this.data[i][j] * 28;
                    this.ctx.fillRect((i+1) * this.scaleX, k, fontSize * 2, this.data[i][j] * this.scaleY);

                    this.ctx.fillStyle = 'white';
                    this.ctx.fillText(this.data[i][j], (i+1) * this.scaleX + Math.round(fontSize*2/3), k + this.scaleY*this.data[i][j]*2/3);

                    //taDbg.value += '\n this.data[' + i + '][' + j + ']=' + this.data[i][j] + '  this.ctx.fillStyle=' + this.ctx.fillStyle;
                }//if
            }//for
        }
    },//drawBar
完整的代码如下:
<!DOCTYPE html>
<html>
 <head>
  <meta charset="UTF-8">
  <meta name="Author" content="PurpleEndurer">
  <title>柱状图</title>
 </head>
 <body>
  <canvas id="canvasBarChart" width="600" height="450" style="border:1px solid black; margin:50px; overflow:auto;"> 你的浏览器不支持HTML5 canvas </canvas>
  <textarea border="1" id="taDebug" cols="80" rows="15">debug:</textarea>
    <script type="text/javascript">
var taDbg = document.getElementById("taDebug");


const aBrandType = new Array(
//0:品牌名称,1:颜色
 ["区域公用品牌",'purple'], //0
 ["农业企业品牌",'blue'], //1
 ["农产品品牌", '#ff9900'], //2
 ["广西农交会金奖", '#339933'], //3
 ["广西农交会银奖", '#cc0000'],//4
 ["中国国际农交会金奖",'#00cccc']//5
);

var aBrands = new Array(
 //0:年份,1:品牌总数量,2:区域公用品牌数量,3:农业企业数量;4:农产品品牌数量;5:广西农交会金奖数量……
 [2018,7,2,1,4],
 [2019,11,3,4,4],
 [2020,3,0,2,1,2],
 [2021,7,0,4,3],
 [2022,6,1,4,1]
);

var cbc = document.getElementById("canvasBarChart");
cbc.height	= 450;
cbc.width	= 600;
var cbcCtx = cbc.getContext("2d");

function BarChart(obj)
{
	//导入外部公开的属性
	for(var key in obj)
	{
		this[key] = obj[key];
	}

	this.init();//初始化
	this.drawTitle();//绘制标题
	this.drawLegend();//绘制图例
	this.drawOrdinate();//绘制横坐标
	this.drawDiascissa();//绘制纵坐标
	this.drawBar();//绘制数据柱状条
}

BarChart.prototype = {
	//绘制纵坐标
	drawOrdinate: function()
	{
		//var scale = 28;//刻度
		var fontSize = 20;
		var datumPointX = 30;//坐标原点x
		var datumPointY = this.height - 50;//坐标原点y

		//1、取纵坐标最大值
		var maxOrdinate = -1;
		this.data.forEach(function (v)
		{
			if (v[1] > maxOrdinate)
			{
				maxOrdinate = v[1];
			}
		});
		taDbg.value +=	 '\n maxOrdinate=' + maxOrdinate;


		//画纵坐标轴

		this.ctx.moveTo(datumPointX, datumPointY);
		this.ctx.lineTo(datumPointX,  this.title.fontSize + this.title.marginTop + fontSize);
		this.ctx.stroke();

		//画纵坐标刻度
		for (var i=0; i <= maxOrdinate; i++)
		{
			var j =  datumPointY - i * this.scaleY;
			this.ctx.moveTo(datumPointX, j);
			//this.ctx.lineTo(this.width - 50 , j);
			this.ctx.lineTo(this.width - (this.data.length-1) * this.scaleX, j);
			this.ctx.stroke();
		}

		//绘制纵坐标刻度值
		//this.ctx.textAlign = "end";
		this.ctx.font = fontSize + "px 宋体";
		for (var i=1; i <= maxOrdinate; i++)
		{
			this.ctx.fillText(i, 0, datumPointY - i * this.scaleY + fontSize/3);
		}

		//输出纵坐标名称
		//this.ctx.fillText('数量', 0, datumPointY -  maxOrdinate * this.scaleY - fontSize);
		this.ctx.fillText('数量', 0, datumPointY -  maxOrdinate * this.scaleY - fontSize*2);

		//taDbg.value +=	 '\n minOrdinate=' + minOrdinate + '  maxOrdinate=' + maxOrdinate;
	},//drawOrdinate

	//绘制横坐标
	drawDiascissa: function()
	{
		var fontSize = 20;

		this.ctx.font = fontSize + "px 宋体";
		for (var i=0; i < this.data.length; i++)
		{
			this.ctx.fillText(this.data[i][0], (i+1) * this.scaleX , this.height - fontSize);
		}
		//this.ctx.fillText('年度',  this.width - 4*fontSize, this.height - 50 + fontSize/3);
		this.ctx.fillText('年度',  this.width - (this.data.length-1) * this.scaleX, this.height - fontSize);
	},//drawDiascissa

	//绘制数据柱状条
	drawBar: function()
	{
		var fontSize = 20;

		this.ctx.font = fontSize + "px 宋体";
		for (var i=0; i < this.data.length; i++)
		{
			var k = this.height - 50;
			for (var j=2; j < this.data[i].length; j++)
			{
				if ("undefined"!=this.data[i][j] && this.data[i][j] > 0)
				{
					this.ctx.fillStyle = this.legend[j-2][1];
					k -= this.data[i][j] * 28;
					this.ctx.fillRect((i+1) * this.scaleX, k, fontSize * 2, this.data[i][j] * this.scaleY);
					this.ctx.fillStyle = 'white';
					this.ctx.fillText(this.data[i][j], (i+1) * this.scaleX + Math.round(fontSize*2/3), k + this.scaleY*this.data[i][j]*2/3);

					//taDbg.value += '\n this.data[' + i + '][' + j + ']=' + this.data[i][j] + '  this.ctx.fillStyle=' + this.ctx.fillStyle;
				}//if
			}//for
		}
	},//drawBar

	//绘制图例
	drawLegend: function()
	{
		var maxLen = -1;
		var fontSize = 20;//字体大小
		var boxSize = 20;//色块尺寸
		var sb = 5; //间距Space between

		//取图例中文字说明字数的最大值
		this.legend.forEach(function (v)
		{
			if (v[1] > maxLen)
			{
				maxLen = v[1].length;
			}
		});

		taDbg.value += '\n maxLen=' + maxLen;

		// 文字说明的横坐标
		//boxX = this.width - maxLen * fontSize - legendBoxSize - sb;
		var textX = this.width - maxLen * fontSize - sb*2 - 200;

		//色块的的横坐标
		var boxX = textX - boxSize - sb;

		//纵坐标
		var y = this.title.marginTop + this.title.fontSize + sb;
		this.ctx.font = fontSize + "px 宋体";

		for (var i=0; i < this.legend.length; i++)
		{
			this.ctx.fillStyle = this.legend[i][1];
			this.ctx.fillRect(boxX, y, boxSize, boxSize);
			this.ctx.fillStyle = 'black';
			this.ctx.fillText(this.legend[i][0], textX, y + fontSize*3/4);
			y += sb*2 + boxSize;
		}//for
	},//drawLegend

	//绘制标题
	drawTitle: function()
	{

		//如果标题属性已赋值且长度大于0,则输出标题文字
		if (typeof(this.title) != "undefined" && 0 < this.title.text.length)
		{
			this.ctx.font = "bolder " + this.title.fontSize + "px 微软雅黑";
			this.ctx.fillStyle = 'black';//默认黑色
			this.ctx.shadowBlur=20;
			this.ctx.shadowColor="gray";
			this.ctx.fillText(this.title.text, (this.width - this.title.text.length * this.title.fontSize)/2, this.title.marginTop);
		}//if
	},//drawTitle

	//初始化
	init: function ()
	{
		this.scaleX = 60;	//横坐标刻度间距
		this.scaleY = 28;	//纵坐标刻度间距
	} //init
}//BarChart.prototype

var  bcBarChartTitle =
{
	text:'品牌时间分布', //标题文字
	marginTop:25, //标题与画布顶部间距
	fontSize:20	//标题字体
};

var bcBarChart = new BarChart({
	ctx:	cbcCtx,
	width:	cbc.width,
	height:	cbc.height,
	data:	aBrands,
	legend:	aBrandType,
	title:	bcBarChartTitle
  });
    </script>
 </body>
</html>
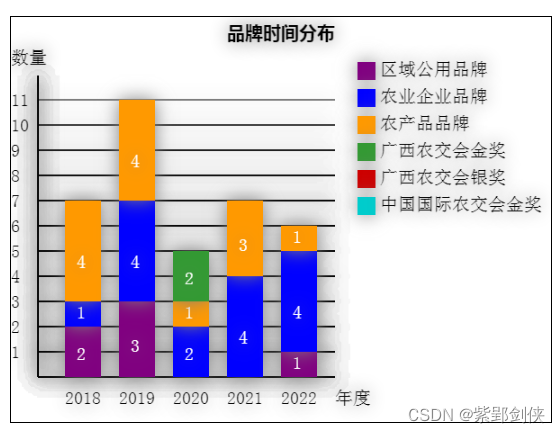
代码显示效果如下图:

![[工具]Pytorch-lightning的使用](https://img-blog.csdnimg.cn/d3001cffcd0b4da795f7d57e3b219fd1.png)
![shiro反序列化[cve_2016_4437]](https://img-blog.csdnimg.cn/b30d9e2b3d8a4a98b8a513349e20a234.png)
