brief
-
什么是线性降维?
这里是一个很形象的网页演示,其中包括了一个视频链接。
这里是如何用R 包psych做线性降维的演示,其中也有原理的简述。 -
为什么要做线性降维?
因为下一步的聚类分析需要这里的降维结果作为输入。降维做的好,聚类时细胞类群才分得开分的好。这里使用的 input是上一步的 select highly variable features对应的scale数据。highly variable features选的不好,降维算法再牛逼也可能拯救不了你的数据结果。
-
Seurat 中的函数RunPCA()默认使用selected highly variable features作为input,你也可以使用features argument指定对应的 input,所以RunPCA()可以是一个反复交互优化的步骤。
实例
- 第一次运行RunPCA
#  By default, only the previously determined variable features are used as input,
#  but can be defined using features argument if you wish to choose a different subset.

pbmc <- RunPCA(pbmc, features = VariableFeatures(object = pbmc))

下面是主成分得分,教程里说Both cells and features are ordered according to their PCA scores,这里显示的结果貌似还没有进行排序。可能是使用相关数据时才会排序。

# RunPCA
pbmc <- RunPCA(pbmc, features = VariableFeatures(object = pbmc))
# ElbowPlot(pbmc)
# DimHeatmap(pbmc, dims = 1:15, cells = 500, balanced = TRUE)
pbmc <- FindNeighbors(pbmc, dims = 1:10)
pbmc <- FindClusters(pbmc, resolution = 0.5)
pbmc <- RunUMAP(pbmc, dims = 1:10)
DimPlot(pbmc, reduction = "umap",label = T)

- 第二次运行RunPCA
# 这次使用高变基因排名前1000作为input
pbmc <- RunPCA(pbmc, features = pbmc@assays$RNA@var.features[1:1000])

可以看到feature.loading (载荷)已经改变了。

pbmc <- RunPCA(pbmc, features = pbmc@assays$RNA@var.features[1:1000])
pbmc <- FindNeighbors(pbmc, dims = 1:10)
pbmc <- FindClusters(pbmc, resolution = 0.5)
pbmc <- RunUMAP(pbmc, dims = 1:10)
DimPlot(pbmc, reduction = "umap",label = T)

- 尝试确定保留多少个PC
在其他的程序包里面是需要提前制定保留多少个PC的,这里RunPCA默认设置了50个PC,然后根据
VizDimReduction(), DimPlot(), and DimHeatmap() ,JackStrawPlot(),ElbowPlot()这些函数的结果确定最终下游分析 使用的PC个数。
# 确定保留多少个主成分
# 一般选取碎石图的拐点对应的PC数
ElbowPlot(pbmc)
# 拐点可以认为是7或者10

# visualizing both cells and features that define the PCA,
# including VizDimReduction(), DimPlot(), and DimHeatmap()
DimHeatmap(pbmc, dims = 1:15, cells = 500, balanced = TRUE)
# 第七个 PC之后感觉就分不开数据了

- 第三次运行RunPCA
# RunPCA
pbmc <- RunPCA(pbmc, features = VariableFeatures(object = pbmc),npcs = 7)
# ElbowPlot(pbmc)
# DimHeatmap(pbmc, dims = 1:15, cells = 500, balanced = TRUE)
pbmc <- FindNeighbors(pbmc, dims = 1:7)
pbmc <- FindClusters(pbmc, resolution = 0.5)
pbmc <- RunUMAP(pbmc, dims = 1:7)
DimPlot(pbmc, reduction = "umap",label = T)

这里看到聚类结果又有一些不一样了,有可能是FindClusters中的resolution参数设置不当导致的。
这里主要想说明的是你的RunPCA input不同会影响你 发现新的细胞聚类。
然后你选择多少个PC 也会影响你的细胞聚类结果,我这个演示数据集没体现出来罢了。
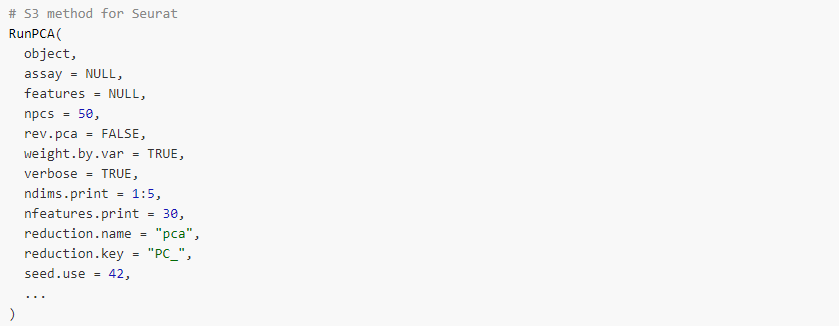
函数参数及意义
-
assay
Name of Assay PCA is being run on -
npcs
Total Number of PCs to compute and store (50 by default) -
rev.pca
By default computes the PCA on the cell x gene matrix. Setting to true will compute it on gene x cell matrix. -
weight.by.var
Weight the cell embeddings by the variance of each PC (weights the gene loadings if rev.pca is TRUE) -
verbose
Print the top genes associated with high/low loadings for the PCs -
ndims.print
PCs to print genes for -
nfeatures.print
Number of genes to print for each PC -
reduction.key
dimensional reduction key, specifies the string before the number for the dimension names. PC by default -
seed.use
Set a random seed. By default, sets the seed to 42. Setting NULL will not set a seed. -
approx
Use truncated singular value decomposition to approximate PCA -
features
Features to compute PCA on. If features=NULL, PCA will be run using the variable features for the Assay. Note that the features must be present in the scaled data. Any requested features that are not scaled or have 0 variance will be dropped, and the PCA will be run using the remaining features. -
reduction.name
dimensional reduction name, pca by default
