YOLOv1代码复现1:辅助功能实现
前言
在经历了Faster-RCNN代码解读的摧残后,下决心要搞点简单的,于是便有了本系列的博客。如果你苦于没有博客详细告诉你如何自己去实现YOLOv1,那么可以看看本系列的博客,也许可以帮助你。
另外,当完成所有代码后,会将代码放在GitHub上。
目标
最主要的目标肯定是能够跑通整个代码,并且我希望可以详细的告诉大家如何参考博客自己去实现,因此,文章也会记录我自己遇到的错误和调试过程。
本系列计划完成的内容与已完成的内容:
本系列计划六篇,如下:
- 第一篇:辅助功能实现(本文)
- 第二篇:数据加载器构建(等待完成)
- 第三篇:网络框架构建(等待完成)
- 第四篇:损失函数构建(等待完成)
- 第五篇:预测函数构建(等待完成)
- 第六篇:总结(等待完成)
1. 数据集下载:
决定采用VOC2012的数据集,下载地址为:
http://host.robots.ox.ac.uk/pascal/VOC/voc2012/VOCtrainval_11-May-2012.tar
下载完,解压,最好把它改为我一样的文件结构:

关于这个数据集的介绍,可以看我这篇博客,传送门。
另外,大家需要在VOC2012文件夹下,建立一个名为pascal_voc_classes.json的文件,用于存储类别名称和数字的对应关系(该文件内容如下):
{
    "aeroplane": 1,
    "bicycle": 2,
    "bird": 3,
    "boat": 4,
    "bottle": 5,
    "bus": 6,
    "car": 7,
    "cat": 8,
    "chair": 9,
    "cow": 10,
    "diningtable": 11,
    "dog": 12,
    "horse": 13,
    "motorbike": 14,
    "person": 15,
    "pottedplant": 16,
    "sheep": 17,
    "sofa": 18,
    "train": 19,
    "tvmonitor": 20
}
2. 我的目录结构介绍:
众所周知,拷贝别人使用的一大弊端就是需要对一些参数进行修改,特别是文件路径相关的参数。因此,这里我说明一下我的目录结构,方便大家后期自己实现或者修改代码的时候知道修改什么地方。
由于我的很多程序都要用到数据文件夹,因此我把数据文件夹单独存放了的,而没有放在我的yolov1项目下。我的目录结构如下:
根目录
	data ---- 存放数据集的文件夹
		VOC2012	---- VOC2012数据集文件夹
			Annotations
			ImageSets
			JPEGImages
			SegmentationClass
			SegmentationObject
	YOLOv1-pytorch ---- 项目文件夹
		network_file ---- 存放网络架构的文件夹
		utils ---- 存放辅助功能的文件夹
3. 画图函数的实现:
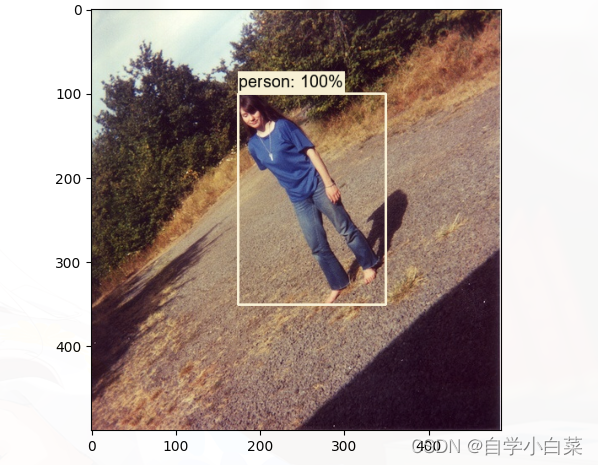
我们首先需要实现的功能:能够根据已给出的信息在图像画出框和类别信息。具体效果如下:

这个函数还是很好实现的,因为边界框的坐标信息、类别信息、概率值都是已知的,我们要做的就是把它用上。
实现画图的python库,主要有两个,一是cv库,二是PIL库。这里先用PIL库来实现吧。
3.1 导入所需的库:
这里主要用的是PIL库的Image、ImageDraw、ImageFont、ImageColor几个方法,因此导入:
from PIL.Image import Image
import PIL.ImageDraw as ImageDraw
import PIL.ImageFont as ImageFont
from PIL import ImageColor
import numpy as np
在实现函数之前,定义一个全局变量STANDARD_COLORS,用于存放那些标准的颜色值信息,到时候需要用颜色,直接从里面随机抽取一个即可:
# 标准颜色
STANDARD_COLORS = [
    'AliceBlue', 'Chartreuse', 'Aqua', 'Aquamarine', 'Azure', 'Beige', 'Bisque',
    'BlanchedAlmond', 'BlueViolet', 'BurlyWood', 'CadetBlue', 'AntiqueWhite',
    'Chocolate', 'Coral', 'CornflowerBlue', 'Cornsilk', 'Crimson', 'Cyan',
    'DarkCyan', 'DarkGoldenRod', 'DarkGrey', 'DarkKhaki', 'DarkOrange',
    'DarkOrchid', 'DarkSalmon', 'DarkSeaGreen', 'DarkTurquoise', 'DarkViolet',
    'DeepPink', 'DeepSkyBlue', 'DodgerBlue', 'FireBrick', 'FloralWhite',
    'ForestGreen', 'Fuchsia', 'Gainsboro', 'GhostWhite', 'Gold', 'GoldenRod',
    'Salmon', 'Tan', 'HoneyDew', 'HotPink', 'IndianRed', 'Ivory', 'Khaki',
    'Lavender', 'LavenderBlush', 'LawnGreen', 'LemonChiffon', 'LightBlue',
    'LightCoral', 'LightCyan', 'LightGoldenRodYellow', 'LightGray', 'LightGrey',
    'LightGreen', 'LightPink', 'LightSalmon', 'LightSeaGreen', 'LightSkyBlue',
    'LightSlateGray', 'LightSlateGrey', 'LightSteelBlue', 'LightYellow', 'Lime',
    'LimeGreen', 'Linen', 'Magenta', 'MediumAquaMarine', 'MediumOrchid',
    'MediumPurple', 'MediumSeaGreen', 'MediumSlateBlue', 'MediumSpringGreen',
    'MediumTurquoise', 'MediumVioletRed', 'MintCream', 'MistyRose', 'Moccasin',
    'NavajoWhite', 'OldLace', 'Olive', 'OliveDrab', 'Orange', 'OrangeRed',
    'Orchid', 'PaleGoldenRod', 'PaleGreen', 'PaleTurquoise', 'PaleVioletRed',
    'PapayaWhip', 'PeachPuff', 'Peru', 'Pink', 'Plum', 'PowderBlue', 'Purple',
    'Red', 'RosyBrown', 'RoyalBlue', 'SaddleBrown', 'Green', 'SandyBrown',
    'SeaGreen', 'SeaShell', 'Sienna', 'Silver', 'SkyBlue', 'SlateBlue',
    'SlateGray', 'SlateGrey', 'Snow', 'SpringGreen', 'SteelBlue', 'GreenYellow',
    'Teal', 'Thistle', 'Tomato', 'Turquoise', 'Violet', 'Wheat', 'White',
    'WhiteSmoke', 'Yellow', 'YellowGreen'
]
3.2 draw_obj函数实现:
该函数的作用:将目标边界框信息,类别信息绘制在图片上。
参数讲解:
传入的参数:
| 参数 | 意义 |
|---|---|
| image | 需要绘制的图片 |
| boxes | 目标边界框信息 格式为:[[left, top, right, bottom],…] |
| classes | 目标类别信息 |
| scores | 目标概率信息 |
| category_index | 类别与名称字典 |
| box_thresh | 过滤的概率阈值 |
| line_thickness | 边界框宽度 |
| font | 字体类型 |
| font_size | 字体大小 |
| draw_boxes_on_image | 是否将边界框画在图像上 默认为True |
这里,需要说明一下其中的几个关键参数,方便大家理解:
- boxes、classes、scores:
这三个参数分布是一张图片的所有边界框、类别、概率值,因为一张图片可能并不只有一个对象,因此这三个参数的值都是类似[[...],[...],......]这样列表里面嵌套一个列表的形式。
- category_index:
因为我们知道,计算机是没有办法直接识别诸如person/bike/car这样的自然语言的,因此需要把这些类别值转为数字值,就像上面创建的json文件一样,这里使用一个字典来存储相关值。
- box_thresh:
这个参数的作用就是过滤掉那些低概率的值,如果一个框预测概率过低,其实画出来也没啥意义,因此需要进行过滤,不过如果你不想过滤,直接设置为0即可。
返回值:
返回的是PIL Image对象,这个对象可以自带矩形边界框、类别文字等信息,然后可以使用matplotlib中的方法将图像显示出来。
函数实现:
首先,需要对现有的值进行过滤,过滤方法采用numpy.greater方法,其返回过滤后剩下的值的索引,然后利用这个索引去筛选值:
# 过滤掉低概率的目标
idxs = np.greater(scores, box_thresh)
# 需要同时处理boxes、classes、scores、masks
boxes = boxes[idxs]
classes = classes[idxs]
scores = scores[idxs]
如果全部过滤掉了,那么直接结束该方法:
# 如果boxes长度为0,表示所有的框都过滤了,就不需要画了
if len(boxes) == 0:
    return image
接着,根据类别个数,从标注颜色列表中抽取对应颜色,只是获取的颜色需要用ImageColor,getrgb方法获取rgb值:
# 从定义的颜色列表中抽取颜色
# ImageColor.getrgb 获取颜色的rgb值
colors = [ImageColor.getrgb(STANDARD_COLORS[cls % len(STANDARD_COLORS)]) for cls in classes]
判断是否需要画边界框,并用ImageDraw.Draw创建绘制对象:
# 如果需要画边界框
if draw_boxes_on_image:
    # 创建画图对象
    draw = ImageDraw.Draw(image)
然后,由于一张图对象可能不只一个,因此需要遍历boxes等参数,进行画图:
# 如果需要画边界框
if draw_boxes_on_image:
    # 创建画图对象
    draw = ImageDraw.Draw(image)
    # 开始迭代绘图
    for box, cls, score, color in zip(boxes, classes, scores, colors):
        # 边界框的坐标:左上角x、y + 右下角x、y
        left, top, right, bottom = box
        # 绘制目标边界框,逆时针画图
        draw.line([(left, top), (left, bottom), (right, bottom),
                   (right, top), (left, top)], width=line_thickness, fill=color)
        # 绘制类别和概率信息
        draw_text(draw, box.tolist(), int(cls), float(score), category_index, color, font, font_size)
其中,填写文字的函数,我们单独实现。
3.3 draw_text函数实现:
该函数的作用:在draw_obj函数的基础上绘制图像上的文字。
参数讲解:
参数种类和draw_obj函数相差不大,只是注意该函数的参数不像draw_obj函数一样,是多个值了(之前boxes参数为[[....],[....],...]),即一个参数仅有一个对象的值(这里box参数为[.....])。
另外,draw_text第一个参数,是已经绘制了矩形的图像对象,所以接下来的任务就是在该对象的基础上绘制文字内容。
返回值:
返回一个完整的绘制完成的图像对象。
实现:
利用之前导入的ImageFont方法创建字体对象,当然,如果你的电脑没有指定的字体,那么就使用默认字体:
# 创建字体对象,如果创建失败(比如目前指定的字体你没有),就使用默认的字体
try:
    font = ImageFont.truetype(font, font_size)
except IOError:
    font = ImageFont.load_default()
接着,获取box的坐标、并将1、2这样的数字信息转为如preson\bike的类别信息,并将形如0.2、0.3的概率值转为百分数形式:
# 获取坐标
left, top, right, bottom = box
# 将数字的类别转为真实的类别信息,并加上概率值构成“ person 99% ”这样的字符串
display_str = f"{category_index[str(cls)]}: {int(100 * score)}%"
然后,需要设置字体的高度,使用font.getsize方法可以获取输入字符的大小,那么将要填写的一句话全输入给该方法,然后获取所有字符的最大值即可:
# 设置字体的高度
# font.getsize获取输入文字中每个字符的大小
display_str_heights = [font.getsize(ds)[1] for ds in display_str]
display_str_height = (1 + 2 * 0.05) * max(display_str_heights)
接下来是一个难点:文字需要设置它的坐标。这里,看下图分析坐标获取思路:

上图是正常的情况,即边界框最上面的坐标与文字高度不重叠,意味着可以正常放下文字内容。但是也有不正常的情况:

如上图所示,填写的文字没有办法放在边界框的上面,此时需要进行一定的修正,采取的方法是把文字放入边界框内容。
基于此,可以编写代码:
# 如果文字的高度没有超过图像最高点
if top > display_str_height:
    # 设置文字的坐标
    # 这里减法, 注意坐标轴的朝向
    text_top = top - display_str_height
    text_bottom = top
else:
    # 如果超过了,就设置文字的坐标为边界框的下面
    text_top = bottom
    text_bottom = bottom + display_str_height
最后,就是绘制文字了。这里,一个字符一个字符的绘制,是因为需要为每个字符添加一个矩形框背景,这样不同字符组合在一起,将变为一个大的矩形框了:
# 开始画
# 一个字符一个字符的画
for ds in display_str:
    # 获取文字的宽和高
    text_width, text_height = font.getsize(ds)
    # 设置每个字符的偏离距离
    margin = np.ceil(0.05 * text_width)
    # 画一个矩形
    draw.rectangle([(left, text_top),
                    (left + text_width + 2 * margin, text_bottom)], fill=color)
    # 画文字
    draw.text((left + margin, text_top),
              ds,
              fill='black',
              font=font)
    left += text_width
4. 效果展示:
由于我们还没有实现其它的代码,所以这里用一个简单的方法来检测代码是否可以正确运行。
首先,需要导入之前没有导入过的库:
# 导入调试需要的库
from matplotlib import pyplot as plt
import json
from PIL import Image
接着,需要读取我们的json文件,并转为字典:
# 读取类别json文件,并转为字典值
category_index = {}
try:
    # 路劲需要改为自己的
    json_file = open('../../data/VOC2012/pascal_voc_classes.json', 'r')
    class_dict = json.load(json_file)
    category_index = {str(v): str(k) for k, v in class_dict.items()}
except Exception as e:
    print(e)
    exit(-1)
这个字典的值形如下表,即为类别和数字值的对应关系:
{
	'person' : 15
	'bike' : 2
}
接着,我们可以调用我们的函数了,不过我们只能手动传入对应参数了:
# 开始绘制
# 打开一张图片,需要修改为自己的路径
img = Image.open('../../data/VOC2012/JPEGImages/2007_000027.jpg')
plot_img = draw_objs(img,
                     np.array([[174,101,349,351]]), # 传入该图像对应的注解信息
                     np.array([15]),
                     np.array([1]),
                     category_index=category_index,
                     box_thresh=0.5,
                     line_thickness=3,
                     font='arial.ttf',
                     font_size=20)
plt.imshow(plot_img)
plt.show()
说明一下,上面的参数值都是如何填写的:先任意选择一张图片,然后找到其对应的注解文件;接着,任意选择一个对象,找到其类别名称和坐标值即可。由于我们采用的真实图像的值,即类别概率肯定为1.

从上面传入的参数,也可以直观的理解各个参数的含义和形式。
运行上述代码结果如下:
5. 完整代码:
# author: baiCai
# 本文件拷贝别人的,用于画框图,删除了一些自己用不到的内容
from PIL.Image import Image
import PIL.ImageDraw as ImageDraw
import PIL.ImageFont as ImageFont
from PIL import ImageColor
import numpy as np

# 标准颜色
STANDARD_COLORS = [
    'AliceBlue', 'Chartreuse', 'Aqua', 'Aquamarine', 'Azure', 'Beige', 'Bisque',
    'BlanchedAlmond', 'BlueViolet', 'BurlyWood', 'CadetBlue', 'AntiqueWhite',
    'Chocolate', 'Coral', 'CornflowerBlue', 'Cornsilk', 'Crimson', 'Cyan',
    'DarkCyan', 'DarkGoldenRod', 'DarkGrey', 'DarkKhaki', 'DarkOrange',
    'DarkOrchid', 'DarkSalmon', 'DarkSeaGreen', 'DarkTurquoise', 'DarkViolet',
    'DeepPink', 'DeepSkyBlue', 'DodgerBlue', 'FireBrick', 'FloralWhite',
    'ForestGreen', 'Fuchsia', 'Gainsboro', 'GhostWhite', 'Gold', 'GoldenRod',
    'Salmon', 'Tan', 'HoneyDew', 'HotPink', 'IndianRed', 'Ivory', 'Khaki',
    'Lavender', 'LavenderBlush', 'LawnGreen', 'LemonChiffon', 'LightBlue',
    'LightCoral', 'LightCyan', 'LightGoldenRodYellow', 'LightGray', 'LightGrey',
    'LightGreen', 'LightPink', 'LightSalmon', 'LightSeaGreen', 'LightSkyBlue',
    'LightSlateGray', 'LightSlateGrey', 'LightSteelBlue', 'LightYellow', 'Lime',
    'LimeGreen', 'Linen', 'Magenta', 'MediumAquaMarine', 'MediumOrchid',
    'MediumPurple', 'MediumSeaGreen', 'MediumSlateBlue', 'MediumSpringGreen',
    'MediumTurquoise', 'MediumVioletRed', 'MintCream', 'MistyRose', 'Moccasin',
    'NavajoWhite', 'OldLace', 'Olive', 'OliveDrab', 'Orange', 'OrangeRed',
    'Orchid', 'PaleGoldenRod', 'PaleGreen', 'PaleTurquoise', 'PaleVioletRed',
    'PapayaWhip', 'PeachPuff', 'Peru', 'Pink', 'Plum', 'PowderBlue', 'Purple',
    'Red', 'RosyBrown', 'RoyalBlue', 'SaddleBrown', 'Green', 'SandyBrown',
    'SeaGreen', 'SeaShell', 'Sienna', 'Silver', 'SkyBlue', 'SlateBlue',
    'SlateGray', 'SlateGrey', 'Snow', 'SpringGreen', 'SteelBlue', 'GreenYellow',
    'Teal', 'Thistle', 'Tomato', 'Turquoise', 'Violet', 'Wheat', 'White',
    'WhiteSmoke', 'Yellow', 'YellowGreen'
]


def draw_text(draw,box,cls,score,category_index,color,font='arial.ttf',font_size=24):
    """
    将目标边界框和类别信息绘制到图片上
    参数:
        draw : 画图对象,可以使用画直线等等方法
        box : 一个边界框,里面有坐标信息
        cls : 对象的类别,为int值,需要使用category_index转为字符串值
        score : 对象的类别概率值
        category_index : 不同的索引对应的类别信息
        color : 使用的颜色
        font :字体
        font_size : 字大小
    """
    # 创建字体对象,如果创建失败(比如目前指定的字体你没有),就使用默认的字体
    try:
        font = ImageFont.truetype(font, font_size)
    except IOError:
        font = ImageFont.load_default()

    # 获取坐标
    left, top, right, bottom = box
    # 将数字的类别转为真实的类别信息,并加上概率值构成“ person 99% ”这样的字符串
    display_str = f"{category_index[str(cls)]}: {int(100 * score)}%"
    # 设置字体的高度
    # font.getsize获取输入文字中每个字符的大小
    display_str_heights = [font.getsize(ds)[1] for ds in display_str]
    display_str_height = (1 + 2 * 0.05) * max(display_str_heights)

    # 如果文字的高度没有超过图像最高点
    if top > display_str_height:
        # 设置文字的坐标
        # 这里减法, 注意坐标轴的朝向
        text_top = top - display_str_height
        text_bottom = top
    else:
        # 如果超过了,就设置文字的坐标为边界框的下面
        text_top = bottom
        text_bottom = bottom + display_str_height

    # 开始画
    # 一个字符一个字符的画
    for ds in display_str:
        # 获取文字的宽和高
        text_width, text_height = font.getsize(ds)
        # 设置每个字符的偏离距离
        margin = np.ceil(0.05 * text_width)
        # 画一个矩形
        draw.rectangle([(left, text_top),
                        (left + text_width + 2 * margin, text_bottom)], fill=color)
        # 画文字
        draw.text((left + margin, text_top),
                  ds,
                  fill='black',
                  font=font)
        left += text_width


def draw_objs(image,boxes=None,classes=None,scores=None,category_index=None,box_thresh=0.1,line_thickness=8,font='arial.ttf',font_size=24,draw_boxes_on_image=True):
    """
    将目标边界框信息,类别信息绘制在图片上
    Args:
        image: 需要绘制的图片
        boxes: 目标边界框信息
        classes: 目标类别信息
        scores: 目标概率信息
        category_index: 类别与名称字典
        box_thresh: 过滤的概率阈值
        line_thickness: 边界框宽度
        font: 字体类型
        font_size: 字体大小
        draw_boxes_on_image:是否将边界框画在图像上,默认为True
    Returns:

    """
    # 过滤掉低概率的目标
    idxs = np.greater(scores, box_thresh)
    # 需要同时处理boxes、classes、scores、masks
    boxes = boxes[idxs]
    classes = classes[idxs]
    scores = scores[idxs]

    # 如果boxes长度为0,表示所有的框都过滤了,就不需要画了
    if len(boxes) == 0:
        return image

    # 从定义的颜色列表中抽取颜色
    # ImageColor.getrgb 获取颜色的rgb值
    colors = [ImageColor.getrgb(STANDARD_COLORS[cls % len(STANDARD_COLORS)]) for cls in classes]

    # 如果需要画边界框
    if draw_boxes_on_image:
        # 创建画图对象
        draw = ImageDraw.Draw(image)
        # 开始迭代绘图
        for box, cls, score, color in zip(boxes, classes, scores, colors):
            # 边界框的坐标
            left, top, right, bottom = box
            # 绘制目标边界框,顺时针画图
            draw.line([(left, top), (left, bottom), (right, bottom),
                       (right, top), (left, top)], width=line_thickness, fill=color)
            # 绘制类别和概率信息
            draw_text(draw, box.tolist(), int(cls), float(score), category_index, color, font, font_size)


    return image

if __name__ == '__main__':
    # 导入调试需要的库
    from matplotlib import pyplot as plt
    import json
    from PIL import Image
    # 读取类别json文件,并转为字典值
    category_index = {}
    try:
        json_file = open('../../data/VOC2012/pascal_voc_classes.json', 'r')
        class_dict = json.load(json_file)
        category_index = {str(v): str(k) for k, v in class_dict.items()}
    except Exception as e:
        print(e)
        exit(-1)
    # 开始绘制
    # 打开一张图片,需要修改为自己的路径
    img = Image.open('../../data/VOC2012/JPEGImages/2007_000027.jpg')
    plot_img = draw_objs(img,
                         np.array([[174,101,349,351]]), # 传入该图像对应的注解信息
                         np.array([15]),
                         np.array([1]),
                         category_index=category_index,
                         box_thresh=0.5,
                         line_thickness=3,
                         font='arial.ttf',
                         font_size=20)
    plt.imshow(plot_img)
    plt.show()
6. 总结:
这里,我们不仅仅实现了画图的函数,还定义了传入参数的形式,也为后期构建数据加载等文件定下了返回值的基调。所谓,千里之路始于足下,顺着思路往下写,迟早也会把YOLOv1搞定的^_^。
