如何使用Python-SeabornSeaborn进行显著性统计图表绘制,详细内容如下:
- Python-Seaborn自定义函数绘制
- Python-statannotations库添加显著性标注
1、Python-Seaborn 自定义函数绘制
import matplotlib.pylab as plt
import numpy as np
import seaborn as sns
import scipy

# ---------------------自定义P值和星号对应关系----------------------
def convert_pvalue_to_asterisks(pvalue):
    if pvalue <= 0.0001:
        return "****"
    elif pvalue <= 0.001:
        return "***"
    elif pvalue <= 0.01:
        return "**"
    elif pvalue <= 0.05:
        return "*"
    return "ns"

# ---------------------scipy.stats 计算显著性指标----------------
iris = sns.load_dataset("iris")
data_p = iris[["sepal_length","species"]]
stat,p_value = scipy.stats.ttest_ind(data_p[data_p["species"]=="setosa"]["sepal_length"],
                                     data_p[data_p["species"]=="versicolor"]["sepal_length"],
                                     equal_var=False)

# ------------------------可视化绘制---------------------------
plt.rcParams['font.family'] = ['Times New Roman']
plt.rcParams["axes.labelsize"] = 18
palette=['#0073C2FF','#EFC000FF','#868686FF']

fig,ax = plt.subplots(figsize=(5,4),dpi=100,facecolor="w")
ax = sns.barplot(x="species",y="sepal_length",data=iris,palette=palette,
                 estimator=np.mean,ci="sd", capsize=.1,errwidth=1,errcolor="k",
                 ax=ax,
                 **{"edgecolor":"k","linewidth":1})
# 添加P值
x1, x2 = 0, 1
y,h = data_p["sepal_length"].mean()+1,.2
#绘制横线位置
ax.plot([x1, x1, x2, x2], [y, y+h, y+h, y], lw=1, c="k")
#添加P值
ax.text((x1+x2)*.5, y+h, "T-test: {} ".format(p_value), ha='center', va='bottom', color="k")

ax.tick_params(which='major',direction='in',length=3,width=1.,labelsize=14,bottom=False)
for spine in ["top","left","right"]:
    ax.spines[spine].set_visible(False)
ax.spines['bottom'].set_linewidth(2)
ax.grid(axis='y',ls='--',c='gray')
ax.set_axisbelow(True)
plt.show()
2、Python-statannotations库添加显著性标注
Python-statannotations库则是针对Seaborn绘图对象进行显著性标注的专用库,其可以提供柱形图、箱线图、小提琴图等统计图表的显著性标注绘制,计算P值方法基于scipy.stats方法,这里我们简单列举几个示例演示即可,更多详细内容可参看:项目地址、使用教程 or Seaborn。
样例一:
import seaborn as sns
import matplotlib.pylab as plt
from statannotations.Annotator import Annotator

df = sns.load_dataset("tips")

x = "day"
y = "total_bill"
order = ['Sun', 'Thur', 'Fri', 'Sat']
fig,ax = plt.subplots(figsize=(5,4),dpi=100,facecolor="w")
ax = sns.boxplot(data=df, x=x, y=y, order=order,ax=ax)

pairs=[("Thur", "Fri"), ("Thur", "Sat"), ("Fri", "Sun")]
annotator = Annotator(ax, pairs, data=df, x=x, y=y, order=order)
annotator.configure(test='Mann-Whitney', text_format='star',line_height=0.03,line_width=1)
annotator.apply_and_annotate()

ax.tick_params(which='major',direction='in',length=3,width=1.,labelsize=14,bottom=False)
for spine in ["top","left","right"]:
    ax.spines[spine].set_visible(False)
ax.spines['bottom'].set_linewidth(2)
ax.grid(axis='y',ls='--',c='gray')
ax.set_axisbelow(True)
plt.show()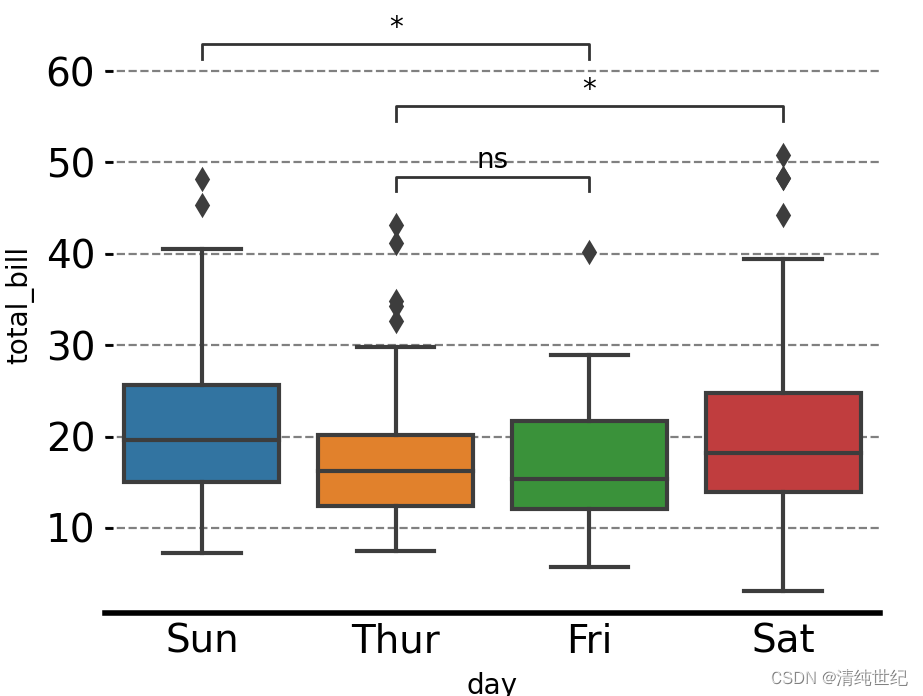
样例二:
import seaborn as sns
import matplotlib.pyplot as plt
plt.rcParams['font.family'] = ['Times New Roman']
plt.rcParams["axes.labelsize"] = 18
#palette=['#0073C2FF','#EFC000FF']
palette=['#E59F01','#56B4E8']
#palette = ["white","black"]


fig,ax = plt.subplots(figsize=(5,4),dpi=100,facecolor="w")
ax = sns.barplot(x="order",y="value",hue="class",data=group_data_p,palette=palette,ci="sd",
                 capsize=.1,errwidth=1,errcolor="k",ax=ax,
                 **{"edgecolor":"k","linewidth":1})

# 添加P值
box_pairs = [(("one","type01"),("two","type01")),
             (("one","type02"),("two","type02")),
             (("one","type01"),("three","type01")),
             (("one","type02"),("three","type02")),
             (("two","type01"),("three","type01")),
             (("two","type02"),("three","type02"))]


annotator = Annotator(ax, data=group_data_p, x="order",y="value",hue="class",
                      pairs=box_pairs)
annotator.configure(test='t-test_ind', text_format='star',line_height=0.03,line_width=1)
annotator.apply_and_annotate()
样例三:如果针对组间数据进行统计分析,可以设置pairs参数据如下:
box_pairs = [(("one","type01"),("one","type02")),
             (("two","type01"),("two","type02")),
             (("three","type01"),("three","type02"))]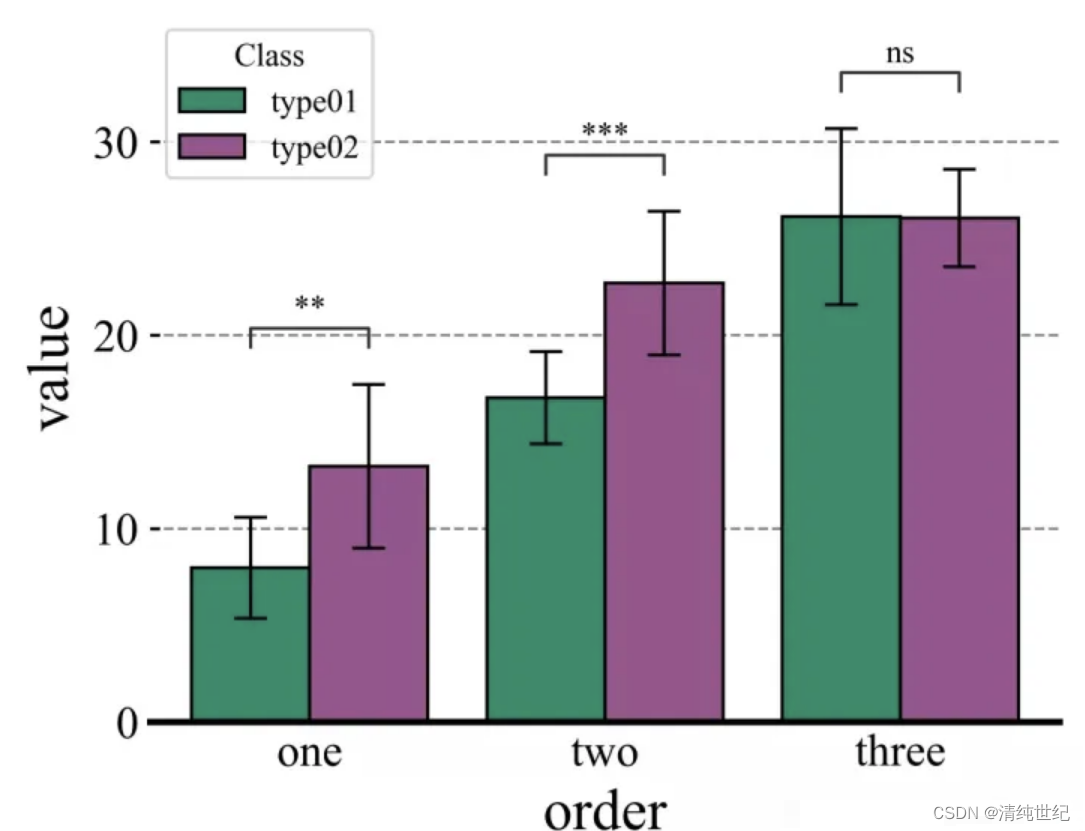
案例四:自定义显著性
import seaborn as sns
import matplotlib.pylab as plt
from statannotations.Annotator import Annotator

df = sns.load_dataset("tips")

x = "day"
y = "total_bill"
order = ['Sun', 'Thur', 'Fri', 'Sat']
pairs = [("Sun", "Thur"), ("Sun", "Sat"), ("Fri", "Sun")]
ax = sns.boxplot(data=df, x=x, y=y, order=order)
annot = Annotator(ax, [("Thur", "Fri"), ("Thur", "Sat"), ("Fri", "Sun")], data=df, x=x, y=y, order=order)
annot.new_plot(ax, pairs=pairs, data=df, x=x, y=y, order=order)
annot.configure(test=None, loc='inside')
annot.set_pvalues([0.1, 0.1, 0.001])
annot.annotate()
plt.show()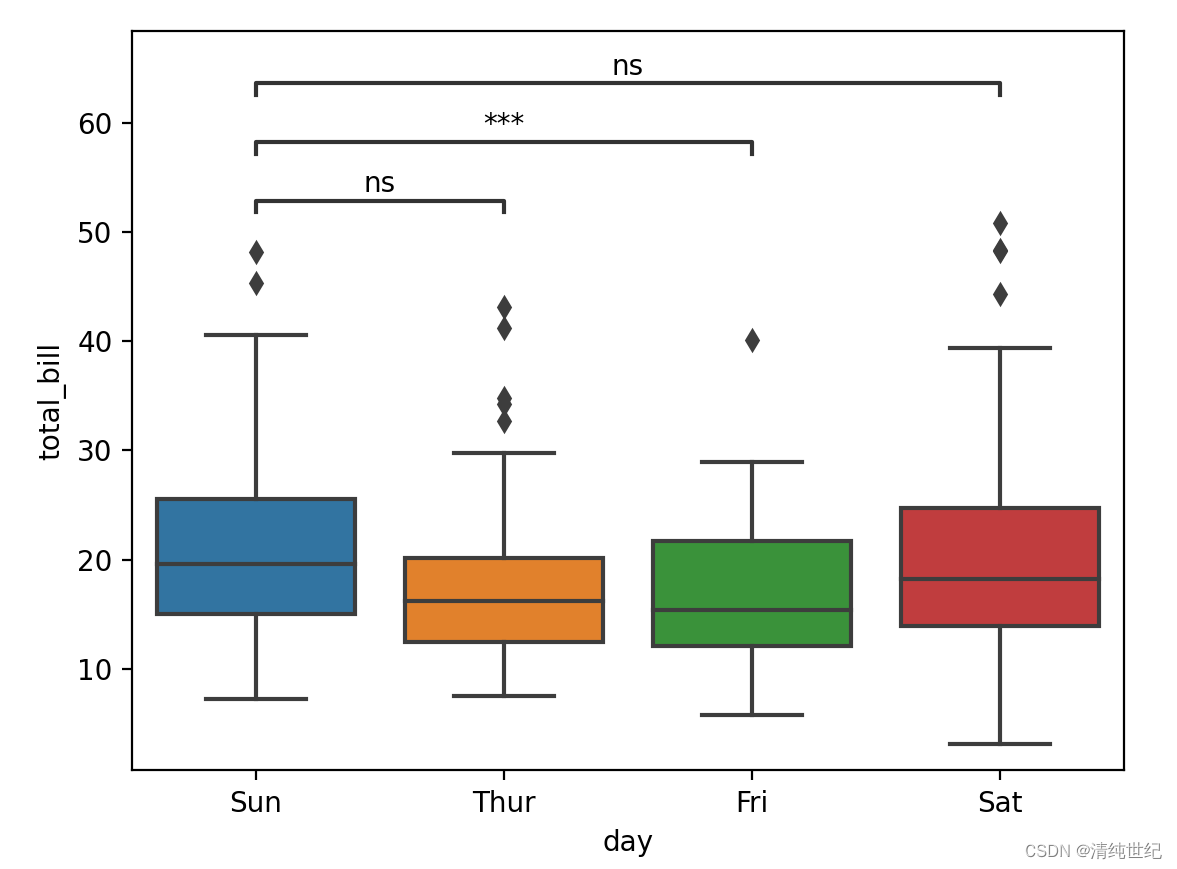
3、Python-statannotations库绘制显著性标注并自己设置标识
在安装的statannotations库文件夹下找到 PValueFormat.py文件并打开
找到下面这个函数,你可以通过修改这个函数添加自己想要的标识效果

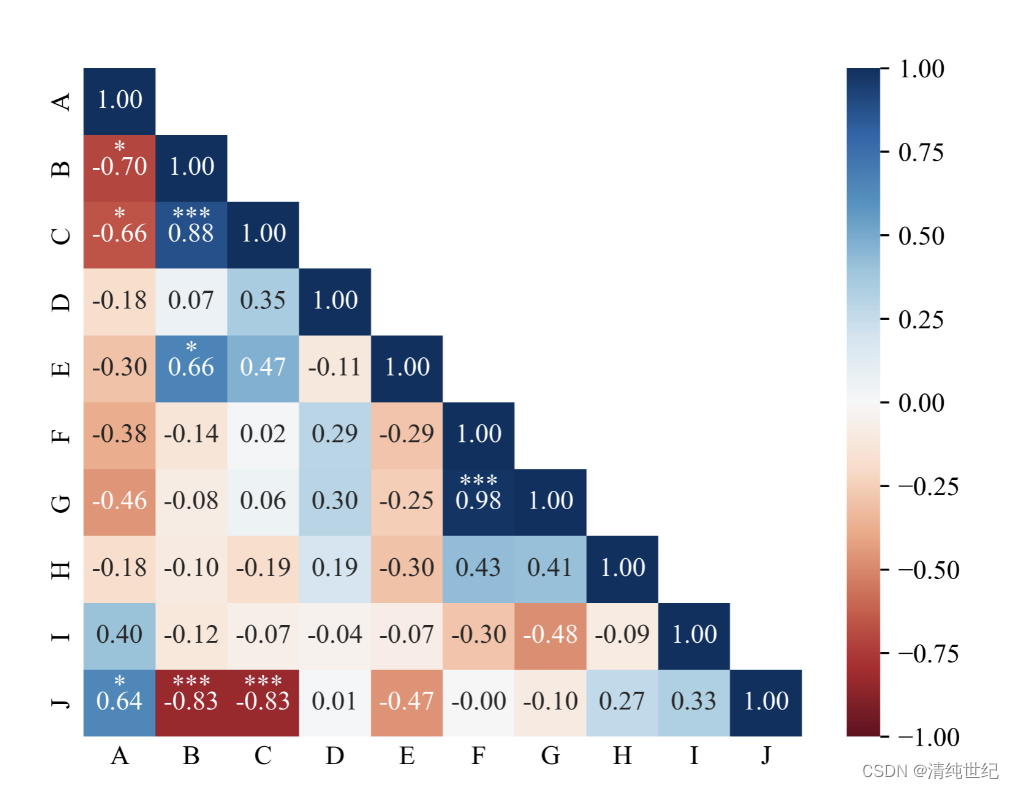
4、相关性热力图自动标记显著性
import pandas as pd
import seaborn as sns
import matplotlib.pyplot as plt
import numpy as np
from scipy.stats import pearsonr
import matplotlib as mpl

def cm2inch(x,y):
    return x/2.54,y/2.54

size1 = 10.5
mpl.rcParams.update(
{
'text.usetex': False,
'font.family': 'stixgeneral',
'mathtext.fontset': 'stix',
"font.family":'serif',
"font.size": size1,
"font.serif": ['Times New Roman'],
}
)
fontdict = {'weight': 'bold','size':size1,'family':'SimHei'}

df_coor=np.random.random((10,10)) # 相关性结果
fig = plt.figure(figsize=(cm2inch(16,12)))
ax1 = plt.gca()

#构造mask,去除重复数据显示
mask = np.zeros_like(df_coor)
mask[np.triu_indices_from(mask)] = True
mask2 = mask
mask = (np.flipud(mask)-1)*(-1)
mask = np.rot90(mask,k = -1)

im1 = sns.heatmap(df_coor,annot=True,cmap="RdBu"
, mask=mask#构造mask,去除重复数据显示
,vmax=1,vmin=-1
, fmt='.2f',ax = ax1)

ax1.tick_params(axis = 'both', length=0)

#计算相关性显著性并显示
rlist = []
plist = []
for i in range(df_coor.shape[0]):
    for j in range(df_coor.shape[0]):
        r,p = pearsonr(df_coor[i],df_coor[j])
        rlist.append(r)
        plist.append(p)

rarr = np.asarray(rlist).reshape(df_coor.shape[0],df_coor.shape[0])
parr = np.asarray(plist).reshape(df_coor.shape[0],df_coor.shape[0])
xlist = ax1.get_xticks()
ylist = ax1.get_yticks()

widthx = 0
widthy = -0.15

for m in ax1.get_xticks():
    for n in ax1.get_yticks():
        pv = (parr[int(m),int(n)])
        rv = (rarr[int(m),int(n)])
        if mask2[int(m),int(n)]<1.:
            if abs(rv) > 0.5:
                if  pv< 0.05 and pv>= 0.01:
                    ax1.text(n+widthx,m+widthy,'*',ha = 'center',color = 'white')
                if  pv< 0.01 and pv>= 0.001:
                    ax1.text(n+widthx,m+widthy,'**',ha = 'center',color = 'white')
                if  pv< 0.001:
                    print([int(m),int(n)])
                    ax1.text(n+widthx,m+widthy,'***',ha = 'center',color = 'white')
            else:
                if  pv< 0.05 and pv>= 0.01:
                    ax1.text(n+widthx,m+widthy,'*',ha = 'center',color = 'k')
                elif  pv< 0.01 and pv>= 0.001:
                    ax1.text(n+widthx,m+widthy,'**',ha = 'center',color = 'k')
                elif  pv< 0.001:
                    ax1.text(n+widthx,m+widthy,'***',ha = 'center',color = 'k')
plt.show()