1 主要思想
分类就是分割数据:
- 两个条件属性:直线;
- 三个条件属性:平面;
- 更多条件属性:超平面。

使用数据:
5.1,3.5,0
4.9,3,0
4.7,3.2,0
4.6,3.1,0
5,3.6,0
5.4,3.9,0
. . .
6.2,2.9,1
5.1,2.5,1
5.7,2.8,1
6.3,3.3,1
2 理论
2.1 线性分割面的表达
平面几何表达直线(两个系数):
y
=
a
x
+
b
.
y = ax + b.
y=ax+b.
重新命名变量:
w
0
+
w
1
x
1
+
w
2
x
2
=
0.
w_0 + w_1 x_1 + w_2 x_2 = 0.
w0+w1x1+w2x2=0.
强行加一个
x
0
≡
1
x_0 \equiv 1
x0≡1:
w
0
x
0
+
w
1
x
1
+
w
2
x
2
=
0.
w_0 x_0 + w_1 x_1 + w_2 x_2 = 0.
w0x0+w1x1+w2x2=0.
向量表达(
x
\mathbf{x}
x为行向量,
w
\mathbf{w}
w为列向量,)
x
w
=
0.
\mathbf{xw} = 0.
xw=0.
2.2 学习与分类
- Logistic regression的学习任务,就是计算向量 w \mathbf{w} w;
- 分类(两个类别):对于新对象 x ′ \mathbf{x}' x′,计算 x ′ w \mathbf{x}'\mathbf{w} x′w,结果小于0则为0类,否则为1类;
- 线性模型(加权和)是机器学习诸多主流方法的核心。
2.3 基本思路
2.3.1 第一种损失函数:
w
\mathbf{w}
w在训练集中
(
X
,
Y
)
(\mathbf{X}, \mathbf{Y})
(X,Y)表现要好。
Heaviside跃迁函数为
H
(
z
)
=
{
0
,
if
z
<
0
,
1
2
,
if
z
=
0
,
1
,
otherwise.
H(z) = \left\{\begin{array}{ll} 0, & \textrm{ if } z < 0,\\ \frac{1}{2}, & \textrm{ if } z = 0,\\ 1, & \textrm{ otherwise.} \end{array}\right.
H(z)=⎩
⎨
⎧0,21,1, if z<0, if z=0, otherwise.
令
X
=
{
x
1
,
…
,
x
m
}
\mathbf{X} = \{\mathbf{x}_1, \dots, \mathbf{x}_m\}
X={x1,…,xm}, 错误率即:
1
m
∑
i
=
1
m
∣
H
(
x
i
w
)
−
y
i
∣
,
\frac{1}{m}\sum_{i = 1}^m |H(\mathbf{x}_i\mathbf{w}) - y_i|,
m1i=1∑m∣H(xiw)−yi∣,
其中
H
(
x
i
w
)
H(\mathbf{x}_i\mathbf{w})
H(xiw)是分类器给的标签,而
y
i
y_i
yi是实际标签。
- 优点:表达了错误率;
- 缺点:函数 H H H不连续,无法使用优化理论。
2.3.2 第二种损失函数
Sigmoid函数:
σ
(
z
)
=
1
1
+
e
−
z
.
\sigma(z) = \frac{1}{1 + e^{-z}}.
σ(z)=1+e−z1.
优点:连续,可导。

Sigmoid函数的导数:
σ
′
(
z
)
=
d
d
z
1
1
+
e
−
z
=
−
1
(
1
+
e
−
z
)
2
(
e
−
z
)
(
−
1
)
=
e
−
z
(
1
+
e
−
z
)
2
=
1
1
+
e
−
z
(
1
−
1
1
+
e
−
z
)
=
σ
(
z
)
(
1
−
σ
(
z
)
)
.
\begin{array}{ll} \sigma'(z) & = \frac{d}{dz}\frac{1}{1 + e^{-z}}\\ & = - \frac{1}{(1 + e^{-z})^2} (e^{-z}) (-1)\\ & = \frac{e^{-z}}{(1 + e^{-z})^2} \\ & = \frac{1}{1 + e^{-z}} (1 - \frac{1}{1 + e^{-z}}) \\ &= \sigma(z) (1 - \sigma(z)). \end{array}
σ′(z)=dzd1+e−z1=−(1+e−z)21(e−z)(−1)=(1+e−z)2e−z=1+e−z1(1−1+e−z1)=σ(z)(1−σ(z)).
令
y
^
i
=
σ
(
x
i
w
)
\hat{y}_i = \sigma(\mathbf{x}_i\mathbf{w})
y^i=σ(xiw),
1
m
∑
i
=
1
m
1
2
(
y
^
i
−
y
i
)
2
,
\frac{1}{m} \sum_{i = 1}^m \frac{1}{2}(\hat{y}_i - y_i)^2,
m1i=1∑m21(y^i−yi)2,
其中平方使得函数连续可导,
1
2
\frac{1}{2}
21是为了适应求导的惯用手法。
缺点:非凸优化, 多个局部最优解
2.3.3 凸与非凸


2.3.4 第三种损失函数(强行看作概率)
由于
0
<
σ
(
z
)
<
1
0 < \sigma(z) < 1
0<σ(z)<1, 将
σ
(
x
i
w
)
\sigma(\mathbf{x}_i \mathbf{w})
σ(xiw)看作类别为1的概率, 即
P
(
y
i
=
1
∣
x
i
;
w
)
=
σ
(
x
i
w
)
,
P(y_i = 1 | \mathbf{x}_i; \mathbf{w}) = \sigma(\mathbf{x}_i \mathbf{w}),
P(yi=1∣xi;w)=σ(xiw),
其中
x
i
\mathbf{x}_i
xi是条件,
w
\mathbf{w}
w是参数。
相应地
P
(
y
i
=
0
∣
x
i
;
w
)
=
1
−
σ
(
x
i
w
)
,
P(y_i = 0 | \mathbf{x}_i; \mathbf{w}) = 1 - \sigma(\mathbf{x}_i \mathbf{w}),
P(yi=0∣xi;w)=1−σ(xiw),
综合上两式, 可得
P
(
y
i
∣
x
i
;
w
)
=
(
σ
(
x
i
w
)
)
y
i
(
1
−
σ
(
x
i
w
)
)
1
−
y
i
P(y_i | \mathbf{x}_i; \mathbf{w}) = (\sigma(\mathbf{x}_i \mathbf{w}))^{y_i} (1 - \sigma(\mathbf{x}_i \mathbf{w}))^{1 - y_i}
P(yi∣xi;w)=(σ(xiw))yi(1−σ(xiw))1−yi
该值越大越好。
假设训练样本独立, 且同等重要。
为获得全局最优, 将不同样本涉及的概率连乘, 获得似然函数:
L
(
w
)
=
P
(
Y
∣
X
;
w
)
=
∏
i
=
1
m
P
(
y
i
∣
x
i
;
w
)
=
∏
i
=
1
m
(
σ
(
x
i
w
)
)
y
i
(
1
−
σ
(
x
i
w
)
)
1
−
y
i
\begin{array}{ll} L(\mathbf{w}) & = P(\mathbf{Y} | \mathbf{X}; \mathbf{w})\\ & = \prod_{i = 1}^m P(y_i | \mathbf{x}_i; \mathbf{w})\\ & = \prod_{i = 1}^m (\sigma(\mathbf{x}_i \mathbf{w}))^{y_i} (1 - \sigma(\mathbf{x}_i \mathbf{w}))^{1 - y_i} \end{array}
L(w)=P(Y∣X;w)=∏i=1mP(yi∣xi;w)=∏i=1m(σ(xiw))yi(1−σ(xiw))1−yi
对数函数具有单调性:
l
(
w
)
=
log
L
(
w
)
=
log
∏
i
=
1
m
P
(
y
i
∣
x
i
;
w
)
=
∑
i
=
1
m
y
i
log
σ
(
x
i
w
)
+
(
1
−
y
i
)
log
(
1
−
σ
(
x
i
w
)
)
\begin{array}{ll} l(\mathbf{w}) & = \log L(\mathbf{w})\\ & = \log \prod_{i = 1}^m P(y_i | \mathbf{x}_i; \mathbf{w})\\ & = \sum_{i = 1}^m {y_i} \log \sigma(\mathbf{x}_i \mathbf{w}) + (1 - y_i) \log (1 - \sigma(\mathbf{x}_i \mathbf{w})) \end{array}
l(w)=logL(w)=log∏i=1mP(yi∣xi;w)=∑i=1myilogσ(xiw)+(1−yi)log(1−σ(xiw))
平均损失:
- L ( w ) L(\mathbf{w}) L(w), l ( w ) l(\mathbf{w}) l(w)越大越好;
- l ( w ) l(\mathbf{w}) l(w)为负值;
- 求相反数, 除以实例个数, 损失函数:
1 m ∑ i = 1 m − y i log σ ( x i w ) − ( 1 − y i ) log ( 1 − σ ( x i w ) ) . \frac{1}{m} \sum_{i = 1}^m - {y_i} \log \sigma(\mathbf{x}_i \mathbf{w}) - (1 - y_i) \log (1 - \sigma(\mathbf{x}_i \mathbf{w})). m1i=1∑m−yilogσ(xiw)−(1−yi)log(1−σ(xiw)).
分析:
- y i = 0 y_i = 0 yi=0 时退化为 − log ( 1 − σ ( x i w ) ) - \log(1 - \sigma(\mathbf{x}_i \mathbf{w})) −log(1−σ(xiw)), σ ( x i w ) \sigma(\mathbf{x}_i \mathbf{w}) σ(xiw)越接近0越损失越小;
- y i = 1 y_i = 1 yi=1 时退化为 − log σ ( x i w ) - \log \sigma(\mathbf{x}_i \mathbf{w}) −logσ(xiw), σ ( x i w ) \sigma(\mathbf{x}_i \mathbf{w}) σ(xiw)越接近1越损失越小。
优化目标:
min
w
1
m
∑
i
=
1
m
−
y
i
log
σ
(
x
i
w
)
−
(
1
−
y
i
)
log
(
1
−
σ
(
x
i
w
)
)
.
\min_\mathbf{w} \frac{1}{m} \sum_{i = 1}^m - {y_i} \log \sigma(\mathbf{x}_i \mathbf{w}) - (1 - y_i) \log (1 - \sigma(\mathbf{x}_i \mathbf{w})).
wminm1i=1∑m−yilogσ(xiw)−(1−yi)log(1−σ(xiw)).
2.4 梯度下降法
梯度下降法是机器学习的一种主流优化方法
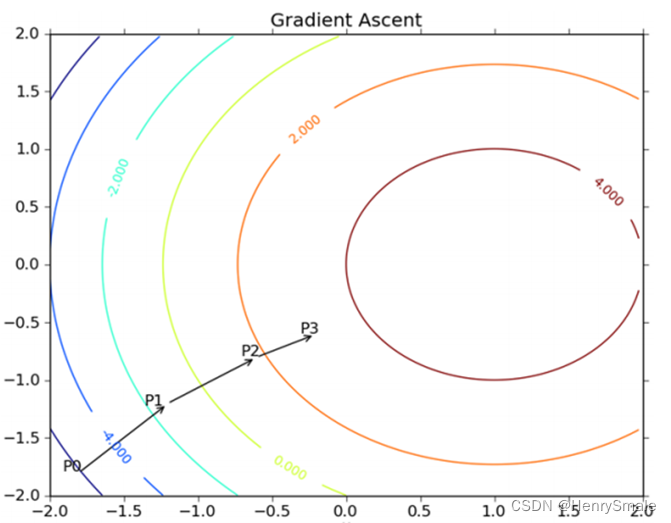
迭代式推导:
由于
l
(
w
)
=
∑
i
=
1
m
y
i
log
σ
(
x
i
w
)
+
(
1
−
y
i
)
log
(
1
−
σ
(
x
i
w
)
)
l(\mathbf{w}) = \sum_{i = 1}^m y_i \log \sigma(\mathbf{x}_i \mathbf{w}) + (1 - y_i) \log (1 - \sigma(\mathbf{x}_i \mathbf{w}))
l(w)=i=1∑myilogσ(xiw)+(1−yi)log(1−σ(xiw))
∂
l
(
w
)
∂
w
j
=
∑
i
=
1
m
(
y
i
σ
(
x
i
w
)
−
1
−
y
i
1
−
σ
(
x
i
w
)
)
∂
σ
(
x
i
w
)
∂
w
j
=
∑
i
=
1
m
(
y
i
σ
(
x
i
w
)
−
1
−
y
i
1
−
σ
(
x
i
w
)
)
σ
(
x
i
w
)
(
1
−
σ
(
x
i
w
)
)
∂
x
i
w
∂
w
j
=
∑
i
=
1
m
(
y
i
σ
(
x
i
w
)
−
1
−
y
i
1
−
σ
(
x
i
w
)
)
σ
(
x
i
w
)
(
1
−
σ
(
x
i
w
)
)
x
i
j
=
∑
i
=
1
m
(
y
i
−
σ
(
x
i
w
)
)
x
i
j
\begin{array}{ll} \frac{\partial l(\mathbf{w})}{\partial w_j} & = \sum_{i = 1}^m \left(\frac{y_i}{\sigma(\mathbf{x}_i \mathbf{w})} - \frac{1 - y_i}{1 - \sigma(\mathbf{x}_i \mathbf{w})}\right) \frac{\partial \sigma(\mathbf{x}_i \mathbf{w})}{\partial w_j}\\ & = \sum_{i = 1}^m \left(\frac{y_i}{\sigma(\mathbf{x}_i \mathbf{w})} - \frac{1 - y_i}{1 - \sigma(\mathbf{x}_i \mathbf{w})}\right) \sigma(\mathbf{x}_i \mathbf{w}) (1 - \sigma(\mathbf{x}_i \mathbf{w})) \frac{\partial \mathbf{x}_i \mathbf{w}}{\partial w_j}\\ & = \sum_{i = 1}^m \left(\frac{y_i}{\sigma(\mathbf{x}_i \mathbf{w})} - \frac{1 - y_i}{1 - \sigma(\mathbf{x}_i \mathbf{w})}\right) \sigma(\mathbf{x}_i \mathbf{w}) (1 - \sigma(\mathbf{x}_i \mathbf{w})) x_{ij}\\ & = \sum_{i = 1}^m (y_i - \sigma(\mathbf{x}_i \mathbf{w})) x_{ij} \end{array}
∂wj∂l(w)=∑i=1m(σ(xiw)yi−1−σ(xiw)1−yi)∂wj∂σ(xiw)=∑i=1m(σ(xiw)yi−1−σ(xiw)1−yi)σ(xiw)(1−σ(xiw))∂wj∂xiw=∑i=1m(σ(xiw)yi−1−σ(xiw)1−yi)σ(xiw)(1−σ(xiw))xij=∑i=1m(yi−σ(xiw))xij
3 程序分析
3.1 Sigmoid函数
return 1.0/(1 + np.exp(-paraX))
3.2 使用sklearn
#Test my implemenation of Logistic regression and existing one.
import time, sklearn
import sklearn.datasets, sklearn.neighbors, sklearn.linear_model
import matplotlib.pyplot as plt
import numpy as np

"""
The version using sklearn,支持多个决策属性值
"""
def sklearnLogisticTest():
    #Step 1. Load the dataset
    tempDataset = sklearn.datasets.load_iris()
    x = tempDataset.data
    y = tempDataset.target

    #Step 2. Classify
    tempClassifier = sklearn.linear_model.LogisticRegression()
    tempStartTime = time.time()
    tempClassifier.fit(x, y)
    tempScore = tempClassifier.score(x, y)
    tempEndTime = time.time()
    tempRuntime = tempEndTime - tempStartTime

    #Step 3. Output
    print('sklearn score: {}, runtime = {}'.format(tempScore, tempRuntime))

"""
The sigmoid function, map to range (0, 1)
"""
def sigmoid(paraX):
    return 1.0/(1 + np.exp(-paraX))

"""
Illustrate the sigmoid function.
Not used in the learning process.
"""
def sigmoidPlotTest():
    xValue = np.linspace(-6, 6, 20)
    #print("xValue = ", xValue)
    yValue = sigmoid(xValue)
    x2Value = np.linspace(-60, 60, 120)
    y2Value = sigmoid(x2Value)
    fig = plt.figure()
    ax1 = fig.add_subplot(2, 1, 1)
    ax1.plot(xValue, yValue)
    ax1.set_xlabel('x')
    ax1.set_ylabel('sigmoid(x)')
    ax2 = fig.add_subplot(2, 1, 2)
    ax2.plot(x2Value, y2Value)
    ax2.set_xlabel('x')
    ax2.set_ylabel('sigmoid(x)')
    plt.show()

"""
函数:梯度上升算法,核心
"""
def gradAscent(dataMat,labelMat):
    dataSet = np.mat(dataMat)                          # m*n
    labelSet = np.mat(labelMat).transpose()            # 1*m->m*1
    m, n = np.shape(dataSet)                            # m*n: m个样本,n个特征
    alpha = 0.001                                      # 学习步长
    maxCycles = 1000                                    # 最大迭代次数
    weights = np.ones( (n,1) )
    for i in range(maxCycles):
        y = sigmoid(dataSet * weights)                 # 预测值
        error = labelSet - y
        weights = weights + alpha * dataSet.transpose() * error
    return weights

"""
函数:画出决策边界,仅为演示用,且仅支持两个条件属性的数据
"""
def plotBestFit(paraWeights):
    dataMat, labelMat = loadDataSet()
    dataArr=np.array(dataMat)
    m,n=np.shape(dataArr)
    x1=[]           #x1,y1:类别为1的特征
    x2=[]           #x2,y2:类别为2的特征
    y1=[]
    y2=[]
    for i in range(m):
        if (labelMat[i])==1:
            x1.append(dataArr[i,1])
            y1.append(dataArr[i,2])
        else:
            x2.append(dataArr[i,1])
            y2.append(dataArr[i,2])

    fig=plt.figure()
    ax=fig.add_subplot(111)
    ax.scatter(x1,y1,s=30,c='red',marker='s')
    ax.scatter(x2,y2,s=30,c='green')

    #画出拟合直线
    x=np.arange(3, 7.0, 0.1)
    y=(-paraWeights[0]-paraWeights[1]*x)/paraWeights[2]    #直线满足关系:0=w0*1.0+w1*x1+w2*x2
    ax.plot(x,y)

    plt.xlabel('a1')
    plt.ylabel('a2')
    plt.show()

"""
读数据, csv格式
"""
def loadDataSet(paraFilename="data/iris2class.txt"):
    dataMat=[]  #列表list
    labelMat=[]
    txt=open(paraFilename)
    for line in txt.readlines():
        tempValuesStringArray = np.array(line.replace("\n", "").split(','))
        tempValues = [float(tempValue) for tempValue in tempValuesStringArray]
        tempArray = [1.0] + [tempValue for tempValue in tempValues]
        tempx = tempArray[:-1] #不要最后一列
        tempy = tempArray[-1] #仅最后一列

        dataMat.append(tempx)
        labelMat.append(tempy)

    #print("dataMat = ", dataMat)
    #print("labelMat = ", labelMat)
    return dataMat,labelMat

"""
Logistic regression分类
"""
def mfLogisticClassifierTest():
    #Step 1. Load the dataset and initialize
    #如果括号内不写数据,则使用4个属性前2个类别的iris
    x, y = loadDataSet("data/iris2condition2class.csv")

    #tempDataset = sklearn.datasets.load_iris()
    #x = tempDataset.data
    #y = tempDataset.target

    tempStartTime = time.time()
    tempScore = 0
    numInstances = len(y)
    #Step 2. Train
    weights = gradAscent(x, y)

    #Step 2. Classify
    tempPredicts = np.zeros((numInstances))

    #Leave one out
    for i in range(numInstances):
        tempPrediction = x[i] * weights
        #print("x[i] = {}, weights = {}, tempPrediction = {}".format(x[i], weights, tempPrediction))
        if tempPrediction > 0:
            tempPredicts[i] = 1
        else:
            tempPredicts[i] = 0

    #Step 3. Which are correct?
    tempCorrect = 0
    for i in range(numInstances):
        if tempPredicts[i] == y[i]:
            tempCorrect += 1

    tempScore = tempCorrect / numInstances

    tempEndTime = time.time()
    tempRuntime = tempEndTime - tempStartTime

    #Step 4. Output
    print('Mf logistic socre: {}, runtime = {}'.format(tempScore, tempRuntime))

    #Step 5. Illustrate 仅对两个属性情况有效
    rowWeights = np.transpose(weights).A[0]
    plotBestFit(rowWeights)

def main():
    #sklearnLogisticTest()
    mfLogisticClassifierTest()
    #sigmoidPlotTest()

main()






![[牛客网] HJ35 蛇形矩阵(写了好久才写出来)](https://img-blog.csdnimg.cn/img_convert/80d01f56b0444a6a8dc055e3702c3241.png)


![[SQL]增删查改语法概览](https://img-blog.csdnimg.cn/img_convert/d10a154046e85e775e87731972b922ef.png)


