1、简介
1.1 Prometheus
官网地址:https://prometheus.io/
Prometheus是一个开源的监控系统,起源于SoundCloud。它由以下几个核心组件构成:
数据爬虫: 根据配置的时间定期的通过HTTP抓去metrics数据。
time-series 数据库: 存储所有的metrics数据。
简单的用户交互接口: 可视化、查询和监控所有的metrics。

1.2 Grafana
官网地址:https://grafana.com/
Grafana使你能够把来自不同数据源比如Elasticsearch, Prometheus, Graphite, influxDB等多样的数据以绚丽的图标展示出来。它也能基于你的metrics数据发出告警。当一个告警状态改变时,它能通知你通过email,slack或者其他途径。
Grafana是一个开源的度量分析与可视化套件,纯JavaScript开发的前端工具,通过访问库(如InfluxDB),展示自定义报表、显示图表等。它的UI十分灵活,有丰富的插件和模板,功能强大。一般用在时序数据的监控方面。
2、项目
2.1 引入依赖
<dependency>
    <groupId>org.springframework.boot</groupId>
    <artifactId>spring-boot-starter-actuator</artifactId>
</dependency>

<dependency>
    <groupId>io.micrometer</groupId>
    <artifactId>micrometer-registry-prometheus</artifactId>
    <scope>runtime</scope>
</dependency>
2.2 配置文件
management:
  metrics:
    tags:
      application: ${spring.application.name}
    export:
      prometheus:
        enabled: true
  #开启暴露web
  endpoints:
    web:
      exposure:
        include: prometheus
2.3 访问地址
http://localhost:8080/actuator/prometheus
# HELP jvm_gc_memory_promoted_bytes_total Count of positive increases in the size of the old generation memory pool before GC to after GC
# TYPE jvm_gc_memory_promoted_bytes_total counter
jvm_gc_memory_promoted_bytes_total{application="prometheus-demo",} 3765576.0
# HELP executor_queue_remaining_tasks The number of additional elements that this queue can ideally accept without blocking
# TYPE executor_queue_remaining_tasks gauge
executor_queue_remaining_tasks{application="prometheus-demo",name="applicationTaskExecutor",} 2.147483647E9
# HELP jvm_gc_pause_seconds Time spent in GC pause
# TYPE jvm_gc_pause_seconds summary
jvm_gc_pause_seconds_count{action="end of minor GC",application="prometheus-demo",cause="Allocation Failure",} 1.0
jvm_gc_pause_seconds_sum{action="end of minor GC",application="prometheus-demo",cause="Allocation Failure",} 0.012
jvm_gc_pause_seconds_count{action="end of major GC",application="prometheus-demo",cause="Ergonomics",} 1.0
jvm_gc_pause_seconds_sum{action="end of major GC",application="prometheus-demo",cause="Ergonomics",} 0.078
# HELP jvm_gc_pause_seconds_max Time spent in GC pause
# TYPE jvm_gc_pause_seconds_max gauge
jvm_gc_pause_seconds_max{action="end of minor GC",application="prometheus-demo",cause="Allocation Failure",} 0.012
jvm_gc_pause_seconds_max{action="end of major GC",application="prometheus-demo",cause="Ergonomics",} 0.078
# HELP tomcat_sessions_active_current_sessions
# TYPE tomcat_sessions_active_current_sessions gauge
tomcat_sessions_active_current_sessions{application="prometheus-demo",} 0.0
# HELP jvm_threads_daemon_threads The current number of live daemon threads
# TYPE jvm_threads_daemon_threads gauge
jvm_threads_daemon_threads{application="prometheus-demo",} 15.0
# HELP process_files_max_files The maximum file descriptor count
# TYPE process_files_max_files gauge
process_files_max_files{application="prometheus-demo",} 65535.0
# HELP http_server_requests_seconds Duration of HTTP server request handling
# TYPE http_server_requests_seconds summary
http_server_requests_seconds_count{application="prometheus-demo",exception="None",method="GET",outcome="SUCCESS",status="200",uri="/actuator",} 1.0
http_server_requests_seconds_sum{application="prometheus-demo",exception="None",method="GET",outcome="SUCCESS",status="200",uri="/actuator",} 0.017622173
http_server_requests_seconds_count{application="prometheus-demo",exception="None",method="GET",outcome="SUCCESS",status="200",uri="/actuator/prometheus",} 8.0
http_server_requests_seconds_sum{application="prometheus-demo",exception="None",method="GET",outcome="SUCCESS",status="200",uri="/actuator/prometheus",} 0.14188689
http_server_requests_seconds_count{application="prometheus-demo",exception="None",method="GET",outcome="CLIENT_ERROR",status="404",uri="/**",} 2.0
http_server_requests_seconds_sum{application="prometheus-demo",exception="None",method="GET",outcome="CLIENT_ERROR",status="404",uri="/**",} 0.020303186
# HELP http_server_requests_seconds_max Duration of HTTP server request handling
# TYPE http_server_requests_seconds_max gauge
http_server_requests_seconds_max{application="prometheus-demo",exception="None",method="GET",outcome="SUCCESS",status="200",uri="/actuator",} 0.017622173
http_server_requests_seconds_max{application="prometheus-demo",exception="None",method="GET",outcome="SUCCESS",status="200",uri="/actuator/prometheus",} 0.093066747
http_server_requests_seconds_max{application="prometheus-demo",exception="None",method="GET",outcome="CLIENT_ERROR",status="404",uri="/**",} 0.017153903
# HELP jvm_gc_memory_allocated_bytes_total Incremented for an increase in the size of the (young) heap memory pool after one GC to before the next
# TYPE jvm_gc_memory_allocated_bytes_total counter
jvm_gc_memory_allocated_bytes_total{application="prometheus-demo",} 8.0216064E7
# HELP jvm_threads_live_threads The current number of live threads including both daemon and non-daemon threads
# TYPE jvm_threads_live_threads gauge
jvm_threads_live_threads{application="prometheus-demo",} 19.0
# HELP tomcat_sessions_active_max_sessions
# TYPE tomcat_sessions_active_max_sessions gauge
tomcat_sessions_active_max_sessions{application="prometheus-demo",} 0.0
# HELP jvm_threads_states_threads The current number of threads
# TYPE jvm_threads_states_threads gauge
jvm_threads_states_threads{application="prometheus-demo",state="runnable",} 5.0
jvm_threads_states_threads{application="prometheus-demo",state="new",} 0.0
jvm_threads_states_threads{application="prometheus-demo",state="timed-waiting",} 2.0
jvm_threads_states_threads{application="prometheus-demo",state="blocked",} 0.0
jvm_threads_states_threads{application="prometheus-demo",state="waiting",} 12.0
jvm_threads_states_threads{application="prometheus-demo",state="terminated",} 0.0
# HELP jvm_classes_loaded_classes The number of classes that are currently loaded in the Java virtual machine
# TYPE jvm_classes_loaded_classes gauge
jvm_classes_loaded_classes{application="prometheus-demo",} 7335.0
# HELP process_uptime_seconds The uptime of the Java virtual machine
# TYPE process_uptime_seconds gauge
process_uptime_seconds{application="prometheus-demo",} 134.962
# HELP executor_queued_tasks The approximate number of tasks that are queued for execution
# TYPE executor_queued_tasks gauge
executor_queued_tasks{application="prometheus-demo",name="applicationTaskExecutor",} 0.0
# HELP process_files_open_files The open file descriptor count
# TYPE process_files_open_files gauge
process_files_open_files{application="prometheus-demo",} 28.0
# HELP process_cpu_usage The "recent cpu usage" for the Java Virtual Machine process
# TYPE process_cpu_usage gauge
process_cpu_usage{application="prometheus-demo",} 0.003040668947168377
# HELP disk_total_bytes Total space for path
# TYPE disk_total_bytes gauge
disk_total_bytes{application="prometheus-demo",path="/root/project/prometheus/share/prometheus/prometheus-demo/target/.",} 8.4416294912E10
# HELP application_started_time_seconds Time taken (ms) to start the application
# TYPE application_started_time_seconds gauge
application_started_time_seconds{application="prometheus-demo",main_application_class="com.ybw.PrometheusDemoApplication",} 3.1
# HELP system_load_average_1m The sum of the number of runnable entities queued to available processors and the number of runnable entities running on the available processors averaged over a period of time
# TYPE system_load_average_1m gauge
system_load_average_1m{application="prometheus-demo",} 0.04
# HELP disk_free_bytes Usable space for path
# TYPE disk_free_bytes gauge
disk_free_bytes{application="prometheus-demo",path="/root/project/prometheus/share/prometheus/prometheus-demo/target/.",} 6.4089042944E10
# HELP process_start_time_seconds Start time of the process since unix epoch.
# TYPE process_start_time_seconds gauge
process_start_time_seconds{application="prometheus-demo",} 1.676960826636E9
# HELP application_ready_time_seconds Time taken (ms) for the application to be ready to service requests
# TYPE application_ready_time_seconds gauge
application_ready_time_seconds{application="prometheus-demo",main_application_class="com.ybw.PrometheusDemoApplication",} 3.135
# HELP jvm_memory_used_bytes The amount of used memory
# TYPE jvm_memory_used_bytes gauge
jvm_memory_used_bytes{application="prometheus-demo",area="heap",id="PS Survivor Space",} 522208.0
jvm_memory_used_bytes{application="prometheus-demo",area="heap",id="PS Old Gen",} 1.1626216E7
jvm_memory_used_bytes{application="prometheus-demo",area="nonheap",id="Metaspace",} 3.7158344E7
jvm_memory_used_bytes{application="prometheus-demo",area="nonheap",id="Code Cache",} 9744256.0
jvm_memory_used_bytes{application="prometheus-demo",area="heap",id="PS Eden Space",} 8.0009112E7
jvm_memory_used_bytes{application="prometheus-demo",area="nonheap",id="Compressed Class Space",} 5006064.0
# HELP jvm_gc_live_data_size_bytes Size of long-lived heap memory pool after reclamation
# TYPE jvm_gc_live_data_size_bytes gauge
jvm_gc_live_data_size_bytes{application="prometheus-demo",} 1.1626216E7
# HELP jvm_buffer_count_buffers An estimate of the number of buffers in the pool
# TYPE jvm_buffer_count_buffers gauge
jvm_buffer_count_buffers{application="prometheus-demo",id="mapped",} 0.0
jvm_buffer_count_buffers{application="prometheus-demo",id="direct",} 10.0
# HELP jvm_memory_committed_bytes The amount of memory in bytes that is committed for the Java virtual machine to use
# TYPE jvm_memory_committed_bytes gauge
jvm_memory_committed_bytes{application="prometheus-demo",area="heap",id="PS Survivor Space",} 2621440.0
jvm_memory_committed_bytes{application="prometheus-demo",area="heap",id="PS Old Gen",} 1.6252928E7
jvm_memory_committed_bytes{application="prometheus-demo",area="nonheap",id="Metaspace",} 4.0108032E7
jvm_memory_committed_bytes{application="prometheus-demo",area="nonheap",id="Code Cache",} 1.015808E7
jvm_memory_committed_bytes{application="prometheus-demo",area="heap",id="PS Eden Space",} 9.2274688E7
jvm_memory_committed_bytes{application="prometheus-demo",area="nonheap",id="Compressed Class Space",} 5505024.0
# HELP tomcat_sessions_created_sessions_total
# TYPE tomcat_sessions_created_sessions_total counter
tomcat_sessions_created_sessions_total{application="prometheus-demo",} 0.0
# HELP executor_pool_size_threads The current number of threads in the pool
# TYPE executor_pool_size_threads gauge
executor_pool_size_threads{application="prometheus-demo",name="applicationTaskExecutor",} 0.0
# HELP executor_completed_tasks_total The approximate total number of tasks that have completed execution
# TYPE executor_completed_tasks_total counter
executor_completed_tasks_total{application="prometheus-demo",name="applicationTaskExecutor",} 0.0
# HELP system_cpu_usage The "recent cpu usage" of the system the application is running in
# TYPE system_cpu_usage gauge
system_cpu_usage{application="prometheus-demo",} 0.01596351197263398
# HELP executor_pool_core_threads The core number of threads for the pool
# TYPE executor_pool_core_threads gauge
executor_pool_core_threads{application="prometheus-demo",name="applicationTaskExecutor",} 8.0
# HELP jvm_memory_max_bytes The maximum amount of memory in bytes that can be used for memory management
# TYPE jvm_memory_max_bytes gauge
jvm_memory_max_bytes{application="prometheus-demo",area="heap",id="PS Survivor Space",} 2621440.0
jvm_memory_max_bytes{application="prometheus-demo",area="heap",id="PS Old Gen",} 1.32120576E9
jvm_memory_max_bytes{application="prometheus-demo",area="nonheap",id="Metaspace",} -1.0
jvm_memory_max_bytes{application="prometheus-demo",area="nonheap",id="Code Cache",} 2.5165824E8
jvm_memory_max_bytes{application="prometheus-demo",area="heap",id="PS Eden Space",} 6.53787136E8
jvm_memory_max_bytes{application="prometheus-demo",area="nonheap",id="Compressed Class Space",} 1.073741824E9
# HELP executor_pool_max_threads The maximum allowed number of threads in the pool
# TYPE executor_pool_max_threads gauge
executor_pool_max_threads{application="prometheus-demo",name="applicationTaskExecutor",} 2.147483647E9
# HELP jvm_buffer_memory_used_bytes An estimate of the memory that the Java virtual machine is using for this buffer pool
# TYPE jvm_buffer_memory_used_bytes gauge
jvm_buffer_memory_used_bytes{application="prometheus-demo",id="mapped",} 0.0
jvm_buffer_memory_used_bytes{application="prometheus-demo",id="direct",} 81920.0
# HELP system_cpu_count The number of processors available to the Java virtual machine
# TYPE system_cpu_count gauge
system_cpu_count{application="prometheus-demo",} 2.0
# HELP jvm_classes_unloaded_classes_total The total number of classes unloaded since the Java virtual machine has started execution
# TYPE jvm_classes_unloaded_classes_total counter
jvm_classes_unloaded_classes_total{application="prometheus-demo",} 1.0
# HELP jvm_gc_overhead_percent An approximation of the percent of CPU time used by GC activities over the last lookback period or since monitoring began, whichever is shorter, in the range [0..1]
# TYPE jvm_gc_overhead_percent gauge
jvm_gc_overhead_percent{application="prometheus-demo",} 6.81195699160739E-4
# HELP jvm_buffer_total_capacity_bytes An estimate of the total capacity of the buffers in this pool
# TYPE jvm_buffer_total_capacity_bytes gauge
jvm_buffer_total_capacity_bytes{application="prometheus-demo",id="mapped",} 0.0
jvm_buffer_total_capacity_bytes{application="prometheus-demo",id="direct",} 81920.0
# HELP tomcat_sessions_alive_max_seconds
# TYPE tomcat_sessions_alive_max_seconds gauge
tomcat_sessions_alive_max_seconds{application="prometheus-demo",} 0.0
# HELP jvm_threads_peak_threads The peak live thread count since the Java virtual machine started or peak was reset
# TYPE jvm_threads_peak_threads gauge
jvm_threads_peak_threads{application="prometheus-demo",} 19.0
# HELP executor_active_threads The approximate number of threads that are actively executing tasks
# TYPE executor_active_threads gauge
executor_active_threads{application="prometheus-demo",name="applicationTaskExecutor",} 0.0
# HELP jvm_gc_max_data_size_bytes Max size of long-lived heap memory pool
# TYPE jvm_gc_max_data_size_bytes gauge
jvm_gc_max_data_size_bytes{application="prometheus-demo",} 1.32120576E9
# HELP tomcat_sessions_expired_sessions_total
# TYPE tomcat_sessions_expired_sessions_total counter
tomcat_sessions_expired_sessions_total{application="prometheus-demo",} 0.0
# HELP logback_events_total Number of events that made it to the logs
# TYPE logback_events_total counter
logback_events_total{application="prometheus-demo",level="info",} 6.0
logback_events_total{application="prometheus-demo",level="trace",} 0.0
logback_events_total{application="prometheus-demo",level="warn",} 0.0
logback_events_total{application="prometheus-demo",level="debug",} 0.0
logback_events_total{application="prometheus-demo",level="error",} 0.0
# HELP tomcat_sessions_rejected_sessions_total
# TYPE tomcat_sessions_rejected_sessions_total counter
tomcat_sessions_rejected_sessions_total{application="prometheus-demo",} 0.0
# HELP jvm_memory_usage_after_gc_percent The percentage of long-lived heap pool used after the last GC event, in the range [0..1]
# TYPE jvm_memory_usage_after_gc_percent gauge
jvm_memory_usage_after_gc_percent{application="prometheus-demo",area="heap",pool="long-lived",} 0.008799701266818576
3、安装
3.1 Prometheus安装
我们使用docker进行安装。
首先拉去镜像
# 拉取docker镜像
docker pull prom/prometheus准备配置文件prometheus.yml,${host1}、${host2}为变量,例如可以替换为localhost:8080
scrape_configs:
# 可随意指定
- job_name: 'spring'
  # 多久采集一次数据
  scrape_interval: 15s
  # 采集时的超时时间
  scrape_timeout: 10s
  # 采集的路径
  metrics_path: '/actuator/prometheus'
  # 采集服务的地址,设置成Springboot应用所在服务器的具体地址
  static_configs:
  - targets: ['${host1}','${host2}']
启动
--log.level=debug:日志以debug输出
--storage.tsdb.retention.time=3d,数据保留3天
--config.file=/etc/prometheus/prometheus.yml:容器里面的默认路径
docker run -d -p 9090:9090 -v /root/docker-images/prometheus/prometheus.yml:/etc/prometheus/prometheus.yml --name prometheus prom/prometheus:latest --log.level=debug --storage.tsdb.retention.time=3d --config.file=/etc/prometheus/prometheus.yml或者启动脚本
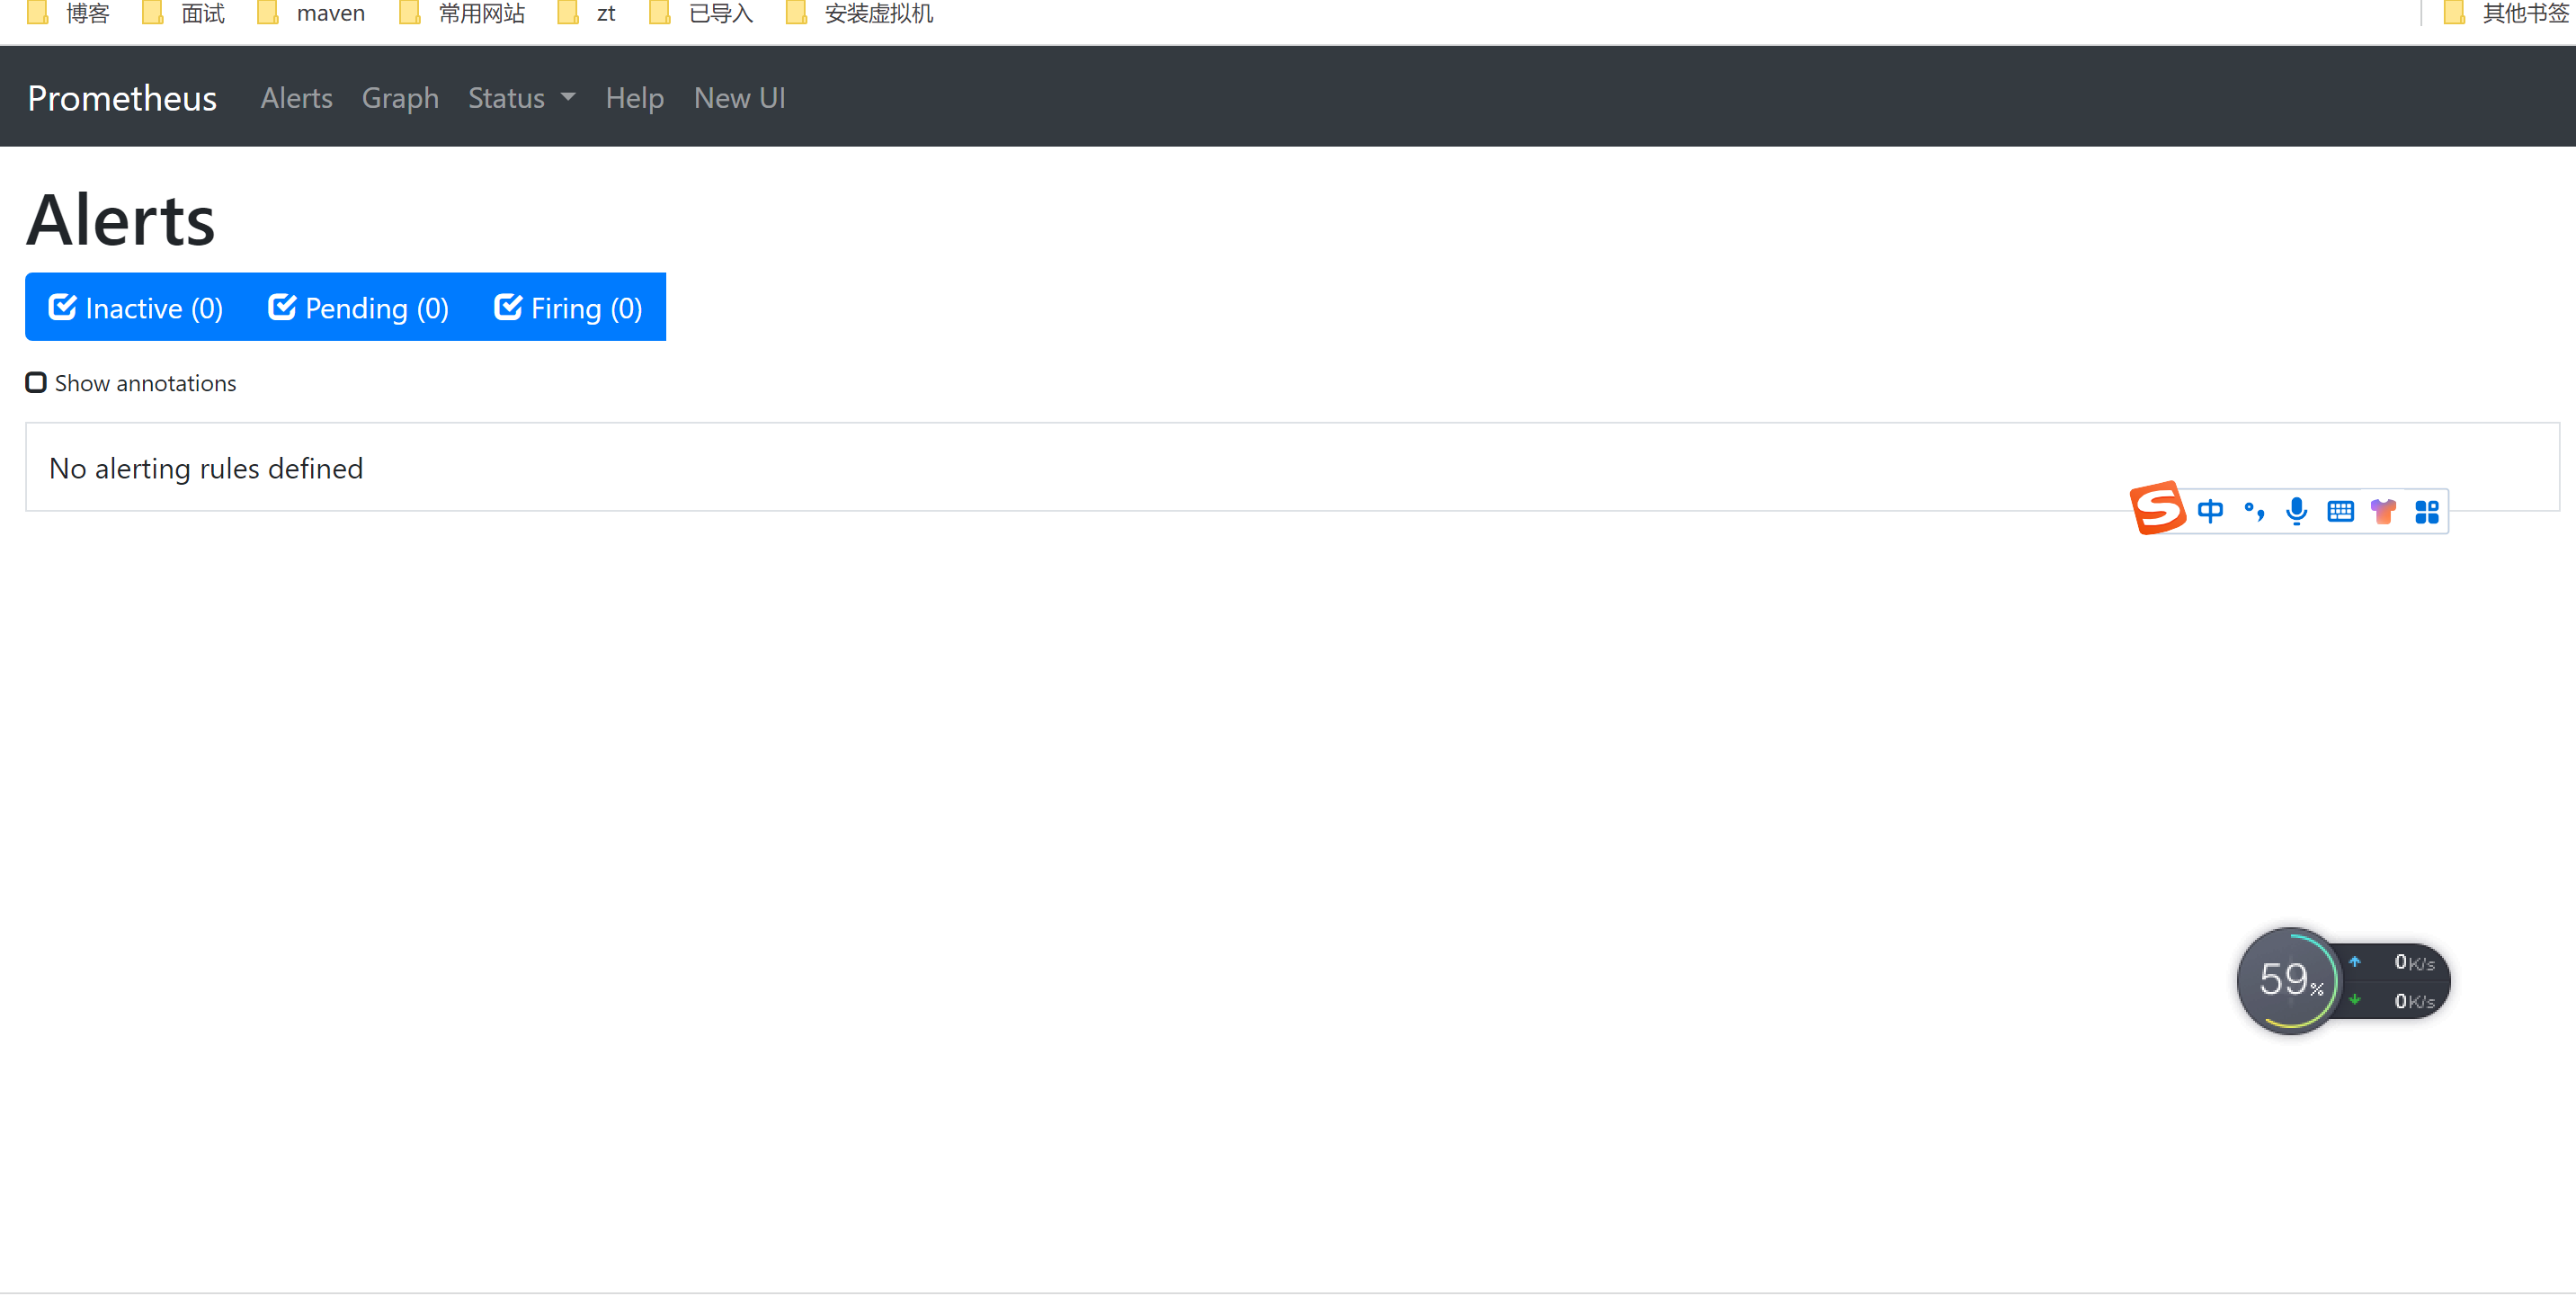
docker run -d -p 9090:9090 -v /root/docker-images/prometheus/prometheus.yml:/etc/prometheus/prometheus.yml --name prometheus prom/prometheus:latest --config.file=/etc/prometheus/prometheus.yml启动成功后,访问地址:http://${ip}:9090/,页面展示
3.2 Grafana安装
拉去镜像
docker pull grafana/grafana运行示例
docker run -d -p 3000:3000 grafana/grafana访问地址:http://localhost:3000
账号:admin
密码:admin
页面展示
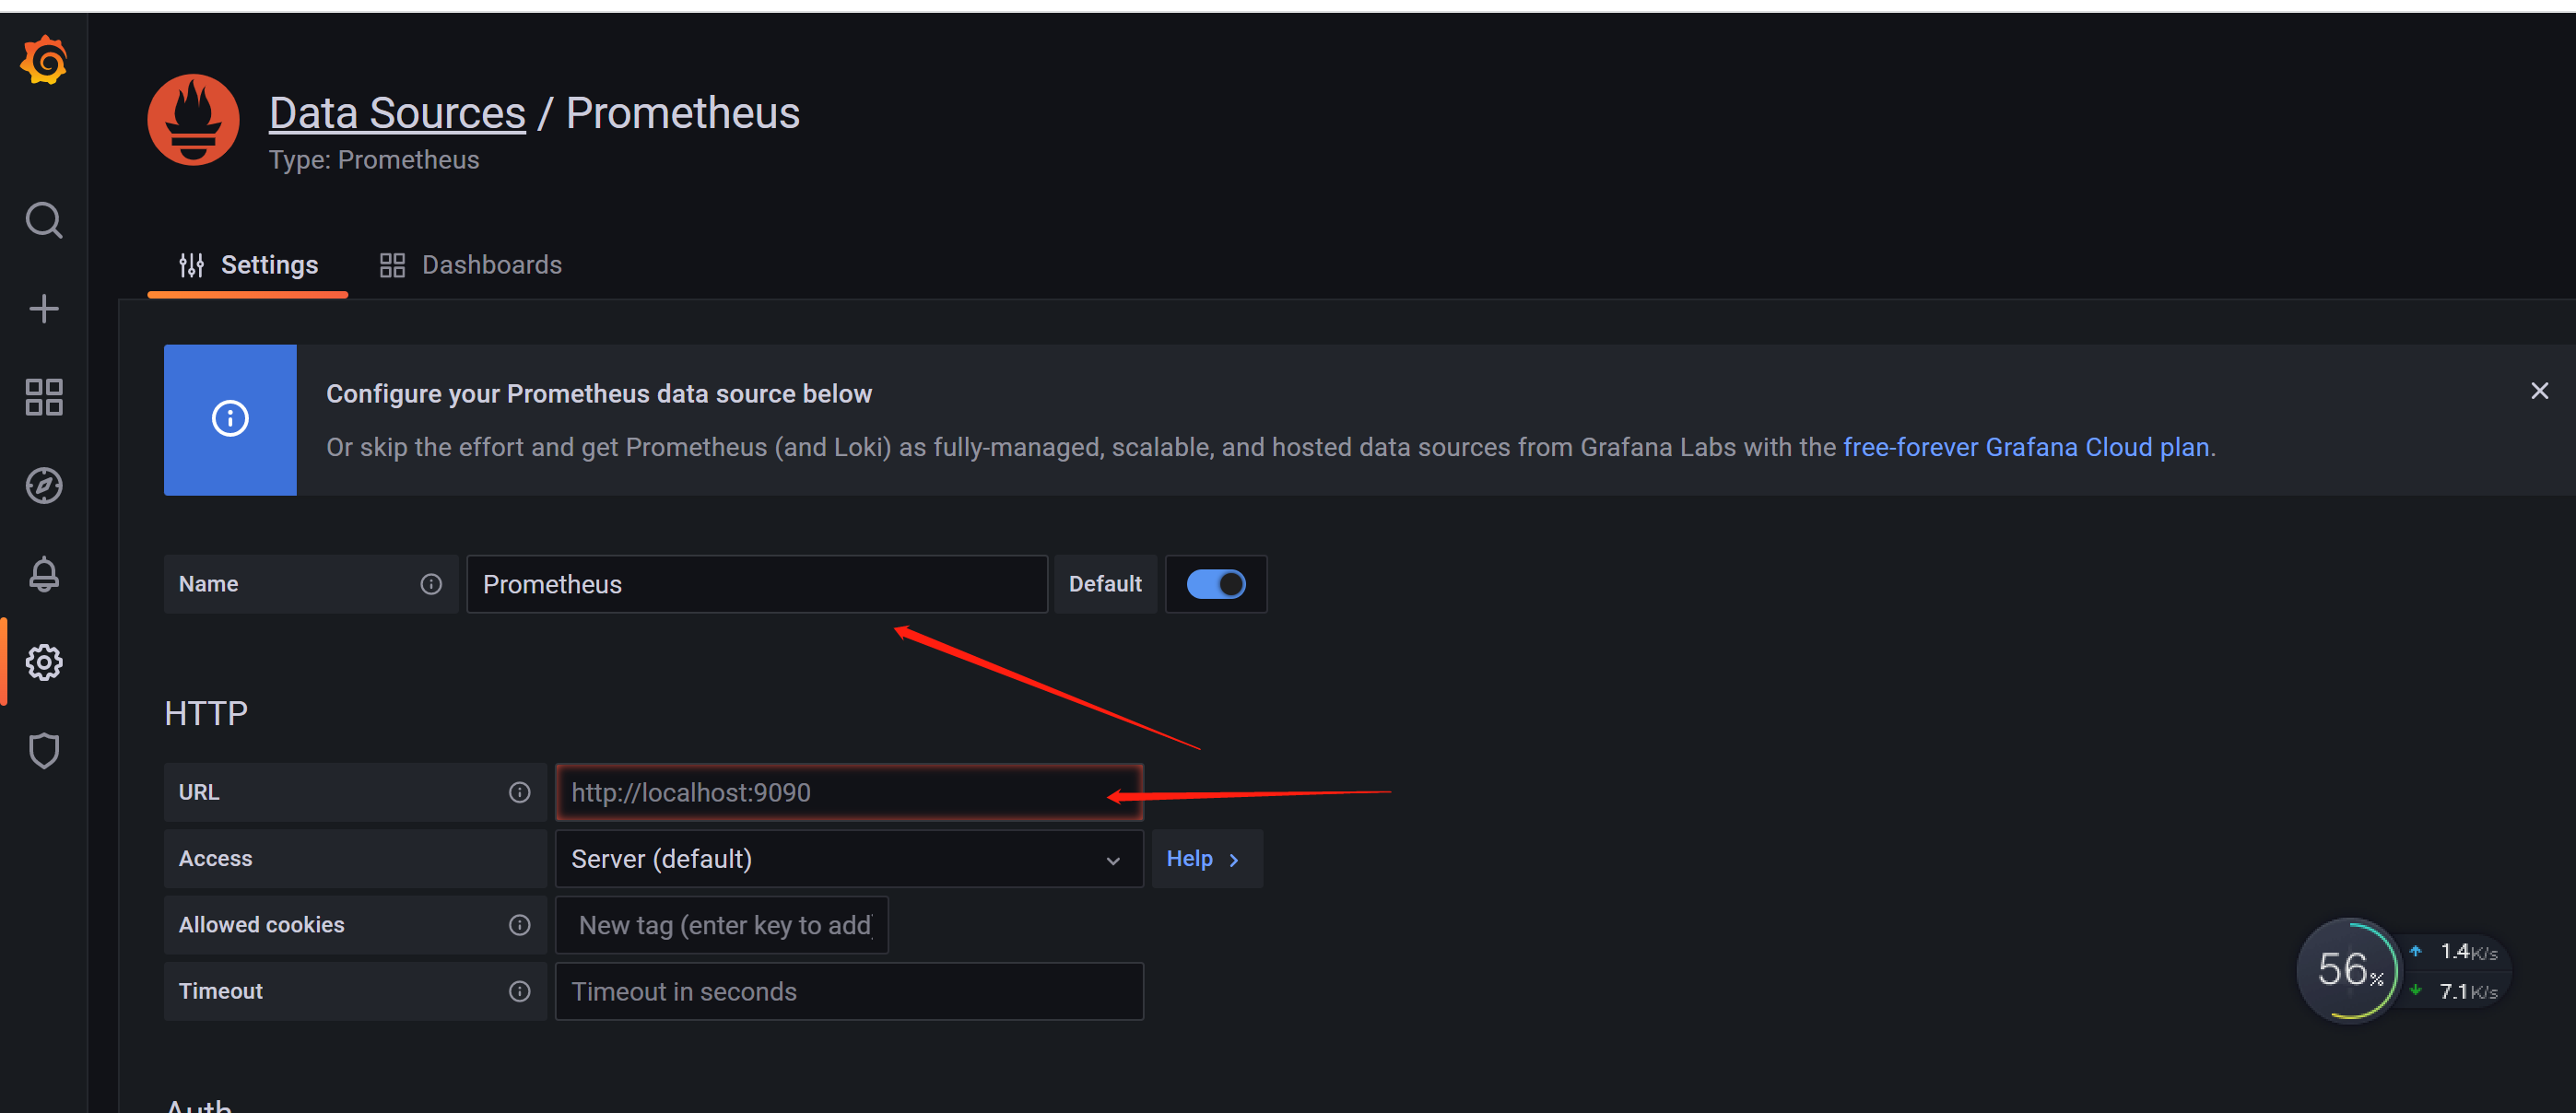
3.3 Grafana配置Prometheus数据源
(1)Date Sources--> 选择 Prometheus,配置 Name 和 URL,注意:Name必须为首字母大写Prometheus,不能全写成小写的prometheus。因为Prometheus和Grafana都是docker安装,所以url需要写外网地址。


(2)新建 Dashboard
Create Dashboard

配置title、description

配置Data Source

选择指标


保存

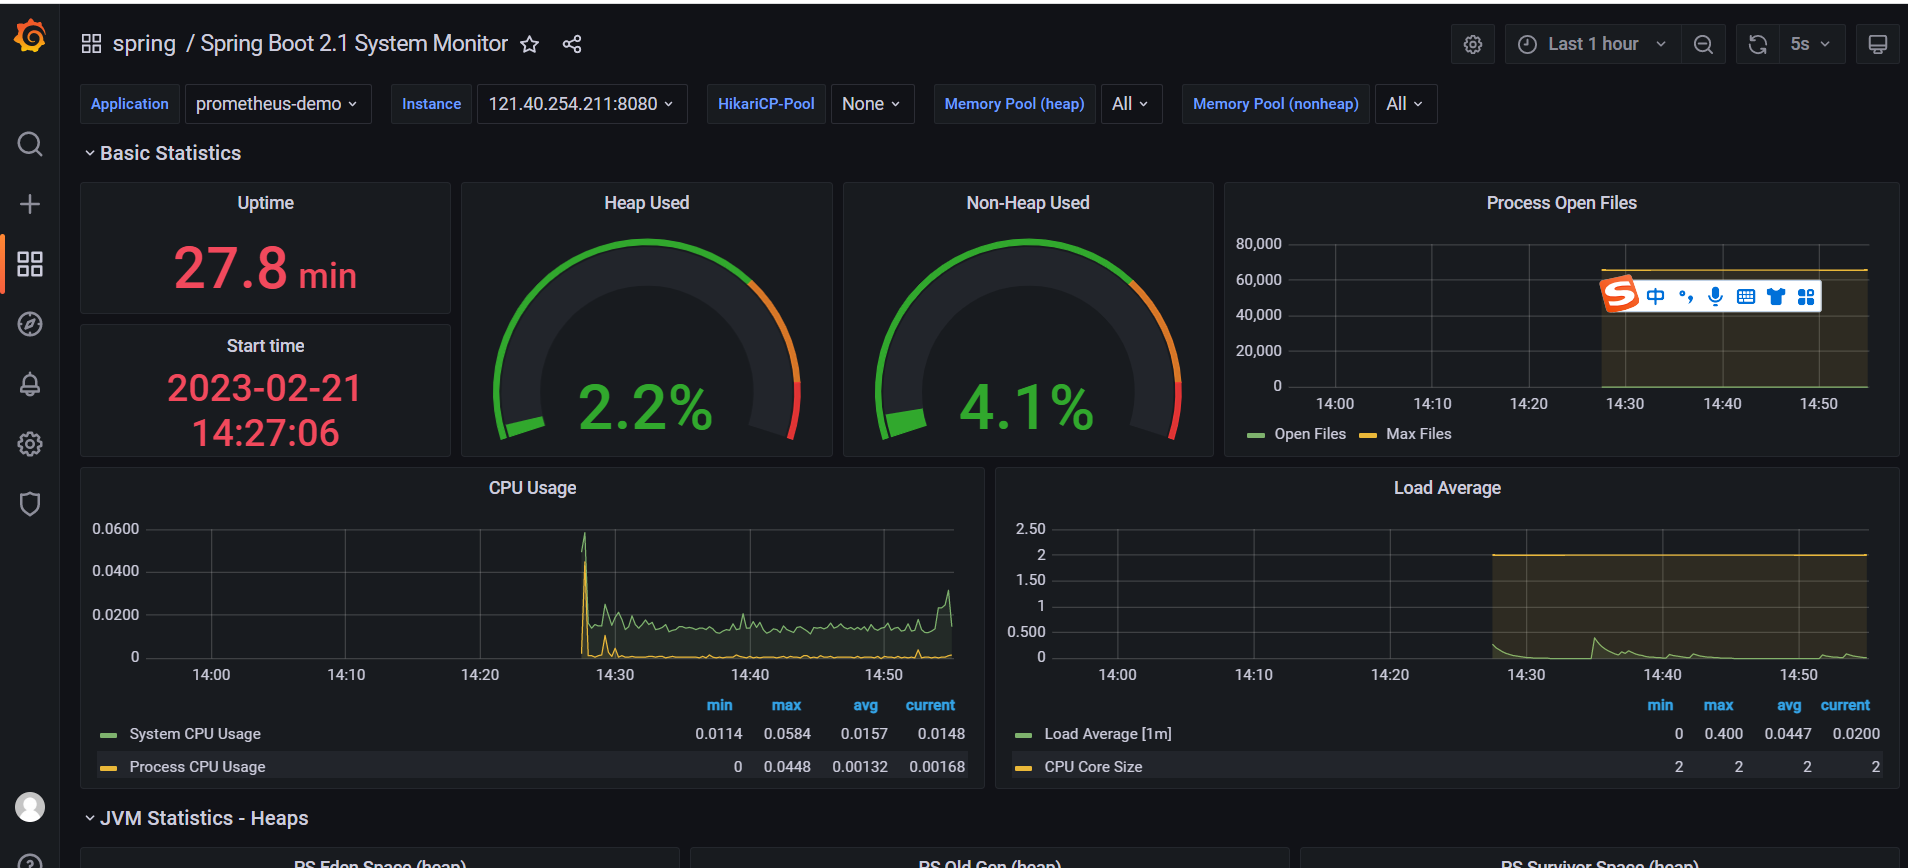
3.4 模板套用
Grafana提供了许多优秀的模板,可以网页https://grafana.com/grafana/dashboards 查找。

导入模板id


复制模板id


导入

导入后,可以看到监控效果了