问题
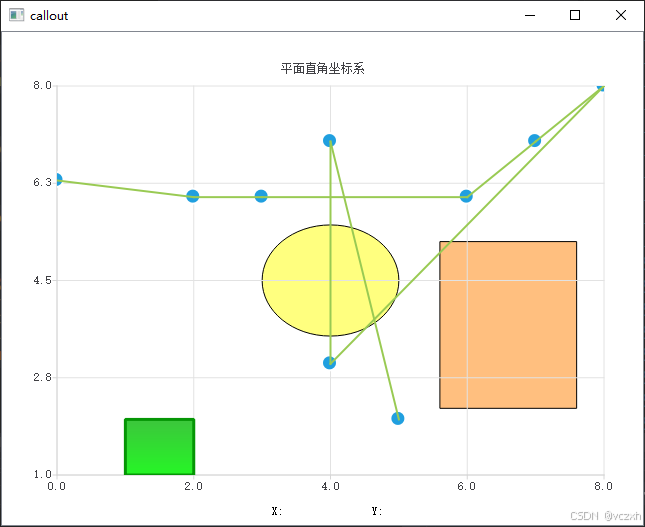
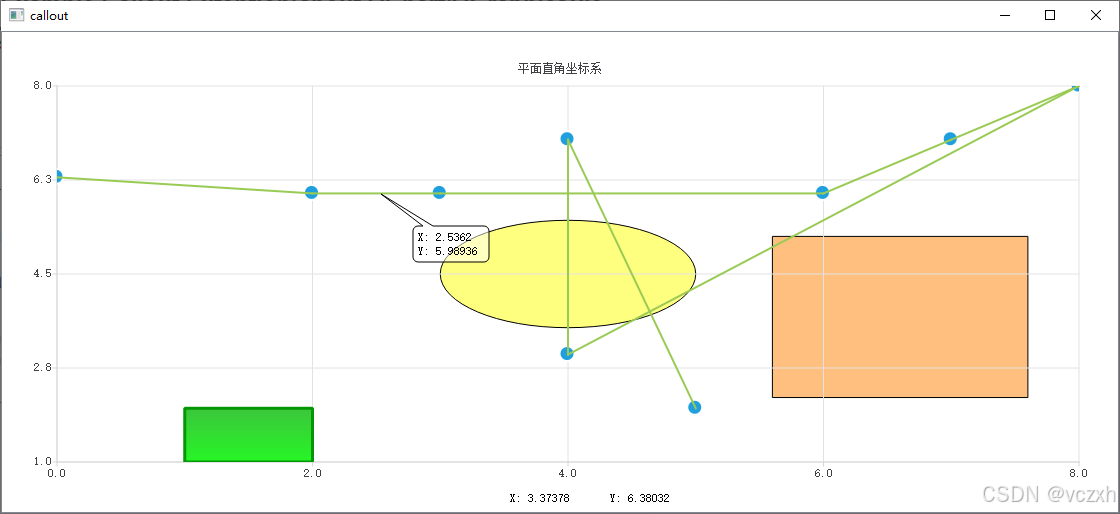
Qt Example callout 展示了在平面直角坐标系中画tips。知识点涉及到QChart/QGraphicsView/QGraphicsItem。如何在平面直角坐标系中画点、折线、圆、长方形?
Example路径
D:\Qt\5.15.2\Src\qtcharts\examples\charts\callout\callout.cpp
代码
main
#include <QtWidgets/QApplication>
#include "view.h"

int main(int argc, char *argv[])
{
    QApplication a(argc, argv);
    View w;
    w.show();

    return a.exec();
}
View
#ifndef VIEW_H
#define VIEW_H
#include <QtWidgets/QGraphicsView>
#include <QtCharts/QChartGlobal>

QT_BEGIN_NAMESPACE
class QGraphicsScene;
class QMouseEvent;
class QResizeEvent;
QT_END_NAMESPACE

QT_CHARTS_BEGIN_NAMESPACE
class QChart;
QT_CHARTS_END_NAMESPACE

class Callout;

QT_CHARTS_USE_NAMESPACE
class CircleItem;
class RectItem;
class View: public QGraphicsView
{
    Q_OBJECT

public:
    View(QWidget *parent = 0);
    void DelCallout(Callout* pCallout);
protected:
    void resizeEvent(QResizeEvent *event);
    void mouseMoveEvent(QMouseEvent *event);

public slots:
    void keepCallout();
    void tooltip(QPointF point, bool state);

private:
    QGraphicsSimpleTextItem *m_coordX;
    QGraphicsSimpleTextItem *m_coordY;
    QChart *m_chart;
    Callout *m_tooltip;
    QList<Callout*> m_lCallout;
    QList<CircleItem*>m_lCircle;
    QList<RectItem*>m_lRect;
};

#endif
#include "view.h"
#include <QtGui/QResizeEvent>
#include <QtWidgets/QGraphicsScene>
#include <QtCharts/QChart>
#include <QtCharts/QLineSeries>
#include <QtCharts/QSplineSeries>
#include <QtWidgets/QGraphicsTextItem>
#include "callout.h"
#include <QtGui/QMouseEvent>
#include <QValueAxis>
#include <QScatterSeries>
#include <QAreaSeries>
#include <QSplineSeries>
#include "CircleItem.h"
#include "RectItem.h"
View::View(QWidget *parent)
    : QGraphicsView(new QGraphicsScene, parent),
      m_coordX(0),
      m_coordY(0),
      m_chart(0),
      m_tooltip(0)
{
    setDragMode(QGraphicsView::NoDrag);
    setVerticalScrollBarPolicy(Qt::ScrollBarAlwaysOff);
    setHorizontalScrollBarPolicy(Qt::ScrollBarAlwaysOff);

    // chart
    m_chart = new QChart;
    m_chart->setMinimumSize(640, 480);
    m_chart->setTitle(QStringLiteral("平面直角坐标系"));
    m_chart->legend()->hide();
    //点的数据源
    QList<QPointF> lptSource;
    lptSource << QPointF(0, 6.3) << QPointF(2, 6) << QPointF(3, 6) << QPointF(6, 6) << QPointF(7, 7) << QPointF(8, 8)
        << QPointF(4, 3) << QPointF(4, 7) << QPointF(5, 2);
    //点用折线连起来
    QLineSeries* line = new QLineSeries();
    line->append(lptSource);
    //点用曲线连起来
    QSplineSeries* spline = new QSplineSeries();
    spline->append(lptSource);
    //点用圆圈表示
    QScatterSeries* scatter = new QScatterSeries();
    scatter->append(lptSource);
    //区域
    QLineSeries* line1 = new QLineSeries();
    QLineSeries* line2 = new QLineSeries();
    line1->append(1, 1);
    line1->append(1, 2);
    line2->append(2, 1);
    line2->append(2, 2);
    QAreaSeries* area = new QAreaSeries(line1, line2);
    area->setName("Batman");
    QPen pen(0x059605);
    pen.setWidth(3);
    area->setPen(pen);
    QLinearGradient gradient(QPointF(0, 0), QPointF(0, 1));
    gradient.setColorAt(0.0, 0x3cc63c);
    gradient.setColorAt(1.0, 0x26f626);
    gradient.setCoordinateMode(QGradient::ObjectBoundingMode);
    area->setBrush(gradient);

    m_chart->addSeries(scatter);
    m_chart->addSeries(line);
    //m_chart->addSeries(spline);
    m_chart->addSeries(area);

    m_chart->createDefaultAxes();
    m_chart->setAcceptHoverEvents(true);

    setRenderHint(QPainter::Antialiasing);
    scene()->addItem(m_chart);

    m_coordX = new QGraphicsSimpleTextItem(m_chart);
    m_coordX->setPos(m_chart->size().width()/2 - 50, m_chart->size().height());
    m_coordX->setText("X: ");
    m_coordY = new QGraphicsSimpleTextItem(m_chart);
    m_coordY->setPos(m_chart->size().width()/2 + 50, m_chart->size().height());
    m_coordY->setText("Y: ");

    connect(line, &QLineSeries::clicked, this, &View::keepCallout);
    connect(line, &QLineSeries::hovered, this, &View::tooltip);
    connect(spline, &QSplineSeries::clicked, this, &View::keepCallout);
    connect(spline, &QSplineSeries::hovered, this, &View::tooltip);
    connect(area, &QAreaSeries::clicked, this, &View::keepCallout);
    connect(area, &QAreaSeries::hovered, this, &View::tooltip);

    this->setMouseTracking(true);
    CircleItem* pCircle = new CircleItem(m_chart, this);
    pCircle->SetCenterR(QPointF(4,4.5),1);
    m_lCircle.push_back(pCircle);


    RectItem* pRect = new RectItem(m_chart, this);
    pRect->SetRect(QRectF(QPointF(5.6,2.2),QSizeF(2,3)));
    m_lRect.push_back(pRect);
}

void View::DelCallout(Callout* pCallout)
{
    m_lCallout.removeOne(pCallout);
    delete pCallout;
}

void View::resizeEvent(QResizeEvent *event)
{
    if (scene()) {
        scene()->setSceneRect(QRect(QPoint(0, 0), event->size()));
         m_chart->resize(event->size());
         m_coordX->setPos(m_chart->size().width()/2 - 50, m_chart->size().height() - 20);
         m_coordY->setPos(m_chart->size().width()/2 + 50, m_chart->size().height() - 20);
         const auto callouts = m_lCallout;
         for (Callout *callout : callouts)
             callout->updateGeometry();
         for (CircleItem* pCircle : m_lCircle)
             pCircle->updateGeometry();
         for (RectItem* pRect : m_lRect)
             pRect->updateGeometry();
    }
    QGraphicsView::resizeEvent(event);
}

void View::mouseMoveEvent(QMouseEvent *event)
{
    m_coordX->setText(QString("X: %1").arg(m_chart->mapToValue(event->pos()).x()));
    m_coordY->setText(QString("Y: %1").arg(m_chart->mapToValue(event->pos()).y()));
    QGraphicsView::mouseMoveEvent(event);
}

void View::keepCallout()
{
    m_lCallout.append(m_tooltip);
    m_tooltip = new Callout(m_chart, this);
}

void View::tooltip(QPointF point, bool state)
{
    if (m_tooltip == 0)
        m_tooltip = new Callout(m_chart, this);

    if (state) {
        m_tooltip->setText(QString("X: %1 \nY: %2 ").arg(point.x()).arg(point.y()));
        m_tooltip->setAnchor(point);
        m_tooltip->setZValue(11);
        m_tooltip->updateGeometry();
        m_tooltip->show();
    } else {
        m_tooltip->hide();
    }
}
callout
#ifndef CALLOUT_H
#define CALLOUT_H

#include <QtCharts/QChartGlobal>
#include <QtWidgets/QGraphicsItem>
#include <QtGui/QFont>


QT_BEGIN_NAMESPACE
class QGraphicsSceneMouseEvent;
QT_END_NAMESPACE

QT_CHARTS_BEGIN_NAMESPACE
class QChart;
QT_CHARTS_END_NAMESPACE

QT_CHARTS_USE_NAMESPACE
class View;
class Callout : public QGraphicsItem
{
public:
    Callout(QChart *parent, View* pView);

    void setText(const QString &text);
    void setAnchor(QPointF point);
    void updateGeometry();

    QRectF boundingRect() const;
    void paint(QPainter *painter, const QStyleOptionGraphicsItem *option,QWidget *widget);

protected:
    void mousePressEvent(QGraphicsSceneMouseEvent *event);
    void mouseMoveEvent(QGraphicsSceneMouseEvent *event);
    void mouseDoubleClickEvent(QGraphicsSceneMouseEvent* event);
private:
    QString m_text;
    QRectF m_textRect;
    QRectF m_rect;
    QPointF m_anchor;
    QFont m_font;
    QChart *m_chart;
    View* m_view;
};

#endif // CALLOUT_H
#include "callout.h"
#include <QtGui/QPainter>
#include <QtGui/QFontMetrics>
#include <QtWidgets/QGraphicsSceneMouseEvent>
#include <QtGui/QMouseEvent>
#include <QtCharts/QChart>
#include <QDebug>
#include <view.h>
Callout::Callout(QChart *chart, View* pView):
    QGraphicsItem(chart),
    m_chart(chart),m_view(pView)
{
}

QRectF Callout::boundingRect() const
{
    QPointF anchor = mapFromParent(m_chart->mapToPosition(m_anchor));
    QRectF rect;
    rect.setLeft(qMin(m_rect.left(), anchor.x()));
    rect.setRight(qMax(m_rect.right(), anchor.x()));
    rect.setTop(qMin(m_rect.top(), anchor.y()));
    rect.setBottom(qMax(m_rect.bottom(), anchor.y()));


    return rect;
}

void Callout::paint(QPainter *painter, const QStyleOptionGraphicsItem *option, QWidget *widget)
{
    Q_UNUSED(option)
    Q_UNUSED(widget)
    QPainterPath path;
    path.addRoundedRect(m_rect, 5, 5);
    QPointF anchor = mapFromParent(m_chart->mapToPosition(m_anchor));
    if (!m_rect.isNull() && !m_rect.contains(anchor)) {
        QPointF point1, point2;

        // establish the position of the anchor point in relation to m_rect
        bool above = anchor.y() <= m_rect.top();
        bool aboveCenter = anchor.y() > m_rect.top() && anchor.y() <= m_rect.center().y();
        bool belowCenter = anchor.y() > m_rect.center().y() && anchor.y() <= m_rect.bottom();
        bool below = anchor.y() > m_rect.bottom();

        bool onLeft = anchor.x() <= m_rect.left();
        bool leftOfCenter = anchor.x() > m_rect.left() && anchor.x() <= m_rect.center().x();
        bool rightOfCenter = anchor.x() > m_rect.center().x() && anchor.x() <= m_rect.right();
        bool onRight = anchor.x() > m_rect.right();

        // get the nearest m_rect corner.
        qreal x = (onRight + rightOfCenter) * m_rect.width();
        qreal y = (below + belowCenter) * m_rect.height();
        bool cornerCase = (above && onLeft) || (above && onRight) || (below && onLeft) || (below && onRight);
        bool vertical = qAbs(anchor.x() - x) > qAbs(anchor.y() - y);

        qreal x1 = x + leftOfCenter * 10 - rightOfCenter * 20 + cornerCase * !vertical * (onLeft * 10 - onRight * 20);
        qreal y1 = y + aboveCenter * 10 - belowCenter * 20 + cornerCase * vertical * (above * 10 - below * 20);;
        point1.setX(x1);
        point1.setY(y1);

        qreal x2 = x + leftOfCenter * 20 - rightOfCenter * 10 + cornerCase * !vertical * (onLeft * 20 - onRight * 10);;
        qreal y2 = y + aboveCenter * 20 - belowCenter * 10 + cornerCase * vertical * (above * 20 - below * 10);;
        point2.setX(x2);
        point2.setY(y2);

        path.moveTo(point1);
        path.lineTo(anchor);
        path.lineTo(point2);
        path = path.simplified();
        qDebug() << point1 << "," << anchor << "," << point2 << "," << path<<"\n\n\n\n";
    }
    painter->setBrush(QColor(255, 255, 255,128));
    painter->drawPath(path);
    painter->drawText(m_textRect, m_text);
}

void Callout::mousePressEvent(QGraphicsSceneMouseEvent *event)
{
    QPointF pt = event->pos();
    QRectF rc = mapToParent(m_rect).boundingRect();
    if (m_rect.contains(pt))
    {
        event->setAccepted(true);
    }
    else
        event->setAccepted(false);
}

void Callout::mouseMoveEvent(QGraphicsSceneMouseEvent *event)
{
    if (event->buttons() & Qt::LeftButton){
        setPos(mapToParent(event->pos() - event->buttonDownPos(Qt::LeftButton)));
        event->setAccepted(true);
    } else {
        event->setAccepted(false);
    }
}

void Callout::mouseDoubleClickEvent(QGraphicsSceneMouseEvent* event)
{
    m_view->DelCallout(this);
}

void Callout::setText(const QString &text)
{
    m_text = text;
    QFontMetrics metrics(m_font);
    m_textRect = metrics.boundingRect(QRect(0, 0, 150, 150), Qt::AlignLeft, m_text);
    m_textRect.translate(5, 5);
    prepareGeometryChange();
    m_rect = m_textRect.adjusted(-5, -5, 5, 5);
}

void Callout::setAnchor(QPointF point)
{
    m_anchor = point;
}

void Callout::updateGeometry()
{
    prepareGeometryChange();
    setPos(m_chart->mapToPosition(m_anchor) + QPoint(10, -50));
}
CircleItem
#pragma once
#include <QtCharts/QChartGlobal>
#include <QtWidgets/QGraphicsItem>
QT_BEGIN_NAMESPACE
class QGraphicsSceneMouseEvent;
QT_END_NAMESPACE

QT_CHARTS_BEGIN_NAMESPACE
class QChart;
QT_CHARTS_END_NAMESPACE

QT_CHARTS_USE_NAMESPACE
class View;
class CircleItem :
    public QGraphicsItem
{
public:
    CircleItem(QChart* parent, View* pView);
    void SetCenterR(QPointF pt,double r);//pt为在坐标系上点的坐标,r为在坐标系上的半径长度
    void paint(QPainter* painter, const QStyleOptionGraphicsItem* option, QWidget* widget);
    void updateGeometry();
    QRectF boundingRect() const;
private:
    QPointF m_pt,m_ptDraw;
    double m_r,m_rDrawW,m_rDrawH;
    QChart* m_chart;
    View* m_view;
};
#include "CircleItem.h"
#include "View.h"
#include <QChart>
CircleItem::CircleItem(QChart* parent, View* pView):QGraphicsItem(parent),
    m_chart(parent),m_view(pView)
{

}

void CircleItem::SetCenterR(QPointF pt, double r)
{
    m_pt = pt;
    m_r = r;
    m_ptDraw = mapFromParent(m_chart->mapToPosition(m_pt));
    QPointF ptTemp0 = mapFromParent(m_chart->mapToPosition(QPointF(0, 0)));
    QPointF ptTempW = mapFromParent(m_chart->mapToPosition(QPointF(m_r, 0)));
    QPointF ptTempH = mapFromParent(m_chart->mapToPosition(QPointF(0, m_r)));
    m_rDrawW = abs(ptTempW.x() - ptTemp0.x());
    m_rDrawH = abs(ptTempH.y() - ptTemp0.y());
}

void CircleItem::paint(QPainter* painter, const QStyleOptionGraphicsItem* option, QWidget* widget)
{
    QPainterPath path;
    QPointF pt = mapFromParent(m_chart->mapToPosition(m_pt));
    path.addEllipse(pt,m_rDrawW,m_rDrawH);
    painter->setBrush(QColor(255, 255, 0, 128));
    painter->drawPath(path);
}

void CircleItem::updateGeometry()
{
    prepareGeometryChange();
    m_ptDraw = mapFromParent(m_chart->mapToPosition(m_pt));
    QPointF ptTemp0 = mapFromParent(m_chart->mapToPosition(QPointF(0, 0)));
    QPointF ptTempW = mapFromParent(m_chart->mapToPosition(QPointF(m_r, 0)));
    QPointF ptTempH = mapFromParent(m_chart->mapToPosition(QPointF(0, m_r)));
    m_rDrawW = abs(ptTempW.x() - ptTemp0.x());
    m_rDrawH = abs(ptTempH.y() - ptTemp0.y());
    setPos(m_ptDraw+QPointF(-m_rDrawW, -m_rDrawH));
}

QRectF CircleItem::boundingRect() const
{
    QPointF pt = mapFromParent(m_chart->mapToPosition(m_pt));
    QRectF rect;
    rect.setLeft(pt.x() - m_rDrawW);
    rect.setRight(pt.x() + m_rDrawW);
    rect.setTop(pt.y() - m_rDrawH);
    rect.setBottom(pt.y() + m_rDrawH);
    return rect;
}
RectItem
#pragma once
#include <QtCharts/QChartGlobal>
#include <QtWidgets/QGraphicsItem>
QT_BEGIN_NAMESPACE
class QGraphicsSceneMouseEvent;
QT_END_NAMESPACE

QT_CHARTS_BEGIN_NAMESPACE
class QChart;
QT_CHARTS_END_NAMESPACE

QT_CHARTS_USE_NAMESPACE
class View;
class RectItem : public QGraphicsItem
{
public:
    RectItem(QChart* parent, View* pView);
    void SetRect(QRectF rc);
    void paint(QPainter* painter, const QStyleOptionGraphicsItem* option, QWidget* widget);
    void updateGeometry();
    QRectF boundingRect() const;
private:
    QRectF m_rc,m_rcDraw;
    QChart* m_chart;
    View* m_view;
};
#include "RectItem.h"
#include "View.h"
#include <QChart>
RectItem::RectItem(QChart* parent, View* pView) :QGraphicsItem(parent),
m_chart(parent), m_view(pView)
{

}

void RectItem::SetRect(QRectF rc)
{
    m_rc = rc;
    m_rcDraw.setTopLeft(mapFromParent(m_chart->mapToPosition(m_rc.topLeft())));
    m_rcDraw.setBottomRight(mapFromParent(m_chart->mapToPosition(m_rc.bottomRight())));
}

void RectItem::paint(QPainter* painter, const QStyleOptionGraphicsItem* option, QWidget* widget)
{
    QPainterPath path;
    m_rcDraw.setTopLeft(mapFromParent(m_chart->mapToPosition(m_rc.topLeft())));
    m_rcDraw.setBottomRight(mapFromParent(m_chart->mapToPosition(m_rc.bottomRight())));
    path.addRect(m_rcDraw);
    painter->setBrush(QColor(255, 128, 0, 128));
    painter->drawPath(path);
}

void RectItem::updateGeometry()
{
    prepareGeometryChange();
    m_rcDraw.setTopLeft(mapFromParent(m_chart->mapToPosition(m_rc.topLeft())));
    m_rcDraw.setBottomRight(mapFromParent(m_chart->mapToPosition(m_rc.bottomRight())));
    setPos(m_rcDraw.topLeft());
}

QRectF RectItem::boundingRect() const
{
    QPointF ptTopLeft = mapFromParent(m_chart->mapToPosition(m_rc.topLeft()));
    QPointF ptBottomRight = mapFromParent(m_chart->mapToPosition(m_rc.bottomRight()));
    return QRectF(ptTopLeft,ptBottomRight);
}
运行效果