快速使用OpenVINO的 Anomalib实现训练和推理
import os
from pathlib import Path
from anomalib. data import MVTec
from anomalib import TaskType
from anomalib. deploy import ExportType, OpenVINOInferencer
from anomalib. engine import Engine
from anomalib. models import Padim, Patchcore, Stfpm
from matplotlib import pyplot as plt
from anomalib. data. utils import read_image
import time
def train_and_export_model ( object_type, model, transform= None ) :
"""
训练并导出MVTec数据集上的模型为OpenVINO格式。
Args:
object_type (str): MVTec数据集的类别,如'bottle'、'cap'等。
model (torch.nn.Module): 待训练的深度学习模型。
transform (Callable, optional): 数据预处理函数,默认为None。
Returns:
str: 导出模型保存的根目录路径。
"""
datamodule = MVTec( )
datamodule. category= object_type
engine = Engine( task= TASK)
engine. fit( model= model, datamodule= datamodule)
engine. export(
model= model,
export_type= ExportType. OPENVINO,
)
print ( f"Model save to { engine. trainer. default_root_dir} )." )
return engine. trainer. default_root_dir
if __name__ == '__main__' :
OBJECT = "transistor"
TASK = TaskType. SEGMENTATION
output_path= Path( "results/Padim/MVTec/transistor/latest" )
openvino_model_path = output_path / "weights" / "openvino" / "model.bin"
metadata_path = output_path / "weights" / "openvino" / "metadata.json"
print ( openvino_model_path. exists( ) , metadata_path. exists( ) )
inferencer = OpenVINOInferencer(
path= openvino_model_path,
metadata= metadata_path,
device= "AUTO" ,
)
folder_path = "./datasets/MVTec/transistor/test/bent_lead/"
png_files = [ f for f in os. listdir( folder_path) if f. endswith( '.png' ) ]
for file_name in png_files:
image = read_image( path= folder_path + '/' + file_name)
start_time = time. time( )
predictions = inferencer. predict( image= image)
end_time = time. time( )
elapsed_time = end_time - start_time
print ( f"Prediction took { elapsed_time: .4f } seconds." )
print ( predictions. pred_score, predictions. pred_label)
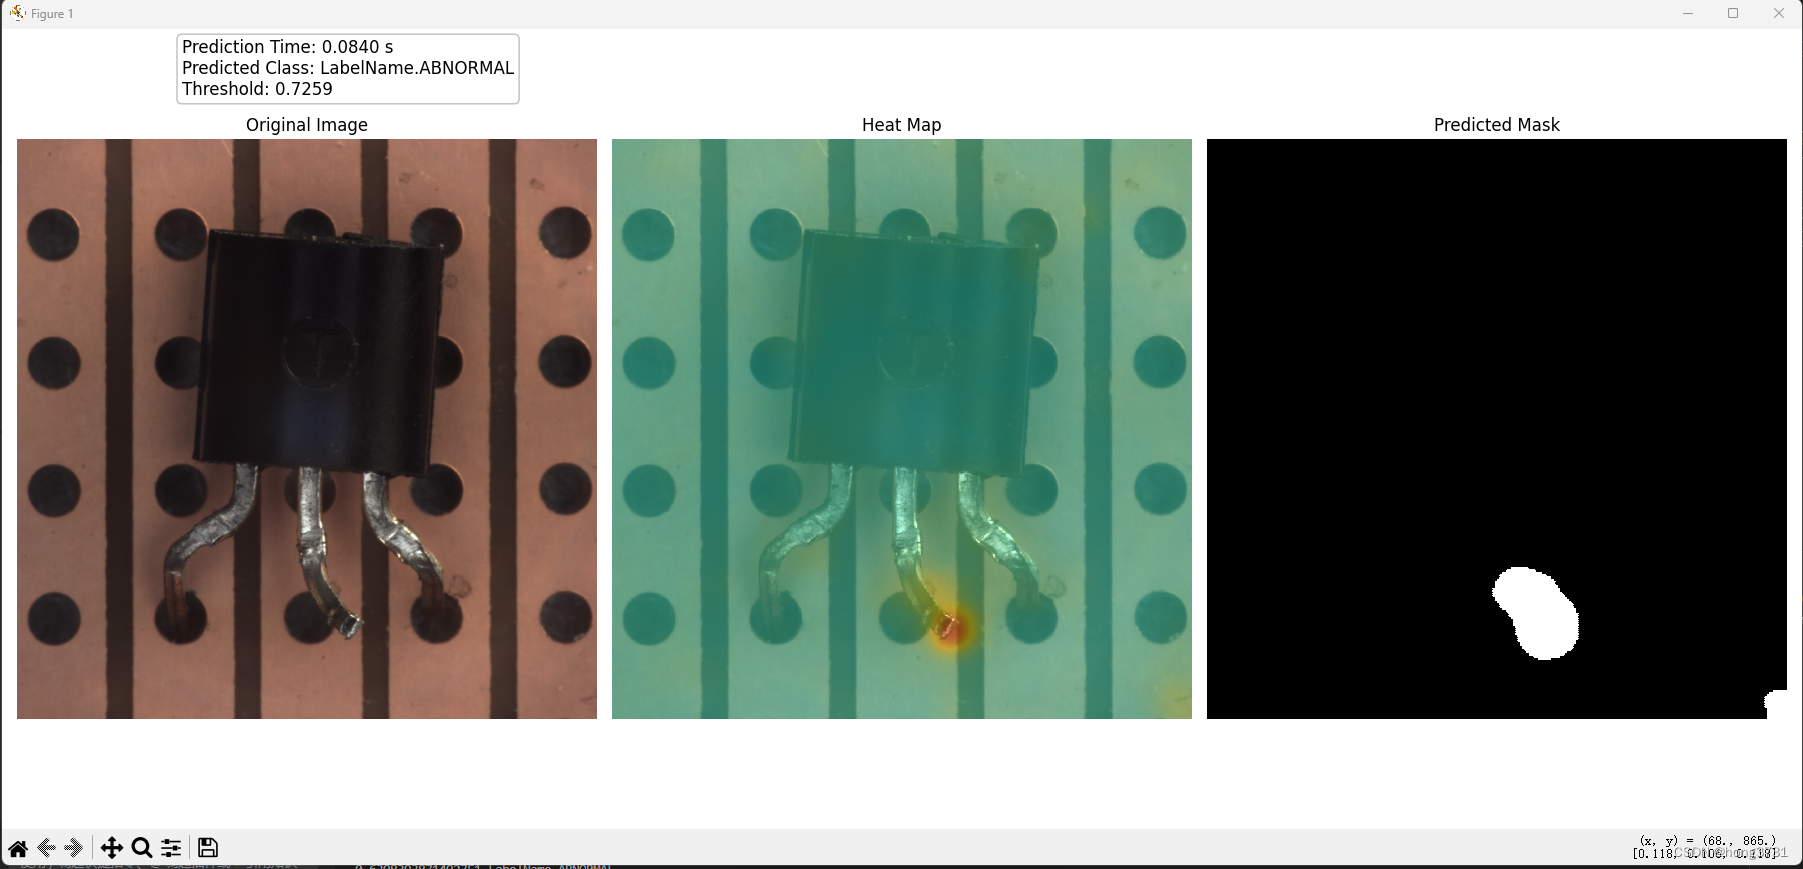
fig, axs = plt. subplots( 1 , 3 , figsize= ( 18 , 8 ) )
axs[ 0 ] . imshow( image)
axs[ 0 ] . set_title( 'Original Image' )
axs[ 0 ] . axis( 'off' )
axs[ 1 ] . imshow( predictions. heat_map, cmap= 'hot' , interpolation= 'nearest' )
axs[ 1 ] . set_title( 'Heat Map' )
axs[ 1 ] . axis( 'off' )
axs[ 2 ] . imshow( predictions. pred_mask, cmap= 'gray' , interpolation= 'nearest' )
axs[ 2 ] . set_title( 'Predicted Mask' )
axs[ 2 ] . axis( 'off' )
fig_text_x = 0.1
fig_text_y = 0.95
fig. text( fig_text_x, fig_text_y,
f'Prediction Time: { elapsed_time: .4f } s\n' f'Predicted Class: { predictions. pred_label} \n' f'Threshold: { predictions. pred_score: .4f } ' if hasattr ( predictions, 'pred_score' ) else '' ,
ha= 'left' , va= 'center' , fontsize= 12 ,
bbox= dict ( boxstyle= "round" , fc= "w" , ec= "0.5" , alpha= 0.5 ) )
plt. tight_layout( )
plt. show( )
print ( "Done" )
