<!DOCTYPE html>
<html lang="en">
<head>
    <meta charset="UTF-8">
    <meta name="viewport" content="width=device-width, initial-scale=1.0">
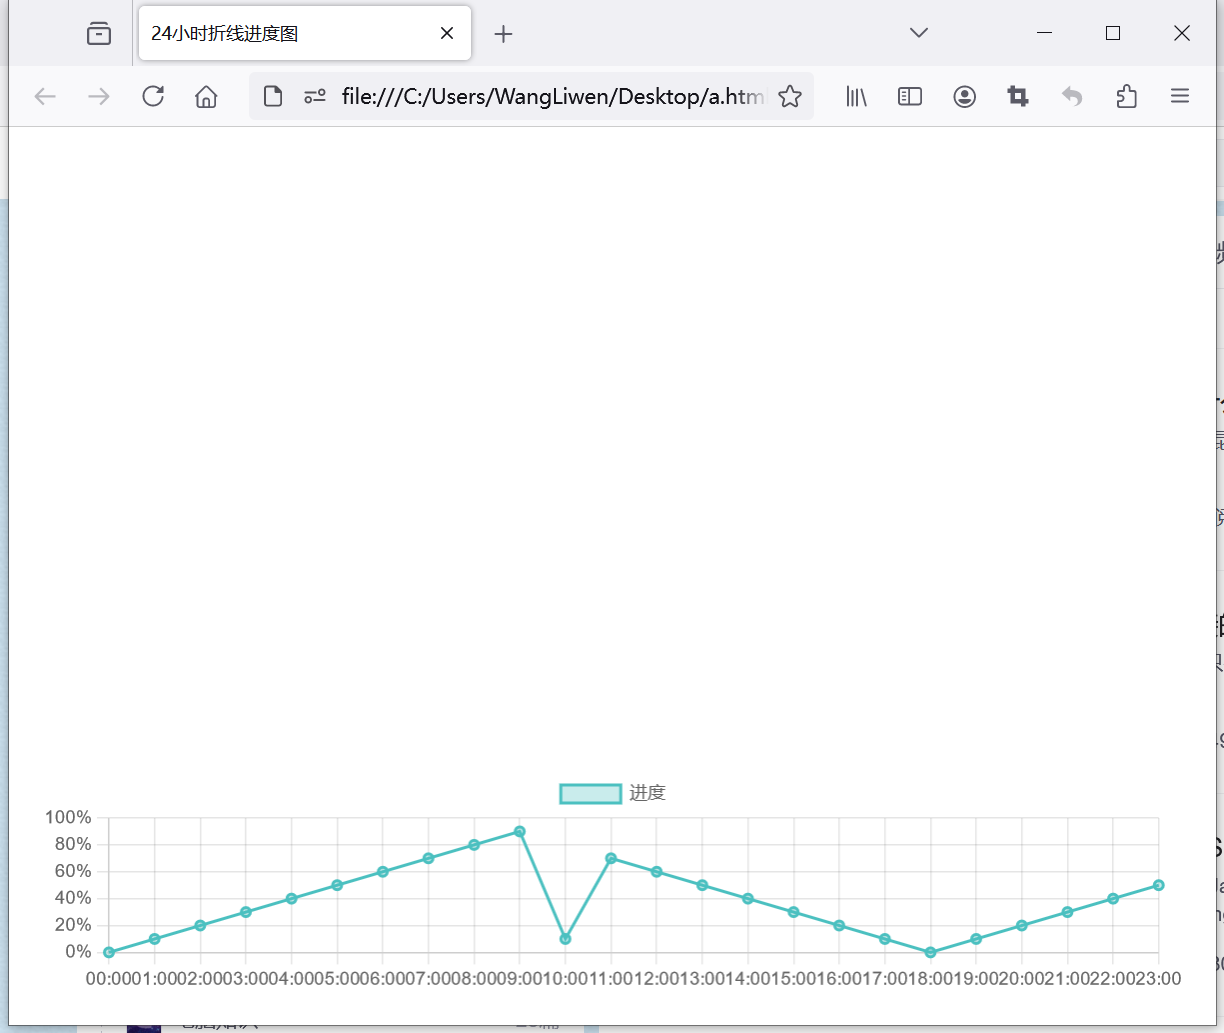
    <title>24小时折线进度图</title>
    <style>
        body {
            margin: 0;
            padding: 0;
            font-family: Arial, sans-serif;
        }

        #chart-container {
            position: fixed;
            bottom: 0;
            left: 0;
            right: 0;
            background-color: transparent; /* 设置容器背景透明 */
            display: flex;
            justify-content: center;
            align-items: flex-end;
            padding: 20px;
            box-sizing: border-box;
        }

        canvas {
            background-color: transparent; /* 设置canvas背景透明 */
        }
    </style>
</head>
<body>
    <!-- 页面其他内容 -->

    <!-- 折线进度图容器 -->
    <div id="chart-container">
        <canvas id="myChart"></canvas>
    </div>

    <!-- Chart.js库 -->
    <script src="https://cdn.jsdelivr.net/npm/chart.js"></script>

    <!-- 折线进度图JavaScript代码 -->
    <script>
        window.onload = function() {
            var ctx = document.getElementById('myChart').getContext('2d');
            var myChart = new Chart(ctx, {
                type: 'line',
                data: {
                    labels: ['00:00', '01:00', '02:00', '03:00', '04:00', '05:00', '06:00', '07:00', '08:00', '09:00', '10:00', '11:00', '12:00',
                             '13:00', '14:00', '15:00', '16:00', '17:00', '18:00', '19:00', '20:00', '21:00', '22:00', '23:00'],
                    datasets: [{
                        label: '进度',
                        data: [0, 10, 20, 30, 40, 50, 60, 70, 80, 90, 10, 70, 60, 50, 40, 30, 20, 10, 0, 10, 20, 30, 40, 50], // 示例数据
                        backgroundColor: 'rgba(75, 192, 192, 0.3)', // 半透明背景色
                        borderColor: 'rgba(75, 192, 192, 1)', // 边框颜色
                        borderWidth: 2
                    }]
                },
                options: {
                    responsive: true,
                    maintainAspectRatio: false,
                    scales: {
                        y: {
                            beginAtZero: true,
                            ticks: {
                                callback: function(value) {
                                    return value + '%'; // 自定义y轴刻度标签
                                }
                            }
                        },
                        x: {
                            gridLines: {
                                display: false // 隐藏x轴网格线
                            },
                            ticks: {
                                maxRotation: 0, // 防止标签旋转
                                autoSkip: false // 不自动跳过标签
                            }
                        }
                    },
                    legend: {
                        display: false // 隐藏图例
                    },
                    tooltips: {
                        enabled: false // 禁用提示框
                    }
                }
            });
        };
    </script>
</body>
</html>

