目录
- 子组件
- 父组件使用
- 注意
- option 文件
- 效果展示
- 相关数据处理(代码备份 - 可不看)
- 数据处理后页面展示
子组件
CommonEcharts.vue
<template>
  <div>
    <div v-for="id in domId" :id="id" :key="id" class="echarts" />
  </div>
</template>

<script>
export default {
  name: 'CommonEcharts',
  components: {},

  props: {
    info: {
      type: Object,
      required: true
    },
    domId: {
      type: Array,
      required: true
    },
    optionsObj: {
      type: Object,
      required: true
    }
  },

  data() {
    return {
      EchartsObj: {}
    }
  },

  computed: {},

  watch: {
    info() {
      this.init()
    }
  },

  mounted() {
    window.addEventListener('resize', () => {
      this.domId.forEach((id) => {
        if (document.getElementById(id)) {
          this.EchartsObj[id] = this.$echarts.init(document.getElementById(id))
          this.EchartsObj[id].resize()
        }
      })
    })

    this.init()
  },

  created() {},

  methods: {
    init() {
      this.domId.forEach((id) => {
        if (this.EchartsObj[id]) {
          this.EchartsObj[id].dispose()
        }
        const dom = document.getElementById(id)
        if (!dom) return
        this.EchartsObj[id] = this.$echarts.init(dom)
        this.EchartsObj[id].setOption(this.optionsObj[id])
      })
    }
  }
}
</script>

<style lang='scss' scoped>
.echarts {
  height: 400px;
}
</style>
父组件使用
<template>
  <CommonEcharts :info="info" :dom-id="domId" :options-obj="optionsObj" />
</template>

<script>
import { lineEcharts, scatterEcharts, barEcharts } from './echarts-options'
import CommonEcharts from './CommonEcharts.vue'

export default {
  name: 'JdcTimeEcharts',
  components: {
    CommonEcharts
  },

  props: {
    info: {
      type: Object,
      required: true
    }
  },

  data() {
    return {
      domId: ['JdcTimeEcharts1', 'JdcTimeEcharts2', 'JdcTimeEcharts3']
    }
  },

  computed: {
    optionsObj() {
      return {
        JdcTimeEcharts1: lineEcharts(),
        JdcTimeEcharts2: scatterEcharts(),
        JdcTimeEcharts3: barEcharts()
      }
    }
  }
}
</script>

<style lang='scss' scoped>
</style>
注意
- domId 中数据 要与 optionsObj 中数据一一对应
option 文件
echarts-options.js
import * as Echarts from 'echarts'
// 折线图 - 参考示例 https://www.makeapie.cn/echarts_content/xS9Oh_JY06.html
export function lineEcharts() {
return {
backgroundColor: '#080b30',
title: {
text: '多线图',
textStyle: {
align: 'center',
color: '#fff',
fontSize: 20
},
top: '5%',
left: 'center'
},
tooltip: {
trigger: 'axis',
axisPointer: {
lineStyle: {
color: {
type: 'linear',
x: 0,
y: 0,
x2: 0,
y2: 1,
colorStops: [
{
offset: 0,
color: 'rgba(0, 255, 233,0)'
},
{
offset: 0.5,
color: 'rgba(255, 255, 255,1)'
},
{
offset: 1,
color: 'rgba(0, 255, 233,0)'
}
],
global: false
}
}
}
},
grid: {
top: '15%',
left: '5%',
right: '5%',
bottom: '15%'
// containLabel: true
},
xAxis: [
{
type: 'category',
axisLine: {
show: true
},
splitArea: {
// show: true,
color: '#f00',
lineStyle: {
color: '#f00'
}
},
axisLabel: {
color: '#fff'
},
splitLine: {
show: false
},
boundaryGap: false,
data: ['A', 'B', 'C', 'D', 'E', 'F']
}
],
yAxis: [
{
type: 'value',
min: 0,
// max: 140,
splitNumber: 4,
splitLine: {
show: true,
lineStyle: {
color: 'rgba(255,255,255,0.1)'
}
},
axisLine: {
show: false
},
axisLabel: {
show: false,
margin: 20,
textStyle: {
color: '#d1e6eb'
}
},
axisTick: {
show: false
}
}
],
series: [
{
name: '注册总量',
type: 'line',
smooth: true, // 是否平滑
showAllSymbol: true,
// symbol: 'image://./static/images/guang-circle.png',
symbol: 'circle',
symbolSize: 15,
lineStyle: {
normal: {
color: '#00b3f4',
shadowColor: 'rgba(0, 0, 0, .3)',
shadowBlur: 0,
shadowOffsetY: 5,
shadowOffsetX: 5
}
},
label: {
show: true,
position: 'top',
textStyle: {
color: '#00b3f4'
}
},
itemStyle: {
color: '#00b3f4',
borderColor: '#fff',
borderWidth: 3,
shadowColor: 'rgba(0, 0, 0, .3)',
shadowBlur: 0,
shadowOffsetY: 2,
shadowOffsetX: 2
},
tooltip: {
show: false
},
areaStyle: {
normal: {
color: new Echarts.graphic.LinearGradient(
0,
0,
0,
1,
[
{
offset: 0,
color: 'rgba(0,179,244,0.3)'
},
{
offset: 1,
color: 'rgba(0,179,244,0)'
}
],
false
),
shadowColor: 'rgba(0,179,244, 0.9)',
shadowBlur: 20
}
},
data: [502.84, 205.97, 332.79, 281.55, 398.35, 214.02]
},
{
name: '注册总量',
type: 'line',
smooth: true, //是否平滑
showAllSymbol: true,
// symbol: 'image://./static/images/guang-circle.png',
symbol: 'circle',
symbolSize: 15,
lineStyle: {
normal: {
color: '#00ca95',
shadowColor: 'rgba(0, 0, 0, .3)',
shadowBlur: 0,
shadowOffsetY: 5,
shadowOffsetX: 5
}
},
label: {
show: true,
position: 'top',
textStyle: {
color: '#00ca95'
}
},
itemStyle: {
color: '#00ca95',
borderColor: '#fff',
borderWidth: 3,
shadowColor: 'rgba(0, 0, 0, .3)',
shadowBlur: 0,
shadowOffsetY: 2,
shadowOffsetX: 2
},
tooltip: {
show: false
},
areaStyle: {
normal: {
color: new Echarts.graphic.LinearGradient(
0,
0,
0,
1,
[
{
offset: 0,
color: 'rgba(0,202,149,0.3)'
},
{
offset: 1,
color: 'rgba(0,202,149,0)'
}
],
false
),
shadowColor: 'rgba(0,202,149, 0.9)',
shadowBlur: 20
}
},
data: [281.55, 398.35, 214.02, 179.55, 289.57, 356.14]
}
]
}
}
// 散点图 - 参考示例 https://www.makeapie.cn/echarts_content/xZvv5T7_R6.html
export function scatterEcharts() {
return {
tooltip: {
position: 'top'
},
legend: {
left: 'center'
},
title: [],
xAxis: {
name: '公开年份',
nameLocation: 'center',
nameGap: 30,
type: 'category',
data: ['2012', '2013', '2014', '2015', '2016', '2017', '2018', '2019', '2020', '2021'],
boundaryGap: false,
splitLine: {
show: false
},
axisLine: {
show: false
}
},
yAxis: {
name: 'IPC分类号',
nameLocation: 'center',
nameGap: 50,
type: 'category',
data: ['G06F', 'G06Q', 'G10L', 'G06K', 'H04L', 'G16H', 'G05B', 'G08C', 'H04N', 'H04M'],
axisLabel: {
margin: 20
},
splitLine: {
show: true,
lineStyle: {
type: 'dashed'
}
},
axisLine: {
show: false
}
},
series: [
{
name: 'G06F',
type: 'scatter',
symbolSize: (val) => {
return val[2] % 40
},
data: [
[0, 0, 444],
[1, 0, 699],
[2, 0, 951],
[3, 0, 1126],
[4, 0, 1347],
[5, 0, 1993],
[6, 0, 3096],
[7, 0, 5196],
[8, 0, 1750],
[9, 0, 222]
],
animationDelay: (idx) => {
return idx * 5
}
},
{
name: 'G06Q',
type: 'scatter',
symbolSize: (val) => {
return val[2] % 40
},
data: [
[0, 1, 484],
[1, 1, 239],
[2, 1, 351],
[3, 1, 126],
[4, 1, 347],
[5, 1, 993],
[6, 1, 2096],
[7, 1, 5196],
[8, 1, 1750],
[9, 1, 222]
],
animationDelay: (idx) => {
return idx * 5
}
},
{
name: 'G10L',
type: 'scatter',
symbolSize: (val) => {
return val[2] % 40
},
data: [
[0, 2, 44],
[1, 2, 69],
[2, 2, 1951],
[3, 2, 116],
[4, 2, 147],
[5, 2, 993],
[6, 2, 3096],
[7, 2, 596],
[8, 0, 1750],
[9, 2, 222]
],
animationDelay: (idx) => {
return idx * 5
}
},
{
name: 'G06K',
type: 'scatter',
symbolSize: (val) => {
return val[2] % 40
},
data: [
[0, 3, 1444],
[1, 3, 1699],
[2, 3, 1951],
[3, 3, 1126],
[4, 3, 147],
[5, 3, 1993],
[6, 3, 396],
[7, 3, 5196],
[8, 3, 150],
[9, 3, 2212]
],
animationDelay: (idx) => {
return idx * 5
}
},
{
name: 'H04L',
type: 'scatter',
symbolSize: (val) => {
return val[2] % 40
},
data: [
[0, 4, 444],
[1, 4, 699],
[2, 4, 951],
[3, 4, 1126],
[4, 4, 1347],
[5, 4, 1993],
[6, 4, 3096],
[7, 4, 5196],
[8, 4, 1750],
[9, 4, 222]
],
animationDelay: (idx) => {
return idx * 5
}
},
{
name: 'G16H',
type: 'scatter',
symbolSize: (val) => {
return val[2] % 40
},
data: [
[0, 5, 444],
[1, 5, 699],
[2, 5, 951],
[3, 5, 1126],
[4, 5, 1347],
[5, 5, 1993],
[6, 5, 3096],
[7, 5, 5196],
[8, 5, 1750],
[9, 5, 222]
],
animationDelay: (idx) => {
return idx * 5
}
},
{
name: 'G05B',
type: 'scatter',
symbolSize: (val) => {
return val[2] % 40
},
data: [
[0, 6, 444],
[1, 6, 699],
[2, 6, 951],
[3, 6, 1126],
[4, 6, 1347],
[5, 6, 1993],
[6, 6, 3096],
[7, 6, 5196],
[8, 6, 1750],
[9, 6, 222]
],
animationDelay: (idx) => {
return idx * 5
}
},
{
name: 'G08C',
type: 'scatter',
symbolSize: (val) => {
return val[2] % 40
},
data: [
[0, 7, 444],
[1, 7, 699],
[2, 7, 951],
[3, 7, 1126],
[4, 7, 1347],
[5, 7, 1993],
[6, 7, 3096],
[7, 7, 5196],
[8, 7, 1750],
[9, 7, 222]
],
animationDelay: (idx) => {
return idx * 5
}
},
{
name: 'H04N',
type: 'scatter',
symbolSize: (val) => {
return val[2] % 40
},
data: [
[0, 8, 444],
[1, 8, 699],
[2, 8, 951],
[3, 8, 1126],
[4, 8, 1347],
[5, 8, 1993],
[6, 8, 3096],
[7, 8, 5196],
[8, 8, 1750],
[9, 8, 222]
],
animationDelay: (idx) => {
return idx * 5
}
},
{
name: 'H04M',
type: 'scatter',
symbolSize: (val) => {
return val[2] % 40
},
data: [
[0, 9, 444],
[1, 9, 699],
[2, 9, 951],
[3, 9, 1126],
[4, 9, 1347],
[5, 9, 1993],
[6, 9, 3096],
[7, 9, 5196],
[8, 9, 1750],
[9, 9, 222]
],
animationDelay: (idx) => {
return idx * 5
}
}
]
}
}
// 柱状图 - 参考示例 https://www.makeapie.cn/echarts_content/xQWEnqAtdc.html
export function barEcharts() {
return {
backgroundColor: '#001120',
tooltip: {
trigger: 'axis',
axisPointer: {
// 坐标轴指示器,坐标轴触发有效
type: 'shadow' // 默认为直线,可选为:'line' | 'shadow'
}
},
legend: {
data: ['邮件营销', '联盟广告'],
textStyle: {
color: 'rgba(55,255,249,1)'
}
},
grid: {
left: '3%',
right: '4%',
bottom: '3%',
containLabel: true
},
xAxis: [
{
type: 'category',
data: ['周一', '周二', '周三', '周四', '周五', '周六', '周日'],
splitLine: {
show: false
},
axisLine: {
lineStyle: {
color: 'rgba(55,255,249,1)'
}
},
axisLabel: {
color: 'rgba(55,255,249,1)'
}
}
],
yAxis: [
{
type: 'value',
splitLine: {
show: false
},
axisLine: {
lineStyle: {
color: 'rgba(55,255,249,1)'
}
}
}
],
series: [
{
name: '邮件营销',
type: 'bar',
barWidth: 20,
itemStyle: {
barBorderRadius: 20,
color: new Echarts.graphic.LinearGradient(0, 0, 0, 1, [
{
offset: 0,
color: 'rgba(55,255,249,1)'
},
{
offset: 1,
color: 'rgba(0,222,215,0.2)'
}
])
},
data: [120, 132, 101, 134, 90, 230, 210]
},
{
// 替代柱状图 默认不显示颜色,是最下方柱图(邮件营销)的value值 - 20
type: 'bar',
barWidth: 20,
barGap: '-100%',
stack: '广告',
itemStyle: {
color: 'transparent'
},
data: [100, 102, 81, 114, 70, 210, 190]
},
{
name: '联盟广告',
type: 'bar',
barWidth: 20,
barGap: '-100%',
stack: '广告',
itemStyle: {
barBorderRadius: 20,
color: new Echarts.graphic.LinearGradient(0, 0, 0, 1, [
{
offset: 0.4,
color: 'rgba(255,252,0,1)'
},
{
offset: 1,
color: 'rgba(8,228,222,0.2)'
}
])
},
data: [220, 182, 191, 234, 290, 330, 310]
}
]
}
}
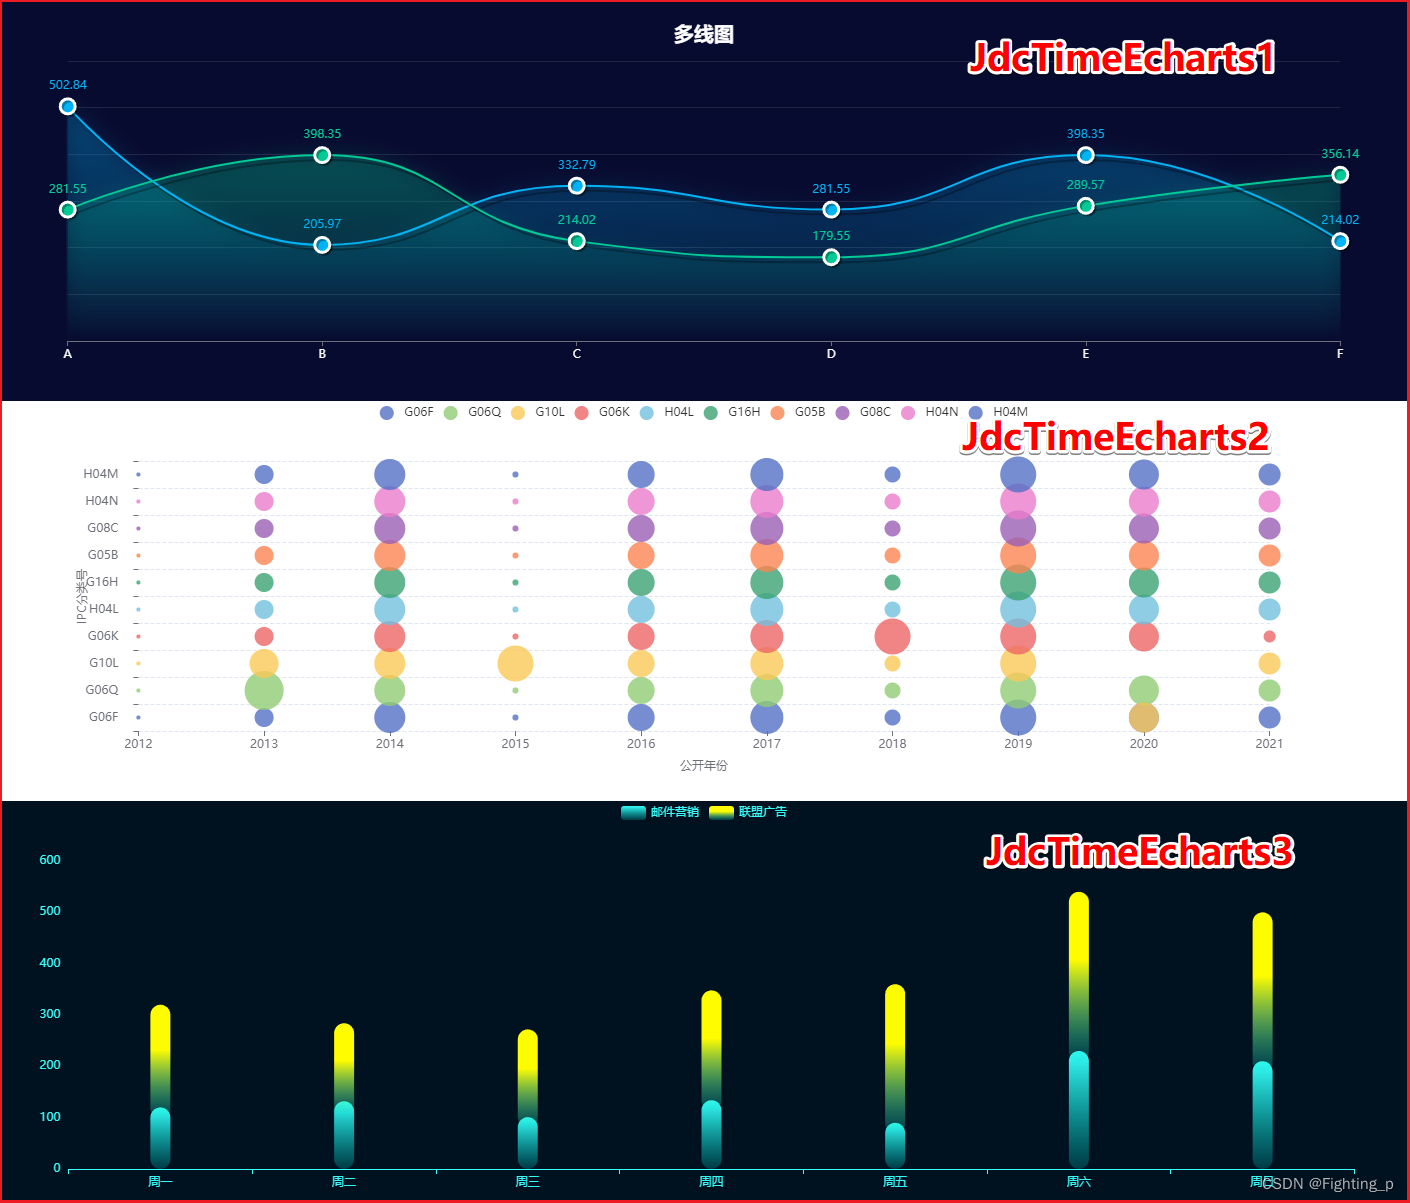
效果展示
相关数据处理(代码备份 - 可不看)
/**** echarts 折线图、散点图 - 数据处理 ****/

// 数据源
const info = {
  itemMap: {
    警告: [
      {
        total: 28,
        cfzl: '1',
        cfzlView: '警告',
        wfxl: '12',
        wfxlView: '超速行驶',
        jtfs: 'B11',
        jtfsView: '重型栏板半挂车'
      },
      {
        total: 3,
        cfzl: '1',
        cfzlView: '警告',
        wfxl: '17',
        wfxlView: '未低速通过',
        jtfs: 'B11',
        jtfsView: '重型栏板半挂车'
      },
      {
        total: 6,
        cfzl: '1',
        cfzlView: '警告',
        wfxl: '26',
        wfxlView: '违法停车',
        jtfs: 'B11',
        jtfsView: '重型栏板半挂车'
      },
      {
        total: 21,
        cfzl: '1',
        cfzlView: '警告',
        wfxl: '28',
        wfxlView: '违法装载',
        jtfs: 'B11',
        jtfsView: '重型栏板半挂车'
      },
      {
        total: 3,
        cfzl: '1',
        cfzlView: '警告',
        wfxl: '49',
        wfxlView: '其他影响安全行为',
        jtfs: 'B11',
        jtfsView: '重型栏板半挂车'
      },
      {
        total: 1,
        cfzl: '1',
        cfzlView: '警告',
        wfxl: '28',
        wfxlView: '违法装载',
        jtfs: 'B21',
        jtfsView: '中型栏板半挂车'
      }
    ],
    罚款: [
      {
        total: 56,
        cfzl: '2',
        cfzlView: '罚款',
        wfxl: '12',
        wfxlView: '超速行驶',
        jtfs: 'B11',
        jtfsView: '重型栏板半挂车'
      },
      {
        total: 6,
        cfzl: '2',
        cfzlView: '罚款',
        wfxl: '17',
        wfxlView: '未低速通过',
        jtfs: 'B11',
        jtfsView: '重型栏板半挂车'
      },
      {
        total: 12,
        cfzl: '2',
        cfzlView: '罚款',
        wfxl: '26',
        wfxlView: '违法停车',
        jtfs: 'B11',
        jtfsView: '重型栏板半挂车'
      },
      {
        total: 42,
        cfzl: '2',
        cfzlView: '罚款',
        wfxl: '28',
        wfxlView: '违法装载',
        jtfs: 'B11',
        jtfsView: '重型栏板半挂车'
      },
      {
        total: 6,
        cfzl: '2',
        cfzlView: '罚款',
        wfxl: '49',
        wfxlView: '其他影响安全行为',
        jtfs: 'B11',
        jtfsView: '重型栏板半挂车'
      },
      {
        total: 2,
        cfzl: '2',
        cfzlView: '罚款',
        wfxl: '28',
        wfxlView: '违法装载',
        jtfs: 'B21',
        jtfsView: '中型栏板半挂车'
      }
    ]
  },
  columns: [
    { jtfs: 'B11', jtfsView: '重型栏板半挂车' },
    { jtfs: 'B21', jtfsView: '中型栏板半挂车' }
  ]
}

// 处理代码
function optionsObj() {
  const xAxisData = []
  const yAxisData = []
  this.info?.columns?.forEach((item) => {
    !xAxisData.includes(item.jtfsView) && xAxisData.push(item.jtfsView)
  })
  const seriesNameList = Object.keys(this.info?.itemMap)
  const seriesList1 = []
  const seriesList2 = []
  seriesNameList.forEach((seriesName) => {
    const data1 = []

    this.info?.itemMap[seriesName].forEach((i) => {
      const xIndex = xAxisData.findIndex((xItem) => xItem === i.jtfsView)
      const yIndex = yAxisData.findIndex((yItem) => yItem === i.wfxlView)
      if (!yAxisData.includes(i.wfxlView)) {
        yAxisData.push(i.wfxlView)
        seriesList2.push({
          name: i.wfxlView,
          data: [[xIndex, seriesList2.length, i.total]]
        })
      } else {
        const seriesList2Index = seriesList2.findIndex(
          (seriesList2Item) => seriesList2Item.name === i.wfxlView
        )
        const seriesDataIndex = seriesList2[seriesList2Index].data.findIndex(
          (dataItem) => dataItem[0] === xIndex && dataItem[1] === yIndex
        )
        if (seriesDataIndex !== -1) {
          seriesList2[seriesList2Index].data[seriesDataIndex] = [
            xIndex,
            yIndex,
            i.total + seriesList2[seriesList2Index].data[seriesDataIndex][2]
          ]
        } else {
          seriesList2[seriesList2Index].data.push([xIndex, yIndex, i.total])
        }
      }
      data1[xIndex] = (data1[xIndex] || 0) + (i.total || 0)
    })
    seriesList1.push({
      name: seriesName,
      data: data1
    })
  })

  console.log('xAxisData----', xAxisData)
  console.log('yAxisData----', yAxisData)
  console.log('seriesList1----', seriesList1)
  console.log('seriesList2----', seriesList2)

  return {
    // 折线图
    JdcTimeEcharts1: lineEcharts({
      xAxisData,
      seriesList: seriesList1
    }),
    // 散点图
    JdcTimeEcharts2: scatterEcharts({
      xAxisName: '车辆类型',
      xAxisData,
      yAxisData,
      seriesList: seriesList2
    })
  }
}

// 处理结果
const xAxisData = ['重型栏板半挂车', '中型栏板半挂车']
const yAxisData = ['超速行驶', '未低速通过', '违法停车', '违法装载', '其他影响安全行为']
const seriesList1 = [
  {
    name: '警告',
    data: [61, 1]
  },
  {
    name: '罚款',
    data: [122, 2]
  }
]
const seriesList2 = [
  {
    name: '超速行驶',
    data: [[0, 0, 84]]
  },
  {
    name: '未低速通过',
    data: [[0, 1, 9]]
  },
  {
    name: '违法停车',
    data: [[0, 2, 18]]
  },
  {
    name: '违法装载',
    data: [[0, 3, 63], [1, 3, 3]]
  },
  {
    name: '其他影响安全行为',
    data: [[0, 4, 9]]
  }
]

/**** echarts图表option配置项 ****/
// import * as Echarts from 'echarts'

// 折线图
function lineEcharts({ xAxisData = [], seriesList = [] }) {
  const colorList = [
    '#00b3f4',
    '#00ca95',
    '#fce07e',
    '#f18585',
    '#8fcde5',
    '#62b58e',
    '#fd9d75',
    '#ae80c3'
  ]
  const defaultColor = '#ee96d6'

  return {
    backgroundColor: '#080b30',
    title: {
      show: !xAxisData.length && !seriesList.length,
      text: '暂无数据',
      left: 'center',
      top: 'center',
      textStyle: {
        color: '#fff'
      }
    },
    tooltip: {
      trigger: 'axis',
      axisPointer: {
        lineStyle: {
          color: {
            type: 'linear',
            x: 0,
            y: 0,
            x2: 0,
            y2: 1,
            colorStops: [
              {
                offset: 0,
                color: 'rgba(0, 255, 233,0)'
              },
              {
                offset: 0.5,
                color: 'rgba(255, 255, 255,1)'
              },
              {
                offset: 1,
                color: 'rgba(0, 255, 233,0)'
              }
            ],
            global: false
          }
        }
      }
    },
    grid: {
      top: '15%',
      left: '5%',
      right: '5%',
      bottom: '15%'
      // containLabel: true
    },
    xAxis: [
      {
        type: 'category',
        axisLine: {
          show: true
        },
        splitArea: {
          // show: true,
          color: '#f00',
          lineStyle: {
            color: '#f00'
          }
        },
        axisLabel: {
          color: '#fff'
        },
        splitLine: {
          show: false
        },
        boundaryGap: false,
        // data: ['A', 'B', 'C', 'D', 'E', 'F']
        data: xAxisData
      }
    ],

    yAxis: [
      {
        type: 'value',
        min: 0,
        // max: 140,
        splitNumber: 4,
        splitLine: {
          show: true,
          lineStyle: {
            color: 'rgba(255,255,255,0.1)'
          }
        },
        axisLine: {
          show: false
        },
        axisLabel: {
          show: false,
          margin: 20,
          textStyle: {
            color: '#d1e6eb'
          }
        },
        axisTick: {
          show: false
        }
      }
    ],
    series: seriesList.map((item, index) => {
      return {
        name: item.name,
        type: 'line',
        smooth: true,
        showAllSymbol: true,
        symbol: 'circle',
        symbolSize: 15,
        lineStyle: {
          normal: {
            color: colorList[index] || defaultColor,
            shadowColor: 'rgba(0, 0, 0, .3)',
            shadowBlur: 0,
            shadowOffsetY: 5,
            shadowOffsetX: 5
          }
        },
        label: {
          show: true,
          position: 'top',
          textStyle: {
            color: colorList[index] || defaultColor
          }
        },
        itemStyle: {
          color: colorList[index] || defaultColor,
          borderColor: '#fff',
          borderWidth: 3,
          shadowColor: 'rgba(0, 0, 0, .3)',
          shadowBlur: 0,
          shadowOffsetY: 2,
          shadowOffsetX: 2
        },
        areaStyle: {
          normal: {
            color: new Echarts.graphic.LinearGradient(
              0,
              0,
              0,
              1,
              [
                {
                  offset: 0,
                  color: (colorList[index] || defaultColor) + '4d' // 30%
                },
                {
                  offset: 1,
                  color: (colorList[index] || defaultColor) + '00' // 0%
                }
              ],
              false
            ),
            shadowColor: (colorList[index] || defaultColor) + 'e6', // 90%
            shadowBlur: 20
          }
        },
        // data: [502.84, 205.97, 332.79, 281.55, 398.35, 214.02]
        data: item.data
      }
    })
  }
}
// 散点图
function scatterEcharts({ xAxisName = '', xAxisData = [], yAxisData = [], seriesList = [] }) {
  return {
    title: {
      show: !xAxisData.length && !yAxisData.length && !seriesList.length,
      text: '暂无数据',
      left: 'center',
      top: 'center',
      textStyle: {
        color: '#fff'
      }
    },
    tooltip: {
      position: 'top',
      formatter: function(params) {
        return (
          yAxisData[params.value[1]] +
          '<br />' +
          params.marker +
          xAxisData[params.value[0]] +
          ':' +
          params.value[2]
        )
      }
    },
    legend: {
      show: false,
      left: 'center'
    },
    xAxis: {
      name: xAxisName,
      nameLocation: 'center',
      nameGap: 30,
      type: 'category',
      boundaryGap: false,
      splitLine: {
        show: false
      },
      axisLine: {
        show: false
      },
      // data: ['2012', '2013', '2014', '2015', '2016', '2017', '2018', '2019', '2020', '2021'],
      data: xAxisData
    },
    yAxis: {
      name: '',
      nameLocation: 'center',
      nameGap: 50,
      type: 'category',
      axisLabel: {
        margin: 20
      },
      splitLine: {
        show: true,
        lineStyle: {
          type: 'dashed'
        }
      },
      axisLine: {
        show: false
      },
      // data: ['G06F', 'G06Q', 'G10L', 'G06K', 'H04L', 'G16H', 'G05B', 'G08C', 'H04N', 'H04M'],
      data: yAxisData
    },

    series: seriesList.map((item) => {
      return {
        name: item.name,
        type: 'scatter',
        symbolSize: (val) => {
          return val[2] % 40
        },
        animationDelay: (idx) => {
          return idx * 5
        },
        // data: [
        //   [0, 0, 444],
        //   [1, 0, 699],
        //   [2, 0, 951],
        //   [3, 0, 1126],
        //   [4, 0, 1347],
        //   [5, 0, 1993],
        //   [6, 0, 3096],
        //   [7, 0, 5196],
        //   [8, 0, 1750],
        //   [9, 0, 222]
        // ],
        data: item.data
      }
    })
  }
}
数据处理后页面展示